
 ?Mathematical formulae have been encoded as MathML and are displayed in this HTML version using MathJax in order to improve their display. Uncheck the box to turn MathJax off. This feature requires Javascript. Click on a formula to zoom.
Abstract
The paper presents a portable surface stress biosensor test system based on ZigBee technology for health care, which consists of a biosensor chip and an electronic test platform. The biosensor chip is a micro-scale and label-free polydimethylsiloxane micromembrane capacitive surface stress sensor. This chip consists of two micromembranes, in which one acts as the active unit and the other as reference. The signal difference of active and reference is acquired with the aid of capacitive detection circuit, which has high signal-to-noise ratio and speedy electrical readout. The electronic test platform is designed based on ZigBee technology to realize the accurate detection of small capacitance and the wireless signal transmission. The capacitive resolution of the system is 0.1 fF (femtofarad). The capacitance measured by the system is diminished and exaggerated with the increase and decrease of ethanol volume, which is corresponding to the capacitive formula. The haemoglobin test results from the system are consistent with the theoretical analysis and the test results from Agilent B1500A, which demonstrates that the system can be considered as a measurer of haemoglobin for clinical applications. The experiments also illustrate that the biosensor test system has good stability and multiplicity.
Introduction
With the development of biotechnology and detection technology, a portable biosensor test system has been developed in recent years. It is believed that the availability of portable biosensor test system has many potential applications in the disease diagnosis. Portable biosensor test system allows real-time, rapid, label-free and multiplexed detection with high selectivity and sensitivity, which has the potential to improve health care. An integrated silicon–polydimethylsiloxane (PDMS) cell-cartridge was fabricated to successfully record action potential activity from cardiomyocytes outside of the laboratory under realistic application conditions.[Citation1] A monitoring system which consists of a bio-chemical sensor, hardware with peripheral interface controller (PIC) microcontroller and control circuits, and signal analyzing part was used to measure urine glucose during daily life.[Citation2] Pantelopoulos and Bourbakis present a comprehensive survey for health monitoring, by comparing a variety of current system implementations and approaches and identifying their technological shortcomings.[Citation3] Ramanathan and Manjrekar report a wireless sensor network (WSN) for monitoring patient's physiological signal (such as heart rate, respiration rate, blood pressure) continuously using ZigBee.[Citation4] Li et al. presents a wireless high-precision microbial biosensor data acquisition system which can availably solve wiring problem of special environment and is easy to connect to the Internet.[Citation5]
As a new technology of micro-scale and label-free system, surface stress biosensors have immense potential to satisfy the demand for better sensor quality, easy integration and rapid detection. These kinds of sensors use a balance of free energy change and offer a universal platform for chemical and biological sensing.[Citation6] They have many advantages, such as short response time (less than milliseconds), simple preparation and testing procedures, enabling multiple sensing, and a typical sensitivity at nanogram, picolitre, femtojoule and attomolar level.[Citation7] Micromembrane is a typical basic sensitive element of the surface stress biosensors.[Citation8] Because the bottom surface of the micromembrane can be sealed and isolated from test solutions, there is no backside physisorption essentially and its signal-to-noise ratio can be effectively improved. In addition, the test signal can be easily converted into electrical output, such as capacitive or piezoresistive signals, which will supply the technological support for the portable Point of Care (PoC) systems. So it is necessary to research a portable test system for the surface stress biosensors.
ZigBee is one standards-based wireless technology, which can meet the unique needs of low-cost, low-power wireless sensor and control networks in traffic management, military technology, urban construction, fire control, biological research, disaster monitoring and other fields.[Citation9,Citation10] It uses the 2.4 GHz radio frequency to deliver a variety of reliable and easy-to-use standards anywhere in the world. With reliable wireless performance, ZigBee gives the freedom and flexibility to do more and it also offers a variety of innovative standards smartly designed to be green and cheap.
In this paper, the capacitive surface stress biosensor is shown. A portable micromembrane capacitive surface stress biosensors test system based on the ZigBee technology is first designed and tested. The test signal of the sensor can be easily converted into capacitive output. The circuit system can monitor the small capacitive signal in real time and realize the wireless information interchange between portable test system and PC with the aid of ZigBee technology.
Materials and methods
Capacitive surface stress biosensor
This chip consists of two micromembranes that are manufactured into paralleled array, in which one acts as the active unit and the other as reference. Figure S1 in the Online Supplementary Appendix shows the surface stress micromembrane capacitive biosensor chip. The active one is sensitive to specific analytes. The reference is used to detect the environmental factors, such as temperature change, laminar or turbulent flow around the reaction, vibration (including acoustic noise) and non-specific binding.[Citation11] The signal difference of active and reference is acquired with the aid of capacitive detection circuit as precious information. P1, P2 is the electrode pin of active sensitive unit, while P3, P4 is that of reference sensitive unit.
By means of micro-fabrication technique, the biosensor was fabricated, and was composed of four layers: a thin film of chromium and gold was sputtered on silicon substrate as the bottom electrode layer, a gap layer, a PDMS thin film layer (500 μm diameter and 1 μm thickness), and another thin film of chromium and gold which acts as the top electrode layer was sputtered on the surface of the PDMS thin film layer ((b)); the cross-sectional view of the biosensor along the line AA′ is shown in (a) ((a) is the top view of the chip's schematic diagram). Holes 1 and 2 shown in (a) are used to etch the photoresist for the release of PDMS micromembrane. (c) shows the 3D image of the biosensor scanned by white light interferometer (Bruker, Contour®). It is seen that some photoresist remained in the releasing hole 2, but this cannot induce a negative effect on the biosensor. The red part marks the top electrode. The releasing PDMS micromembrane and the gap between PDMS micromembrane and bottom electrode cannot be displayed in the 3D image because the gold top electrode is light-tight. The releasing PDMS micromembrane and the gap can be shown by scanning electron microscopy (SEM) image (FE-SEM, JSM-7001F) (), which proves that the biosensor was fabricated successfully.
Figure 1. The top view of the chip's schematic diagram (a), the cross-section view of the biosensor along the line AA′ (b), the 3D image of the biosensor (c).
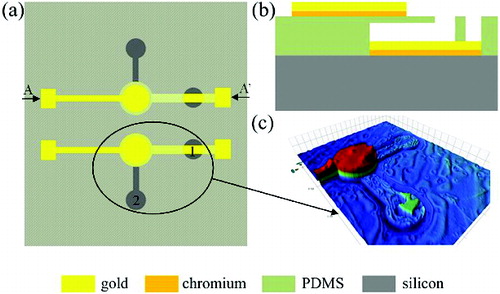
Figure 2. The SEM image of the releasing PDMS micromembrane and the gap.
PDMS, as a specific material of lower stiffness, easy processing, chemical inertness and unique biological compatibility,[Citation12,Citation13] is employed in the biosensor to acquire higher sensitivity.[Citation14] The top electrode can be modified to selectively attach probe molecules to the surface. When selective biological reactions occur between the analytes and probe molecules on the sensor surface, the changes in the intermolecular forces induce a surface stress change which causes the micromembrane to deform.[Citation8,Citation15,Citation16] This deformation of micromembrane changes the distance between the two electrodes, leading to the variation of capacitance.
Electronic test platform
An electronic test platform is designed to realize the accurate detection of small capacitance, which is convenient for the further preparation of portable equipment. In order to realize remote monitoring and provide real-time feedback information, ZigBee technology was used to realize the wireless information interchange between circuit and PC. The electronic test platform consists of a data acquisition circuit, a digital control circuit and a data transmission circuit (sensor node and central node). Figure S2 in the Online Supplementary Appendix shows the block diagram of the total system. One interface of capacitance input channels is directly connected to P1 and P2 of active micromembrane, while the other links with P3 and P4.
The main function of data acquisition circuit is to convert analogue capacitive signal which is obtained from biosensor chip into digital signals. AD7746 (Analog Devices, 24 bits, two capacitance input channels) is the core device of the data acquisition system and it is also well suited for arrays and compact systems. In order to achieve a higher resolution and a better data quality, the conversion time of AD7746 is set to 109.6 ms.
The digital control circuit is designed based on MSP430F149 (Texas Instruments, 16 bits) which have many virtues, such as low power consumption, 60 KB of flash memory, 1 KB of RAM and I2C-compatible serial interface. In this system, MSP430F149 is responsible for controlling AD7746, connecting to a computer and ZigBee module through serial interface for either real-time experiment monitoring, data wireless transmission or post-experiment analysis. The paralleled array biosensor chip, AD7746, MSP430F149 and MAX3232 are mounted on a printed circuit board (PCB), and P3.4/UTXD0 (No. 32, transmit data out-USART0/UART mode), P3.5/URXD0 (No. 33, receive data in-USART0/UART mode), DVCC (No. 1,digital supply voltage, positive terminal) and DVSS (No. 63,digital supply voltage, negative terminal) of MSP430F149 are extracted by row pins, respectively.
The main working component of data transmission circuit is CC2530 (Texas Instruments), including sensor node and central node. The CC2530 is a fully compliant 2.4 GHz IEEE802.15.4 RF transceiver that provides a versatile low-cost solution for wireless sensor networking applications. The high level of integration helps to reduce the overall cost. The sensor node and central node (contains CC2530 and FT232) are mounted on PCBs, respectively, and P0.2 (No. 17, receive data in-USART0/UART mode), P0.3 (No. 16, transmit data out-USART0/UART mode), DVDD (No. 10 and No. 39, digital power supply connection) and GND (No. 1, No. 2, No. 3 and No. 4) of CC2530 on sensor node are extracted by row pins, respectively.
The data acquisition circuit collects the measured data, converts the capacitive signal into 24-bits binary digital codes and transmits this digital information to the control circuit. Data are uploaded through serial interface to PC directly under the wired situation or transmitted to the sensor node under the wireless situation. The sensor node transmits the data to the central node through ZigBee network and uploaded through serial interface to PC finally for either real-time experiment monitoring or post-experiment analysis. The P0.2, P0.3, DVDD and GND of CC2530 on sensor node are connected to the P3.4/UTXD0, P3.5/URXD0, DVCC and DVSS of MSP430F149, respectively, to realize wireless transmission by dubond threads.
Software
Serial Toolbox software V1.0 (Software right: 2013SR079616, China) is designed to intuitively display the data which were transmitted to PC via ZigBee; it also groups all the information. Eight-bit data obtained from the serial port can be grouped in the software, includes the number of data (in each case, it is from one to eight). Because the chip of AD7746 is a 24-bit processor, the number of data in each group is set to 3. Then, single or multiple records of identical and non-identical groups can implement operation, as the calculation result can be real-time, graphically displayed and saved. The software also has the function of alarming; when the result exceeds the pre-set range, alarm menu will pop-up and beep. The flow chart of the software design is shown in .
Figure 3. The flow chart of software design.
Biological sensing experiments
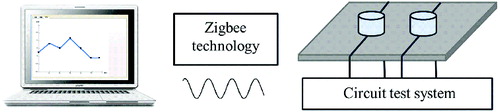
presents the principle scheme of biosensor test system, where the membrane deflection signal is converted to capacitive signal and detected by the electronic test platform. Then the test signal was real-time transmitted to PC with the aid of ZigBee technology. The platform of the biosensor test system is represented in Figure S3 in the Online Supplementary Appendix. The upper layer consists of biosensor chip, data acquisition circuit and digital control circuit; and the lower layer is sensor node circuit.
Figure 4. The principle scheme of biosensor test system.
Characteristics test
Ethanol was loaded onto the membrane using a pipette; 4.5 μL was added each time until 18 μL was reached. Then, the ethanol was gradually dried. The change of the sensor capacitance was measured using the designed portable measurement platform.
Functionalization
HS-(CH2)15-COOH (16-MHA, 10 mmol/L) was chosen as the functional molecules and then 4 μL of standard thiol molecules functional solution was decanted into reservoirs. The thiol molecules bind strongly to the gold of the top electrode layer until all solutions are evaporated. Once the micromembranes were functionalized, the entire biosensor chip was washed with ethanol to remove the non-specific bound. The functionalization process was detected using the electronic test platform and Agilent B1500A semiconductor device analyzer.
Hgb detection
Hgb (haemoglobin) is functioning as a carrier for the oxygen molecules (O2) and carbon dioxide molecules (CO2) to generate energy for life activities.[Citation17] Based on the molecular structure, Hgb has many chemical bonds, such as –OH and =O. If Hgb level is low, the heart has to push higher amounts of blood to the different body organs, which puts a strain on the cardiopulmonary system. Instead, if Hgb levels are too high as a result of high red blood cell count, intravascular sludging can occur which could lead to a stroke. Therefore, the measurement of Hgb holds significant value in the prevention and treatment of disease. Hgb was employed to undergo the biological sensing experiment. Blood sample (2 μL) was loaded onto the functionalized micromembrane-sensitive unit.
Results and discussion
The AD7746 resolution is limited by noise. The circuit detection performance varies with the selected conversion time. The conversion time of AD7746 is set to 109.6 ms, the actual P–P resolution is 16 bits, while the theoretical P–P resolution is 18.2 bits, the resolution of capacitance is 0.1 fF (femtofarad).
(1)
(1) Because the theoretical value is acquired in the ideal situation (noise is random and obeys the law of normal distribution), the loss of about 2 bits can be considered in normal range.
shows the change of capacitance with the volume of ethanol measured by the designed circuit system. The capacitance value varies with the change of ethanol volume evidently and the relationship between them is a reciprocal function. This can be explained from the fact that the gap between the two electrodes decreased with the increase of ethanol volume because of the action of gravity. Thus, the capacitance increased, which corresponds to the capacitive formula:
(2)
(2) where ɛ is the dielectric constant,
, ɛ0 is the vacuum dielectric constant (
), ɛr is the relative dielectric constant (
in the air), S is the effective overlap area of the two electrodes, and d is the distance between the two electrodes.
Figure 5. The test results of ethanol based on biosensors (error bars denote one standard deviation).
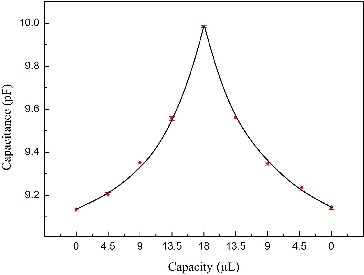
In the end, the capacitance decreased to its original value. This experiment demonstrates that the biosensor test platform has high sensitivity when the volume of ethanol is small. The test system has good stability and multiplicity. Each measurement was repeated five times to get the average capacitance value.
shows the detected capacitance by the biosensor test system and Agilent B1500A during the functionalized process and Hgb test. (a) records the capacitance signal throughout the functionalized process; the square dot line is the capacitances detected by the biosensor circuit system while the circle dot line was detected by Agilent B1500A. At the first stage, the gravity of standard functional solutions was the main factor causing the membrane of the biosensor to deflect, and the gap between the two electrodes became smaller, hence the capacitance was increasing. With the thiol molecules combining with the gold of the top electrode layer and the evaporation of standard functional solutions, the gap got larger again and the capacitance was decreasing. Finally, there was no functional solution; the compressive surface stress between the gold and the –HS group was the main influence on the membrane's deflection. Hence, the membrane has a convex deformation; the capacitance reaches a stable state. It indicates that the functionalized process was complete. The data of two curve point toward the same trend, which indicates the accuracy of the circuit testing system.
Figure 6. The test results of the functional process measured by the biosensor test platform and Agilent B1500A (a); and of Hgb measured by the biosensor test platform and Agilent B1500A (b).
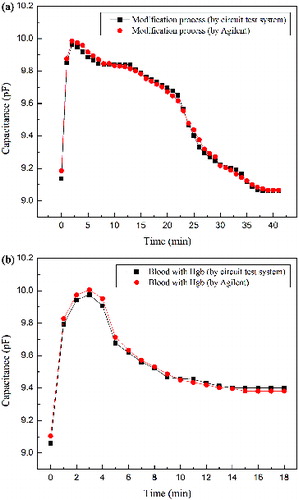
(b) shows the capacitive change during the Hgb detection process; the square dot line is the capacitance detected by the biosensor circuit test system while the circle dot line was detected by Agilent B1500A. The gravity of Hgb suspension liquid also was the primary factor affecting the deflection of membrane during the inception phase, so that, in the beginning, the capacitance has a sudden increase. With the tardily solidification of blood suspension liquid, the Van der Waals force and the surface stress, which is induced by -COOH groups of the thiol molecules and -OH and =O of the Hgb, became the main influence factor, leading to a larger gap and a smaller capacitance. In the final stage, the capacitance of detection was less than the capacitance of functionalization at the same period, which is consistent with the theoretical prediction. The biological experiment illustrates that the biosensor circuit test system based on the ZigBee technology has a good performance.
Conclusions
A portable surface stress biosensor test system based on ZigBee technology is presented and tested. The electronic test platform is designed to realize the accurate detection of minute capacitance, whose P–P resolution is 16 bits. The wireless information interchange between circuit and PC is improved to realize remote monitoring. Hgb is detected by this system and the test results are consistent with the theoretical prediction and the test results from the Agilent B1500A. The experiments demonstrate that the biosensor test system has good multiplicity and performance. Hence, this system can be used for blood testing and diagnostics. The salient features of this portable and integrated PoC biosensor device are that: (1) allows real-time, rapid, label-free and multiplexed detection with high selectivity and sensitivity; (2) uses electronic (capacitive detection) readout; (3) realizes wireless transmission of data with ZigBee technology. In addition, the biosensors can further expand access to genetic testing, environmental monitoring, industrial monitoring and quality control.
Supplemental data
Supplemental data for this article can be accessed at http://dx.doi.org/10.1080/13102818.2015.1040455
Online_Supplement.pdf
Download PDF (263.4 KB)Disclosure statement
No potential conflict of interest was reported by the authors.
Additional information
Funding
References
- DeBusschere BD, Kovacs GTA. Portable cell-based biosensor system using integrated CMOS cell-cartridges. Biosens Bioelectron. 2001;16:543–556.
- Park HD, Lee KJ, Yoon HR, Nam HH. Design of a portable urine glucose monitoring system for health care. Comput Biol Med. 2005;35:275–286.
- Pantelopoulos A, Bourbakis N. A survey on wearable biosensor systems for health monitoring. 30th Annual International IEEE EMBS Conference; 2008 Aug 20–24; Vancouver, BC, Canada; p. 4887–4890.
- Ramanathan P, Manjrekar P. Wireless sensor network for monitoring a patient's physical conditions continuously using ZigBee. Indian J Sci Technol. 2011;4(8):944–946.
- Li C, Jiao RL, Wang AC, Bai ZH. Microbial biosensor data acquisition system based on CC2530. Appl Mech Mater. 2013;333–335:417–422.
- Satyanarayana S. Surface stress and capacitive MEMS sensor arrays for chemical and biological sensing [dissertation]. Berkeley (CA): Taylor & Francis; 2005.
- Sang SB, Zhao Y, Zhang WD, Li PW, Hu J, Li G. Surface stress-based biosensors. Biosens Bioelectron. 2014;51:124–135.
- Zhang WD, Feng H, Sang SB, Shi Q, Hu J, Li PW, Li G. Structural optimization of the micro-membrane for a novel surface stress-based capacitive biosensor. Microelectron Eng. 2013;106:9–12.
- Hamza N, Touati F, Khriji L. Wireless biomedical system design based on ZigBee technology for autonomous healthcare. International Conference on Communication, Computer and Power (ICCCP); 2009 Feb 15–18; Muscat, Oman; p. 183–188.
- He DY. The ZigBee wireless sensor network in medical care applications. 2010 International Conference on Computer, Mechatronics, Control and Electronic Engineering (CMCE); 2010 Aug 24–26; Changchun, China; p. 497–500.
- Sang SB. An approach to the design of surface stress-based PDMS micro-membrane biosensors – concept, numerical simulations and prototypes [dissertation]. Germany: Taylor & Francis; 2010.
- De Silva MN, Paulsen J, Renn MJ, Odde DJ. Two-step cell patterning on planar and complex curved surfaces by precision spraying of polymers. Biotechnol Bioeng. 2006;93(5):919–927.
- Du Roure O, Saez A, Buguin A, Austin RH, Chavrier P, Siberzan P, Ladoux B. Force mapping in epithelial cell migration. Proc Natl Acad Sci USA. 2005;102(7):2390–2395.
- Sang SB, Witte H. A novel PDMS micro membrane biosensor based on the analysis of surface stress. Biotechnol Bioeng. 2010;25(11):2420–2424.
- Lim SH, Jaworski J, Satyanarayana S, Wang F, Raorane D, Lee SW, Majumdar A. Nanomechanical chemical sensor platform. Proceedings of the 2nd IEEE International Conference on Nano/Micro Engineered and Molecular Systems; 2007 Jan 16–19; Bangkok, Thailand; p. 886–889.
- Sang SB, Feng QL, Jian AQ, Duan QQ, Lian K, Zhang WD. Uses of alkanethiol effects on surface functionalization of gold membranes for biosensors. IEEE Sens J. 2015;15(3):1747–1755.
- Maton A, Hopkins J, McLaughlin CW, Johnson S, Warner MQ, LaHart D, Wright JD. Human biology and health. Englewood Cliffs (NJ): Taylor & Francis; 1993. ISBN: 0-13-981176-1.