
Abstract
Nowadays, one of the most striking challenges for Bulgarian limnologists comes from the attempts to implement the requirements of Water Framework Directive (WFD) for assessment of the ecological status of the water bodies. This work represents results from the monitoring of the reservoirs Aleksandur Stamboliyski, Antimovo, Batak, Burzina, Gorni Dubnik, Zhrebchevo, Iovkovtsi, Krapets, Mandra, Ognyanovo, Rabisha, Suedinenie, Tsonevo and the lakes Alepu, Atanasovsko Ezero, Dourankoulak, Pomoriysko Ezero, Shabla and Sreburna. The studies were conducted simultaneously in the summer months of 2011 and 2012 on the following parameters: algal taxonomic composition and abundance, presence/absence of algal blooms and blooms of potential toxic species, algal group index, reference index for macrophytes, water temperature, transparency, pH, conductivity, chlorophyll a, total phosphorus, total nitrogen, phosphate phosphorus, ammonium nitrogen, nitrate nitrogen and chemical oxygen demand. The ecological status was registered in the five WFD categories. The set of data, based on the detected species composition of 236 algal taxa and 33 species of macrophytes, allowed us to compare statistically the values of the used parameters and the water bodies according to their biodiversity and abiotic features. The obtained results are important for clarifying the official classification of the surface water bodies of Bulgaria according to State Order N4/14.09.2012 and for making proposals for its improvement. Comparisons of the finally attributed ecological status/potential, based on macrophytes and phytoplankton, showed some significant differences and were used as a basis for discussion of the parameters and their weighted values, used up-to-now for the assessment of Bulgarian water bodies.
Introduction
The European Community Water Framework Directive (WFD: 2000/60/EC) has stimulated the development and improvement of a large array of different national methods for monitoring and assessing biological quality of the surface freshwater bodies.[Citation1] The attempts to implement the requirements of European legislation documents and of WFD in particular for assessment of the system biointegrity (‘health’) denoted as ecological status/potential of national aquatic ecosystems, is one of the most recent striking challenges for Bulgarian limnologists. The definition of ecological status/potential as an expression of the quality of the structure and functioning of the ecosystem, looks at the abundance of aquatic flora and fauna, the availability of nutrients, and some other morphological and physicochemical features of water bodies, since it is more and more realized that water is not merely a consumer product, but a precious natural resource.
The main objectives of this study, commissioned by the Executive Environmental Agency of the Ministry of Environment and Waters of Bulgaria in 2011–2012, were (1) to assess the ecological status/potential of the water bodies according to the requirements of the WFD; and (2) to compare the modified in Bulgaria evaluation methods based on phytoplankton and macrophytes,[Citation2–5] in order to optimize the sampling and assessment protocols. In parallel, we analysed our data using multivariate analyses with the aim to identify the main environmental gradients determining the aquatic flora of the investigated lakes and reservoirs.
Materials and methods
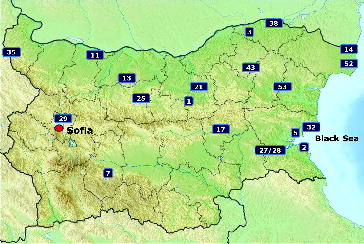
This work represents results from the monitoring of 13 reservoirs and six lakes classified in the general group of ‘lakes’ according to the national legislation and in particular in State Order N4 [Citation5]: the reservoirs Aleksandur Stamboliyski, Antimovo, Batak, Burzina, Gorni Dubnik, Zhrebchevo, Iovkovtsi (Shilkovtsi), Krapets, Mandra, Ognyanovo, Rabisha, Suedinenie and Tsonevo, and the lakes Alepou, Atanasovsko Ezero, Dourankoulak, Pomoriysko Ezero, Shabla and Sreburna ().
Figure 1. Map of Bulgaria with the location of the water bodies monitored in 2011–2012. Note: (Res. = Reservoir: 1 – Res. Aleksandur Stamboliyski; 2 – Alepou; 3 – Res. Antimovo, 5 – Atanasovsko Ezero; 7 – Res. Batak, 11– Res. Burzina, 13 – Res. Gorni Dubnik, 14 – Dourankoulak; 17 – Res. Zhrebchevo; 21 – Res. Iovkovtsi (Shilkovtsi), 25 – Res.Krapets; 27 – Res. Mandra (west); 28 – Res. Mandra (east); 29 – Res. Ognyanovo; 35 – Res. Rabisha; 32 – Pomoriysko Ezero; 38 – Sreburna; 43 – Res. Suedinenie; 52 – Shabla; 53 – Res. Tsonevo.
The field studies were conducted simultaneously during summer months of 2011 and 2012 on two WFD biological quality elements – ‘macrophytes’ and ‘phytoplankton’. The used parameters in this monitoring were standard, based on the requirements of State Order N4 [Citation5]: species/taxonomic composition and abundance, scaled data on algal blooms and presence/absence of blooms of potential toxic species, algal group index (AGI) of Catalan et al. [Citation6], reference index (RI) of Schaumburg et al. [Citation7] for macrophytes modified for use in Bulgaria,[Citation2,Citation4] temperature, transparency (Secchi depth), pH, conductivity, chlorophyll a, total phosphorus (TP), total nitrogen (TN), phosphate phosphorus, ammonium nitrogen, nitrate nitrogen and chemical oxygen demand. The ecological status/potential was registered in the five WFD categories: high, good, moderate, poor and bad, and represented with its corresponding colour (blue, green, yellow, brown and red, respectively), according to the relevant tables in State Order N4. There, for the phytoplankton-based assessment AGI with its ecological quality ratios (EQR) is used, in combination with six other parameters (total biomass, chlorophyll a, Secchi depth, % cyanobacteria, blooms of potentially toxic species, scaled presence of algal blooms) and the results were represented for two biological types – ‘oligotrophic’ and ‘mesotrophic’ lakes. The macrophyte-based lake assessment included RI evaluation and the results were represented according to the EQR values of seven biological types.[Citation5]
The methods used in the study were standard, according to the International and Bulgarian norms.[Citation2–5] However, some notes on their details had to be provided here, since there are some differences in methods applications in the references mentioned above, or possibilities to choose among different methods (e.g. use of an inverted microscope or of a standard light microscope for phytoplankton counts).
The first detail concerns the way of phytoplankton abundance counts. In this study, we used a Thoma counting chamber [Citation2,Citation8] and cell as a main counting unit. The biovolume and relevant biomass counts were based on the measurement of the dimensions of each cell, according to the method of stereometrical approximations,[Citation9] instead of the often recommended usage of average cell sizes. The reasons for this could be summarized as follows: (1) absolute need of cell measurements for correct taxa identification; (2) well-known phenomenon of appearance of cells with different size during the cell division process, e.g. the Pfitzer and McDonald rule for diatom division [Citation10]; (3) documented differences in cell sizes of the same taxon in different water bodies, or even in the same water body due to different temperature, nutrient content, etc. [Citation11]; (4) documented notable time-scaled differences in cell dimensions due to the presence or absence of the grazing pressure on the phytoplankters. See, for example, [Citation11]. Taking into account the reasons provided, it could be stated that the results obtained in this way reflected the real biomass for the concrete moment and site, moreover, all of the phytoplankton samples were analysed and proceeded by one person (M. Stoyneva).
The second detail concerns ‘% Cyanobacteria’ defined in the WFD among the criteria taken into account when considering phytoplankton as biological quality element and included in the tables of State Order N4. It should be applied with severe restriction to species found – in WFD Annex V. See, for example, [Citation2,Citation3,Citation5]. We calculated it correctly in this way even in the cases when abundant development of other cyanoprokaryote species was detected.
Table 1. Comparison of the final ecological state/potential assessment of 19 Bulgarian water bodies, based on phytoplankton (PA) and macrophytes (MA) in both years of investigation 2011 and 2012.
For macrophyte abundance, the standard method of Kohler [Citation12] was used, but Schaumberg's et al. [Citation7] RI was calculated in a different way, according to the modifications of Gecheva et al. [Citation4] and Belkinova and Gecheva [Citation2]. In the last two works, the values of the minimum total quantity of submerged macrophytes, as well as the additional criteria about the lower vegetation limit at each sampling point differ. However, both of them are cited in the references of State Order N4.
Multivariate analyses were run using principal components analyis (PCA) on the environmental and biological data of all sites. The aims were (1) to identify the main environmental gradients among the samples of lakes/reservoirs, allowing an objective classification and (2) to investigate the response of the communities to these gradients. The analysis was run on the average values of the sampling series. For the phytoplankton data, the taxa, which occurred at low relative abundance and/or which occurred only once, were removed from the data-set; mean relative abundance was log-transformed. For macrophytes, mean abundance was retained, and no transformation was applied. Thus, the initial data matrix included 236 phytoplankton taxa regrouped in 9 ‘groups’ (divisions/phyla or classes), 33 macrophyte taxa and 12 environmental variables. Several subsequent PCAs were carried out, using the Statistica 10 software from Statsoft®, with the environmental variables only in a first step and then with the environmental variables and the biological data, i.e. the main phytoplankton groups or the macrophytes.
Results and discussion
In the studied sites, a total of 236 phytoplankton taxa, among which green algae were the richest group (108), followed by cyanoprokaryotes (62), and 33 taxa of macrophytes were detected. The results from the final assessment of the ecological status/potential, employed according to the requirements of State Order N4, of the simultaneously monitored water bodies, showed significant differences with only 20% coincidence (). For some of the water bodies, the macrophyte-based assessment was impossible due to the lack of indicator species (water bodies with numbers 5, 17, 32).
This result provoked many questions, in spite of the fact that the use of primary producers for water quality assessment has a long and worldwide known tradition. See, for example, [Citation4,Citation13,Citation14].
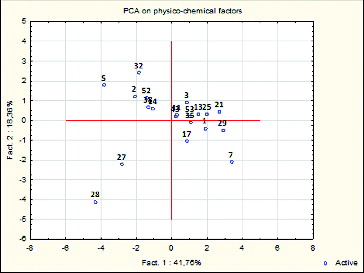
The first PCA on the environmental variables, showed a clear separation of water bodies along two main gradients represented by the two first principal components, which explained ∼60% of the variance. Secchi depth, altitude and depth were positively correlated with the first principal component, to which TN, TP and pH were negatively correlated, allowing to identify the main gradient in the data-set as a gradient of trophy. The second principal component may be identified as a salinity/area gradient, as conductivity and area were best correlated to this component ( and ). The ordination of the water bodies achieved in this way showed that all of the studied reservoirs (except the shallow Mandra Reservoir), which were generally the deeper/clearer water bodies, were located on the right side of the ordination (). On the other hand, the most shallow and generally eutrophic water bodies, practically all of the studied lakes (Alepou, Dourankoulak, Sreburna, Shabla and both of the hyperhaline lakes with salt production Atanasovsko Ezero and Pomoriysko Ezero) and the mentioned above the Reservoir Mandra, which was developed on the place of the natural lake Mandra, were located on the left ordination side ().
Figure 2. PCA on the environmental variables. Ordination of the physical and chemical variables on the two first components. Note: Abbreviations used: Secchi depth (Secchi); altitude (alt); chlorophyll a concentration (chla); temperature (temp); conductivity (cond); latitude (lat); longitude (lon). See and for identification of the water bodies.
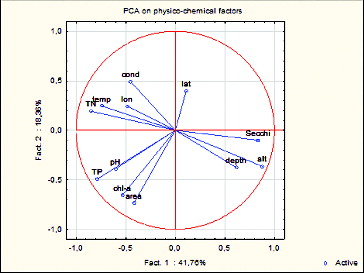
Figure 3. PCA on the environmental variables. Ordination of the water bodies on the two first components. Note: See and for identification of the water bodies and for environmental variables.
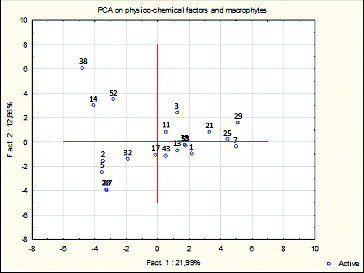
The next PCA was run on macrophyte data and the physical and chemical data. The gradients identified in the first analysis remained unchanged ( and ) and the macrophyte taxa responded to the environmental parameters according to their ecological preferences. As for the ordination of water bodies in the space of the two first factors, it was similar to that of the first PCA, with clearer separation, according to their vegetation. For example, there is a close ordination of both northern coastal lakes Dourankoulak and Shabla on the upper left side of , an overlapping of both sites of Mandra Reservoir and close situation of both of the shallow hyperhaline coastal lakes Atanasovsko Ezero and Pomoriysko Ezero on the lower left side of , as well as a separation of the reservoirs on the right side of the figure.
Figure 4. PCA on the macrophyte data and the environmental variables. Ordination of variables on the two first components. Note: See and for identification of the water bodies.
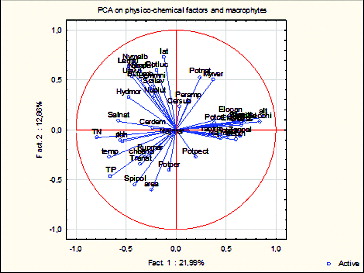
Figure 5. PCA on the macrophyte data and the environmental variables. Ordination of the water bodies on the two first factors. Note: See and for identification of the lakes and for environmental variables.
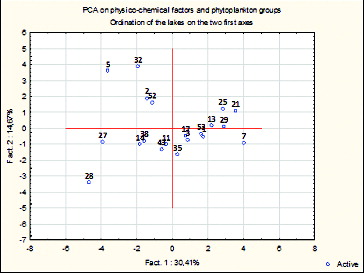
The PCA analysis conducted on the phytoplankton data and on the abiotic parameters showed again the same environmental gradient, mostly related to variables associated with the trophic status and the clear response of phytoplankton groups, according to their general ecological preferences (). For instance, there was a conspicuous relation of cyanoprokaryote biomass with the increase of the TP concentration, pH, chlorophyll a; in contrast, chrysophytes were inversely correlated with TN, TP and chlorophyll a, and positively correlated to variables associated with low productivity: high transparency, altitude and depth. The ordination of the water bodies showed a distribution along the first PCA axis, according to the trophic status and, on the left side of the ordination, together with the lakes and already mentioned shallow and hypereutrophic Mandra Reservoir, appeared both shallow and highly eutrophic reservoirs Burzina and Suedinenie. All these reservoirs were without fluctuations of the water level, resembling, in this way, the studied lakes ().
Figure 6. PCA on the phytoplankton data and the environmental variables. Ordination of variables on the two first components.
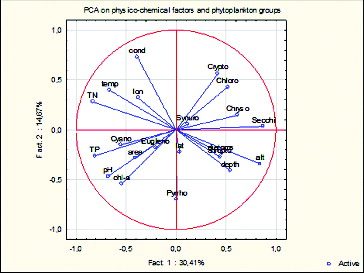
Figure 7. PCA on the phytoplankton data and the environmental variables. Ordination of the water bodies on the two first factors. Note: See and for identification of the water bodies and for environmental variables.
The results of the multivariate analysis showed that the response of phytoplankton and of the macrophyte assemblages was very consistent across the samples of Bulgarian water bodies, with a major influence of the depth and trophic status. In particular, the phytoplankton major taxonomic groups exhibited a strong relation with the lakes’ environmental variables: this is absolutely predictable, as the short generation time of phytoplankters allows them to respond directly to the water column features, such as nutrient status.[Citation9] By contrast, aquatic plants, even though they also responded primarily to the nutrient loading in the lakes, showed a slightly different pattern across lakes. This may be explained by their longer growth periods and also by their sensitivity to other components of the environment, notably the properties of the sediment and changes of the water level and the amount of herbivorous fish.
The next step of this study was to check carefully the indices and parameters with their weighted values, used in the Bulgarian legislation documents. The percentage representation of cyanoprokaryotes, estimated according to the WFD Annex V and requirements of State Order N4, described also in Belkinova et al. [Citation3] and Belkinova and Gecheva,[Citation2] in our opinion influences and often distorts the final result due to the fact that it is generally lower in comparison with the realistic situation and does not take into account many exotic and invasive species (e.g. Cylindrospermopsis raciborskii, Raphidiopsis mediterranea), which previously [Citation15] and during this study were detected as forming ‘blooms’ in some of our water bodies.
Problems appeared also in the final assessment based on macrophytes. The results from the two monitoring years differ in 50% of the cases, due to the different ways of application of assessment criteria about the lower vegetation limit pointed in Gecheva et al. [Citation4] and Belkinova and Gecheva [Citation2], but both were included in the references of the State Order N-4.[Citation5] The application of these criteria in reservoirs with strong fluctuations of the water level, is responsible for the observed/reported unreasonable decrease of the RI value, hence for the final assessment of the ecological status. In our opinion, these additional criteria should not be given such priority in multipurpose reservoirs with strong fluctuations of the water level, or the sampling period should not be restricted to the low water period, which, however, normally coincides with the vegetation period. An additional problem of the assessment based on macrophytes arises from the lack of indicator species in many coastal wetlands, which leads to the impossibility to get a final measure () and also to point a reference taxa at generic level, without taking into account the species ecological requirements (e.g. ‘Chara sp.’).
The comparison between , and shows that ordination of the water bodies obtained by the multivariate analysis does not always fit with the classification types of the State Order N4.[Citation5] This may indicate that the typology of Bulgarian lakes should be revised. This result, in combination with the data achieved from the analyses of abiotic parameters (separately and combined with the biotic data), provokes the general question of the necessity for improvement of the legislative classification of the water bodies, in order to achieve a realistic assessment of their ecological status/potential.
Conclusions
Comparisons of the finally attributed ecological status/potential and its relevant EQR, based on the primary producers and WFD biological elements ‘macrophytes’ and ‘phytoplankton’, showed some significant deviations in the final assessment of simultaneously sampled water bodies. These deviations, in our expert opinion, arose generally from the weighted values of the parameters, used up-to-now for this assessment and from the unclear and not completely finished classification system of the water bodies in Bulgaria. The results obtained in this study confirmed the expected strong correlation between the communities of phytoplankton and macrophytes and environmental variables, and proved: (1) the necessity of clarifying of the method/version chosen by the authorities, not including of all possible references in the legislation documents; (2) the necessity to look for other indices, or to relate better their values to the realistic groups of water bodies with denoting of the reference values and (iii) the necessity of clarifying the legislative classification of the water bodies in Bulgaria and of clear pointing out the reference sites.
Acknowledgements
The study was carried out in the framework of contracts of the Scientific Sector of Sofia Univeristy and Ekotan EOOD, commissioned by the Executive Environmental Agency of the Ministry of Environment and Waters of Bulgaria (EEA of MEWs) in 2011–2012 and all the data presented in this paper, being the property of EEA, are published with their kind permission. The authors would like to acknowledge the European Cooperation in Science and Technology, COST Action ES 1105 ‘CYANOCOST – Cyanobacterial blooms and toxins in water resources: Occurrence, impacts and management’ for adding value to this study through networking and knowledge sharing with European experts and researchers in the field.
Disclosure statement
No potential conflict of interest was reported by the authors.
References
- Lyche-Solheim A, Feld CK, Birk S, Phillips G, et al. Ecological status assessment of European lakes: a comparison of metrics for phytoplankton, macrophytes, benthic invertebrates and fish. Hydrobiologia. 2013;704:57–74.
- Belkinova D, Gecheva G, editors. Biological analysis and ecological assessment of the types of surface waters in Bulgaria. Plovdiv: Publ. House Plovdiv University “Paisiy Hilendarski”; 2013.
- Belkinova D, Mladenov R, Dimitrova-Dyulgerova I, Gecheva G, Cheshmedjiev S. Manual for phytoplankton analysis for the lake types on the territory of Bulgaria. Sofia: Consortium for Biological Monitoring; 2010.
- Gecheva G, Dimitrova-Dyulgerova I, Belkinova D, Mladenov R, Cheshmedjiev S. Methodics for biological monitoring. Macrohytes. Sofia: Consortium for Biological Monitoring; 2010.
- State Order N 4/14.09.2012 for characterization of the surface waters of the Minister of Environment and Waters. State Gazette 22; 2013.
- Catalan J, Ventura M, Munné A, Godé L. Desenvolupament d'un index integral de qualitat ecològica i regionalització ambiental dels sistemes lacustres de Catalunya. [Development of a comprehensive index of ecological quality and environmental regionalization of the lake systems of Catalonia] [in Spanish]. Agencia Catalana del Aigua, Generalitat de Catalunya; 2003. Available from: http://mediambient.gencat.net/aca/ca//planificacio/directiva/treballs.jsp.
- Schaumburg J, Schranz C, Stelzer D, Hofmann G. Action instructions for the ecological evaluation of lakes for implementation of the EU water framework directive: Makrophytes and Phytobenthos. Bavarian Environment Agency; 2007. Available from: http://www.planktonforum.eu/fileadmin/user_upload/instruction_protocol_lakes_2007.pdf.
- Karlson B, Cusack C, Bresnaan E, editors. Microscopic and molecular methods for quantitative phytoplankton analysis. Intergovernmental Environment Commission, Manuals and Guides. 2010;55:1–110.
- Rott E. Some results from phytoplankton counting intercalibration. Schweiz Z Hydrol. 1981;43:34–62.
- Temniskova D, Stoyneva M. Algology. Sofia: Pensoft; 2011.
- Stoyneva M, Descy JP, Vyverman W. Green algae in Lake Tanganyika: is morphological variation a response to seasonal changes? Hydrobiologia. 2007;578:7–16.
- Kohler A. Methoden der Kartierung von Flora und Vegetation von Süßwasserbiotopen [Methods for mapping of the flora and vegetation from freshwater biotopes] [in German.]. Landschaft + Stadt. 1978;10:73–85.
- Cellamare M, Morin S, Coste M, et al. Ecological assessment of French Atlantic lakes based on phytoplankton, phytobenthos and macrophytes. Environm Monit Assess. 2011;184:4685–4708.
- Ptachnik R, Solimini A, Bretum P. Performance of a new phytoplankton composition metric along a eutrophication gradient in Nordic lakes. Hydrobiologia. 2009;633:75–82.
- Stoyneva M. Steady-state phytoplankton assemblages in shallow Bulgarian wetlands. Hydrobiologia. 2003;502:169–176.