
 ?Mathematical formulae have been encoded as MathML and are displayed in this HTML version using MathJax in order to improve their display. Uncheck the box to turn MathJax off. This feature requires Javascript. Click on a formula to zoom.
Abstract
The purpose of this study was to increase the yield and purity of white tea polysaccharides (WTPS) by using traditional techniques available for the separation. Response surface methodology was implemented to predict the optimum conditions for the extraction of polysaccharides in white tea. A Box–Behnken design was used to monitor the effect of extraction temperatures (55 °C, 60 °C, 65 °C, X1), ratio of water solutions to material (10, 12, 14 mL/g, X2), duration of extraction time (60, 90, 120 min, X3) and number of extractions (2, 3, 4, X4) on the dependent variable yield of WTPS (Y, %). In extraction under pre-established conditions, the correlation coefficients (R2) and Adj-R2 of the models for the extraction of WTPS were 0.9932 (P < 0.001) and 0.9872, respectively. As a result, the optimum conditions for WTPS extraction were the following: ratio of water solutions to raw material – 12.48 mL/g, extraction temperature – 54.1 °C, number of extractions – 4 and duration of extraction time – 97.8 min.
Keywords:
Introduction
Tea polysaccharide is one of the main bioactive components with anti-oxidant, anti-blood coagulation, anti-radiation, anti-cancer and immunological activities.[Citation1–3] Much attention has been paid to the bioactivities of tea polysaccharides in recent decades and great advances have been made in the bioactive and chemical studies.[Citation4,Citation5] The white tea differs from the other tea types, because it is covered with white leaf hairs and is classified as Silver Needle. It is less known in the United States and Europe, but it has been receiving increasing attention in the Western communities.[Citation6–8] Response surface methodologies (RSM) are a collection of statistical techniques originally described by Box and Wilson [Citation9] as being effective for desirable responses that are influenced by the factors and their interactions.[Citation10]
The research objectives in this study were to determine the optimum extraction factors of the white tea polysaccharides and to assess their effects by using RSM.
Materials and methods
Materials
White tea was purchased from Fuding County, Fujian Province, China. The white tea sample was grounded into a powder by using a mill (A11 basis. IKA Instrument Co., Ltd., Germany) and screened through a 50 mesh sieves. It was stored until further use. Sephadex G-150 was bought from Pharmacia Co. (Sweden). All reagents used in the experiments were of analytical grade.
Separation of polysaccharides
White tea leaves (1000 g) grounded into powder were exhaustively extracted with a mixture solvent of ethanol/ethyl acetate (1:1, V/V) for 3 h to remove some organic substances, such as tea polyphenol, fat, caffeine and tea pigments. The residue was treated with 1% (w/v) aqueous NaCl solution in a designed temperature of 55 °C for 1 h. Then, the combined water solutions extracts were treated with 2% (w/v) aqueous NaHCO3 solution (pH ≈ 9) in different designed temperatures (55 °C, 60 °C, 65 °C), chosen in preliminary experiments in order to protect the structure of the tea polysaccharides, ratios of water solutions to material (10, 12, 14 mL/g), durations of extraction time (60, 90, 120 min) and number of extractions (2, 3, 4).
Finally, crude polysaccharide was obtained by a centrifugation at 10,000 rpm for 20 min after sequentially repeated extractions with ethanol (extract to ethanol ratio of 1:2 (V/V)) [Citation11] decolourization with H2O2 solution, dialization and lyophilization to get the greyish white tea polysaccharides (WTPS). The yield of polysaccharides was determined by the method of Dubois and Fox.[Citation12,Citation13]
Experimental design and statistical analysis
In this study, a central composite design [Citation14] was used to estimate the simultaneous effect of four independent variables (Xn) on dependent variables (Y) of the extracts. Four independent variables were extraction temperature (55 °C, 60 °C, 65 °C, X1), ratio of water solutions to material (10, 12, 14 mL/g, X2), duration of extraction time (60, 90, 120 min, X3) and number of extractions (2, 3, 4, X4). The response was the yield of WTPS (Y, %). For each factor, a conventional level was set to zero, as a coded level. The independent variables were coded at three levels (−1, 0 and 1) and their values were selected on the basis of preliminary experiments for the extraction yield of WTPS (Y, %). The complete design consisted of 31 experimental points including 7 replications of the centre points. The design matrix and variable combinations are presented in . The extractions were performed in triplicate at all design points in a randomized order.
Table 1. Box–Behnken design matrix and the response values for the yield of WTPS.
A statistical analysis system from Design-Expert 8.0.5 Software (Trial version, Stat-Ease Inc., Minneapolis, MN, USA) was used to predict the models through regression analysis and analysis of variance (ANOVA). The optimum extraction conditions for maximizing the responses to the yield of WTPS were pre-established, by which subsequent confirmatory experiments were carried out to validate the equations.
The regression equation for the yield of WTPS is shown in EquationEquation (1)(1)
(1) ,
(1)
(1)
Results and discussion
Predicted model and statistical analysis
shows the levels of the yield of WTPS of each of the 31 experimental sets, including 7 replicates at the centre point, generated by the principles of RSM, used in this study. The results of all experimental sets were used for modelling the yield of WTPS. Then, the predicted model was determined by multiple regression analyses.
EquationEquation (1)(1)
(1) indicated that the extraction temperature had the most linear effect on the yield of WTPS, as it showed the largest positive linear coefficient. The experimental data were statistically analysed by ANOVA and the results are given in .
Table 2. Analysis of variance (ANOVA) for the response surface quadratic model.
The ANOVA of the quadratic regression model indicated that the model was significant, as the low dispersion (R2 = 0.9932), high model F-value (166.14) and low P-value (P < 0.0001). Meanwhile, the lack of fit F-value of 1.61 and P-value of 0.2903 implied that the lack of fit was insignificant, relative to the pure error, due to noise. The information in showed that the linear coefficients (X1, X2, X3 and X4), cross product coefficients (X1 × X4) and quadratic term coefficient (X1 × X1, X2 × X2 and X3 × X3) were significant (P < 0.05), and then the other term coefficients were not significant (P > 0.05).
Impact of processing parameters
The effect of the different parameters on the extract yield was simulated by using Design-Expert software against any two independent variables by plotting the response surface plot.
Meanwhile, considering all the possible combinations, six response surfaces were obtained.
The interactive roles of extraction temperature, ratio of water solutions to material, duration of extraction time and number of extractions are illustrated in the three-dimensional (3D) curves of the calculated response surface shown in .
Figure 1. Response surface plots showing the interaction effects of extraction temperature, ratio of water solutions to material, extraction time and number of extractions on the yield of WTPS. Effects of different factors on the yield of WTPS: (a) effect of ratios of water solutions to the raw material and extraction temperatures, (b) extraction temperatures and extraction times, (c) extraction temperatures and number of extractions, (d) ratios of water solutions to raw material and extraction times, (e) ratios of water solutions to raw material and number of extractions, (f) extraction times and number of extractions.
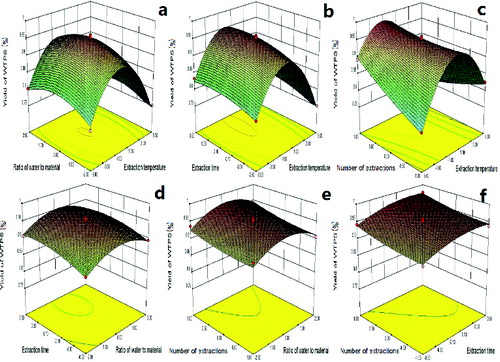
demonstrated the effects of the ratio of water solutions to the raw material and extraction temperature on the yield of WTPS. An increase in the yield of WTPS was observed when the ratio of water solutions to raw material and the extraction temperature were increased, and a highest value was obtained. Based on varying extraction temperatures and extraction time, the 3D response surface plots of the yield were developed and are shown in . An increase in the yield of WTPS was observed when the extraction time was kept at higher levels and then decreased with the increase of the extraction temperature. demonstrated the effects of extraction temperature and number of extractions on the yield of WTPS. An increase in the yield of WTPS was observed when the number of extractions and the extraction temperature were increased. However, with the further increasing of the extraction temperature, the yield of WTPS increased to a certain value and then decreased.
demonstrated the effects of the ratio of water solutions to raw material and extraction time on the yield of WTPS. The results showed that an increase in the yields of WTPS was observed when the extraction time and the ratio of water solutions to the raw material were increased. However, with the further increasing of the ratio of water solutions to raw material, the yield of WTPS started to decrease. Based on varying ratio of water solutions to raw material and number of extractions, the 3D response surface plots of the yield were developed and are shown in . The highest value of WTPS was obtained when the ratio of water solutions to raw material and number of extractions were fixed at their higher levels. Furthermore, the yield of WTPS decreased slightly with the further increase in the ratio of water solutions in the material. demonstrated the effects of extraction time and number of extractions on the yield of WTPS. The results showed that an increase in the yields of WTPS was observed when the extraction time and number of extractions were increased. Meanwhile, a maximum yield could be obtained when the two parameters were fixed at their higher levels.
Optimization and validation of the model
By employing the software Design-Expert, the optimum conditions predicted for the corresponding response variable of the extraction temperature, ratio of water solutions to raw material, extracting time and number of extractions were 54.1 °C, 12.48 mL/g, 97.8 min and 4 for the yield of WTPS. Under the optimum conditions, the maximum predicted yield of WTPS was 0.9846%.
As compared with previous methods, our method produced a much higher polysaccharides yield and consumed less time.[Citation1,Citation3,Citation15,Citation16] Verification experiments, carried out at the predicted conditions, showed reasonably close values to the predicted ones and further confirmed the adequacy of the predicted models. The verification experimental value of the yield of WTPS was 0.9815%. The results indicated that the model was satisfactory and could considerably enhance the yield of WTPS. To further increase the extraction yields of WTPS in this design, other variables, such as pH and the ratio of ethanol to ethyl acetate may be studied.
Conclusions
By using RSM, the optimum conditions for the extraction yields of WTPS were as follows: ratio of water solutions to raw material – 12.48 mL/g, extraction temperature – 54.1 °C, number of extractions – 4 and duration of extraction time – 97.8 min. Through the validation experiment, we ascertained that RSM was a useful and powerful tool in developing optimum extraction conditions. To further increase the extraction yields of WTPS in this design, other variables, such as pH and the ratio of ethanol to ethyl acetate may be studied. The relationship between the bioactivity and the conformation of WTPS needs further studying. Compared with other extraction methods, our method produced a much higher tea polysaccharides yield. This study could become the basis for later research, according to the optimum number of sequential steps, to enhance the efficacy of a large-scale extraction system in the food and pharmaceutical industries and could accelerate the utilization of WTPS.
Disclosure statement
No potential conflict of interest was reported by the authors.
References
- Yang L, Zhang LM. Chemical structural and chain conformational characterization of some bioactive polysaccharides isolated from natural sources. Carbohydr Polym. 2009;76:349–356.
- Anderson RA, Polansky MM. Tea enhances insulin activity. J Agric Food Chem. 2002;50:7182–7186.
- Chen HX, Zhang M, Xie BJ. Quantification of uronic acids in tea polysaccharide conjugates and its antioxidant properties. J Agric Food Chem. 2004;52:3333–3336.
- Jain AK, Shimoi K, Nakamura Y, et al. Crude tea extracts decrease the mutagenic activity of N-methyl-N-nitro-nitrosoguanidinine vitro and in intragastic tract of rats. Mutation Res. 1989;210:1–8.
- Kada T, Kaneko K, Matsuzaki S, et al. Detection and chemical identification of natural bio-antimutagens: a case of green tea factor. Mutation Res. 1985;150:127–132.
- Sharangi AB. Medicinal and therapeutic potentialities of tea (Camellia sinensis L.) – a review. Food Res Int. 2009;42:529–535.
- Unachukwu UJ, Ahmed S, Kavalier A, et al. White and green teas (Camellia sinensis var. sinensis): variation in phenolic, methylxanthine, and antioxidant profiles. J Food Sci. 2010;75(6):C541–C548.
- Almajano MP, Carbo R, Jimenez JAL, et al. Antioxidant and antimicrobial activities of tea infusions. Food Chem. 2008;108:55–63.
- Box GEP, Wilson KG. On the experimental attainment of optimum conditions. J R Stat Soc. 1951;13:1–45.
- Zou TB, Jia Q, Li HW, et al. Response surface methodology for ultrasound-assisted extraction of astaxanthin from haematococcus pluviali. Mar Drugs. 2013;11(5):1644–1655.
- Sevage MG. A new physical de-proteination method for representation of biologically effective substances – isolation of carbohydrates in chicken-protein and pneumococci. Biochem Z. 1934;273:419–429.
- Dubois M, Gilles KA, Hamilton JK, et al. Colorimetric method for determination of sugars and related substances. Anal Biochem. 1956;28:350–356.
- Fox DJ, Gray PP, Dunn NW, et al. An explanation of the discrepancy between the results of h.p.l.c. and DNS assays in the analysis of lignocellulosic hydrolysates. J Chem Tech Biotech. 1984;34:171–175.
- Gontard N, Guilbert S, Cuq JL. Edible wheat gluten films: Influence of the main process variables on film properties using response surface methodology. J Food Sci. 1992;57:190–196.
- Chen HX, Zhang M, Xie BJ. Components and antioxidant activity of polysaccharide conjugate from green tea. Food Chem. 2005;90:17–21.
- Wang DF, Wang CH, Li J, et al. Components and activity of polysaccharides from coarse tea. J Agric Food Chem. 2001;49:507–510.