
 ?Mathematical formulae have been encoded as MathML and are displayed in this HTML version using MathJax in order to improve their display. Uncheck the box to turn MathJax off. This feature requires Javascript. Click on a formula to zoom.
Abstract
The enhancement of hydrogen yield in microbial electrolysis cells (MECs) requires a robust process model that accurately relates the effect of anodic physicochemical input variables to the process output. Artificial neural networks (ANNs) have been used for the modelling of complex and non-linear processes. This paper reports the modelling of biohydrogen yield in MECs by using a committee of five ANNs. A topology of 6–(6, 8, 11, 12, 14)–1 was adopted, corresponding to the number of neurons of inputs, hidden (varied) and output layers. The ANN inputs were substrate type, substrate concentration, pH, temperature, applied voltage and reactor configuration. Model development was carried out with 50 data points from 15 published studies. The coefficients of determination (R2) between the experimental and predicted hydrogen yields for the five models were as follows: 0.90, 0.81, 0.85, 0.70 and 0.80. Model validation on new MEC processes showed a strong correlation between the observed and predicted hydrogen yields. Sensitivity analysis revealed that the performance of MEC was highly affected by variations in the substrate type, followed by applied voltage, substrate concentration, pH, MEC configuration and temperature in decreasing order. This study showed that the committee model accurately modelled the non-linear relationship between the considered physicochemical parameters of MEC and hydrogen yield, and thus could be used to navigate the optimization window in MEC scale-up processes.
Introduction
The reliance on conventional fossil fuels has resulted in the imminent energy catastrophe with the combined challenge of global warming and the depletion of these energy reserves.[Citation1] Research on renewable methods for producing energy has received utmost attention in the last few years.[Citation2] Hydrogen is a potential source of energy and thus has gained prominence over contending technologies like ethanol and alternative biofuels.[Citation2] Hydrogen has a high gravimetric energy density of 122 kJ/g, which is roughly 2.9 times greater than that of conventional fossil fuels, such as petroleum (44 kJ/g), gas (52 kJ/g), coal (40 kJ/g), methane (50.1kJ/g) and ethanol (26.5 kJ/g). In addition, water is the only by-product from its combustion.[Citation3]
Presently, biological production of hydrogen is carried out using photo-fermentation, dark fermentation and microbial electrolysis. Photo-fermentation employs both algae and photosynthetic bacteria for hydrogen production and light serves as the energy source. This process is limited by its dependence on light energy.[Citation4] Dark fermentation generates hydrogen via microbial breakdown of organic materials under anaerobic conditions in the absence of light, yielding only 2–3 mol H2/mol glucose against the expected theoretical yield of 12 mol H2/mol glucose. This low yield of H2 is referred to as the ‘fermentation barrier.’[Citation5] Microbial electrolysis cells (MECs) are devices, capable of generating hydrogen from waste biomass.[Citation6] MEC systems are associated with the well-known microbial fuel cells (MFC). While MFCs generate electricity from the microbial degradation of organic compounds, MECs, to a certain degree, reverse the process by using bacterial metabolism to generate hydrogen from organic material, by applying an electric voltage.[Citation7]
These systems operate by a process, referred to as electrohydrogenesis.[Citation8] The MEC reactor is primarily made of anode chamber, cathode chamber, membrane and direct current (DC) power supply. During microbial electrolysis, organic matter is employed as an electron donor and is consumed by the exoelectrogenic bacteria at the anodic compartment with simultaneous release of electrons and protons.[Citation9] The electrons pass through the circuit and coalesce with protons at the cathode resulting in the formation of hydrogen. Owing to the applied voltage in MEC systems, volatile fatty acids (VFAs) can be further broken down; thus the hydrogen yield is greatly improved.[Citation5]
Microbial metabolism in the anodic chamber is greatly influenced by process parameters, such as temperature, substrate type, concentration, pH and MEC configuration. These anodic input parameters have been investigated by several authors in various studies by using the One Variable At a Time (OVAT) approach, or statistical methods.[Citation10–15] These approaches, although widely used, have substantial challenges.[Citation16] For instance, OVAT approach suffers at least two major weaknesses: (Equation1(1)
(1) ) the interactive effect of parameters on the process are completely ignored; (Equation2
(2)
(2) ) it is impractical for the search of achieving a suitable optimum in a limited amount of experimentations [Citation17] and the factorial design of experiment (DOE) has shown to be time-consuming, resource demanding and laborious when the number of input factors is increased.
MECs, like most bioprocesses, are non-linear, complex and unsteady, so it is difficult to derive an accurate physical-based formula to represent its physical behaviour. Besides, the development of precise bioprocess models remains a crucial challenge for experts, owing to the non-linear nature of the biochemical network interactions.[Citation18] Artificial neural networks (ANNs) are a mathematical interpretation of the neurological functioning of the human brain. ANNs mimic the brain's learning procedure by arithmetically modelling the network structure of interconnected nerve cells.[Citation19] Gueguim Kana et al. [Citation16] indicated that ANNs are appropriate for the development of bioprocess models devoid of previous knowledge relating to the kinetics of metabolic instabilities within the cell and the cultural background. Furthermore, ANNs are completely data-based, without demanding a widespread systematic description of the occurrences that are overriding the process.[Citation20] A classic neural network consists of an input layer, one or more hidden layers and an output layer. Neurons of the hidden layer facilitate the network in determining the intricate relations that exist among the input and output parameters.[Citation19] The efficiency of ANN in bioprocess modelling has been reported in various studies. Nasr et al. [Citation21] developed an ANN model of dark fermentation on inputs of pH, initial substrate and biomass concentrations, temperature and time with a coefficient of determination of 0.98. Wang and Wan [Citation22] studied the effect of temperature, initial pH and substrate concentration on hydrogen yield and substrate degradation efficiency by using an ANN model. Likewise, Mu and Yu [Citation23] generated an ANN model on the continuous flow system functioning and indicated that the model successfully gave an account of the daily disparities of the reactor operation.
Reports of the use of a Committee of ANNs in bioprocess modelling are scanty. To the best of our knowledge, the application of a committee of ANNs in the modelling of biohydrogen yield by using MECs on input parameters of substrate type, substrate concentration, pH, temperature (°C), applied voltage and reactor configuration, has not yet been reported.
In this study, no novel investigation of individual input parameters on the performance of MECs was carried out, but a committee of five ANNs was structured on multilayer perceptron topology and trained on 41 data points from 15 published papers, in order to abstract the pattern relating the substrate type, substrate concentration, pH, temperature, applied voltage and reactor configuration to hydrogen yield in MEC systems. Additionally, the relative importance of these inputs on MEC performance was assessed using the ANN committee.
Materials and methods
Experimental data and model development
After an extensive survey of literature on the performance of MECs under different input parameter types and control set points, 50 data points (41 data points for training and 9 for validation) were selected from 15 published works with varied input conditions. The selected input variables consisted of substrate type, substrate concentration, pH, temperature, applied voltage and reactor configuration.
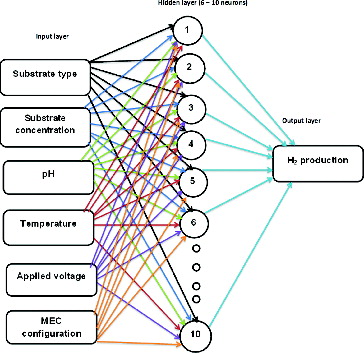
A committee made up of five ANNs, as depicted in , was implemented using Hypertext Preprocessor (PHP) programming environment. The idea of using a committee machine was that the strategy could lead to a significant improvement of the network prediction performance of new MEC process conditions with little computational efforts. This could be achieved by using ensemble averaging (EA), where the MEC hydrogen outputs are linearly combined, or by using a mixture of experts (ME), where the MEC hydrogen outputs are non-linearly combined. A topology of 6–(6, 8, 11, 12, 14)–1 was adopted, corresponding to the number of neurons of inputs, hidden (varied) and output layers (). This architecture had a feed forward nature, whereby the input layer neurons transmit signals to the hidden layer neurons.[Citation24]
Figure 1. Topology of neural network committee with one input layer (six neurons), one hidden layer (six to ten neurons) and one output layer (one neuron).
For the hidden layer, a sigmoid transfer function was implemented. This hidden layer had two main purposes: (Equation1(1)
(1) ) the addition of the weighted inputs together with the linked bias; (Equation2
(2)
(2) ) subsequently, to shift the input data to a non-linear form, as shown in the following equations [Citation24]:
(1)
(1) where wi (i = 1, n) are the connection weights, θ is the bias and xi is the input variable,[Citation24]
(2)
(2)
ANN training and validation
Prior to training the network, the data on substrate type input were transformed to numerical values. This was done based on the molecular weights for each substrate. Thus, acetate (59.04 g/mol), propionic acid (74.08 g/mol), butyric acid (88.11 g/mol), lactic acid (90.08 g/mol), glycerol (92.09 g/mol), valeric acid (102.13 g/mol), cellulose (176.15 g/mol) and glucose (180.16 g/mol) were ranked with the numerical values 1, 2, 3, 4, 5, 6, 7 and 8, respectively. In addition, the training data set (41 data points) was normalized within the range of −0.9 to 0.9 by using Equationthe(3)
(3) following equation:
(3)
(3) where ei is the normalized data and Emin and Emax are denoting the minimum and maximum values set at −0.9 and 0.9, respectively.
The back propagation (BP) algorithm [Citation25] was used for training. and show the database and model input ranges, respectively. During this process, the error between the experimental (observed) and predicted data was calculated and propagated backward through the network. Consequently, the algorithm adjusted the weights in each consecutive layer to decrease the error. This process was repeated until the error between the experimental and predicted data was reduced below an acceptable threshold ().[Citation16,Citation19,Citation25] With this algorithm, individual members of the committee machine learnt the non-linear relationship between considered MEC input parameters and hydrogen yield (mol H2/mol substrate) by adjusting their synaptic weights in order to reduce the error difference (root-mean-square error (RMSE)) between the predicted output and actual experimental output values (EquationEquation (4)(4)
(4) ). The committee was trained for 700 epochs to lower the RMSE to an acceptable threshold. The epoch referred to the number of times that all of the training vectors were used once to update the weights:
(4)
(4) where N refers to the number of patterns used in the training, M denotes the number of output nodes, i denotes the index of the input pattern (vector) and yin and ŷin are the actual and predicted output values, respectively.
Table 1. Database used for the development of ANN committee model.
Table 2. Ranges for input and output parameters used in the committee model development.
Figure 2. The back propagation training flowchart for artificial neural network. Note: Mean square error (MSE).
The coefficient of determination (R2) was calculated as the quotient of the variances of the model predicted values and observed values of the dependent variable. To identify the critical parameters and their degree of importance on the model output, a sensitivity analysis was carried out. This was achieved by calculating the output percent difference when each input parameter varied from its minimum value to its maximum value. This provided information about the more sensitive parameters.
Results and discussion
Effect of anodic process inputs on MEC output
An overview of the database, developed for this study, indicated that acetate, which is an intermediate metabolic product, has been used as a substrate for most of the reported MEC investigations.[Citation5,Citation10–14,Citation26–34] Glucose, glycerol and other organic acids have been used to a lesser extent.[Citation11,Citation5] The maximum H2 yield obtained by using acetate was 3.8 mol H2/mol acetate, reported by Tartakovsky et al.[Citation13] Furthermore, it was observed that the substrate concentration in various MEC studies has been relatively maintained in the range of 0.5 and 5 g/L of substrate. Most reports showed that the pH within the anodic chamber was not controlled [Citation9] and the initial reported values were within the range of 6.5–7.0.[Citation35] With regard to the used reactor configuration, the single and double chamber are regularly adopted [Citation5] and the voltage values most commonly applied were within the range of 0.5 V–0.8 V.[Citation10,Citation13,Citation14] Additionally, these processes have been frequently operated with controlled temperature in the range of 30 to 40 °C.[Citation10]
Assessment of the developed ANN committee model
For the initial assessment, the developed ANN committee was used to predict the hydrogen yield on nine data points from the published works of Cheng and Logan,[Citation5] Tartakovsky et al.,[Citation13] Guo et al.,[Citation14] Jia et al. [Citation33] and Lee and Rittmann.[Citation34] These data were not previously used in the development of the committee model.
The second assessment was carried out on 41 data points and the predicted and observed hydrogen yields were compared. The obtained coefficients of determination (R2) values were 0.90, 0.81, 0.85, 0.70, 0.80 and 0.85 for committee member 1, 2, 3, 4, 5 and the mean/average of the five committee members, respectively. An R2 > 0.70 is generally regarded as an indication of a good model.[Citation24] The plots of predicted versus observed hydrogen yield values are depicted in a), 3(b), 3(c), 3(d), 3(e) and 3(f), showing most data points aligned near the diagonal, thus illustrating the closeness between the predicted and observed yields.
Figure 3. Committee member model 1–5 (a–e) and the average (f) predicted versus observed biohydrogen yields (mol H2/mol substrate) values for 41 experimental data sets. Note: The diagonal line illustrates expectations under a one-to-one relationship between predicted and observed values. R2 = 0.90 (a); R2 = 0.81 (b); R2 = 0.85 (c); R2 = 0.70 (d); R2 = 0.80 (e); R2 = 0.85 (f).
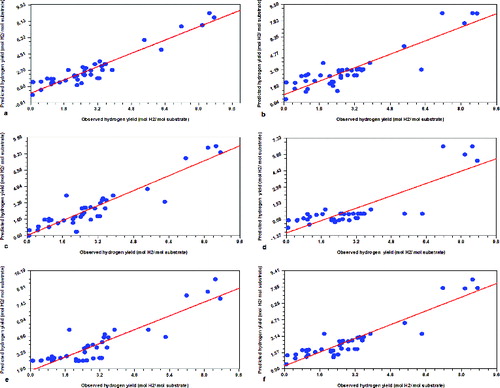
The relative difference in the obtained coefficients of determination among the various committee members can be accounted for by the difference in the number of neurons in the hidden layer of each committee member. The R2 values ranged from 0.70 to 0.90, illustrating the susceptibility of the learning efficiency of ANN models of complex non-linear microbial processes on the number of hidden neurons. However, it has not been clearly established whether a higher number of neurons on the hidden layer of the network will enhance or impede its predictive ability on novel bioprocesses. Very often a single neural network member with a fixed number of hidden neurons is structured, trained, validated and used as a model for novel bioprocesses.[Citation16,Citation20–23,Citation36–38]
This approach negates the contribution of poor members and gives greater generalization to the whole model in the prediction of hydrogen yield as a function of substrate type and concentration, pH, temperature, applied voltage and reactor configuration on new MECs.
These findings elucidate that the ANN committee, with several sigmoid transfer functions, is efficiently able to simulate the highly non-linear relationship between the input parameters and biohydrogen yield pattern within the design window. The relative predictive superiority of ANN over alternative bioprocess modelling technique tools has been described by Gueguim Kana et al.,[Citation16] Desai et al.,[Citation24] Rosales-Colunga et al.,[Citation36] Nikhil et al. [Citation37] and Whiteman and Gueguim Kana.[Citation25]
Guo et al. [Citation14] investigated the effect of varying applied voltage on biohydrogen yield by using MECs and achieved a maximum H2 yield of 3.52 mol H2/mol acetate. The average value, predicted by the developed committee model for the same experimental conditions, was 4.48 mol H2/mol substrate. Jia et al. [Citation33] studied the effect of varying applied voltage on biohydrogen yield by using MECs and reported a maximum H2 yield of 1.64 mol H2/mol acetate at an applied voltage of 1.2 V, whilst at 1.0 V and 1.15 V the H2 yield was 1.4 mol H2 /mol acetate and 1.3 mol H2 /mol acetate, respectively. The present model under similar conditions gave H2 yields of 4.04 mol H2/mol acetate, 3.71 mol H2/mol acetate and 3.97 mol H2/mol acetate for applied voltage values of 1.2 V, 1.0 V and 1.15 V, respectively. The discrepancy between the predicted model and experimental hydrogen yields obtained by Jia et al. [Citation33] could be accounted for by the inoculum type (synthetic wastewater) and the anodic electrode material type of graphite granules used in the experiment, which were not considered in the committed model input space.
A similar study was carried out by Tartakovsky et al. [Citation13] to investigate the effect of applied voltage of 1 V and 1.5 V on MEC hydrogen yield. The present committee model predicted 3.36 mol H2/mol acetate and 3.20 mol H2/mol acetate, respectively, against the values of 3.7 mol H2/mol acetate and 3.8 mol H2/mol acetate, respectively, obtained by Tartakovsky et al.[Citation13] The difference between the model predicted and experimental hydrogen yields in the study by Tartakovsky et al. [Citation13] could be accounted for by the inoculum type (anaerobic sludge) and the anodic electrode material type of carbon felt used in the experiment, which were not considered in the committee model input space. The apparent discrepancy between the observed hydrogen yield and the predicted values by the committee model in the work of Cheng and Logan [Citation5] (8.01 mol H2/mol acetate against 5.20 mol H2/mol acetate) and the study of Lee and Rittmann [Citation34] (4 mol H2/mol acetate against 4.44 mol H2/mol acetate) suggest that, in addition to the considered input space, other variables, such as the type of electrodes, inoculum source, among others, impact the overall hydrogen yield in MEC processes.
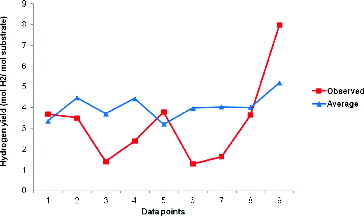
Nevertheless, a common pattern emerged in the hydrogen yield trend between the predicted and observed data point, as illustrated in , but with the average predicted data consistently above the observed values. These observations illustrated the efficiency of the developed committee model to capture the pattern of hydrogen yield in MEC within the input space of substrate type, substrate concentration, pH, temperature, applied voltage and reactor configuration.
Figure 4. Observed H2 yield (mol H2/mol substrate) compared to the average predicted (of the five models) H2 yield (mol H2/mol substrate) on the nine data points used for testing of the model.
Sensitivity analysis
Sensitivity analysis is used to determine how ‘sensitive’ a model is to the changes in the value of the input parameters or to the changes in the structure of the model. The sensitivity indicators describe the change in the systems' outputs due to variations in the process input parameters. A large sensitivity to a parameter suggests that the process performance can drastically change with little variation in the parameter.[Citation39,Citation40] Vice versa, a small sensitivity suggests little change in the performance of the system even if a large variation occurs in the input parameter.
This analysis was carried out on the developed committee network to determine the relative sensitivity of the hydrogen yield of MEC on the input parameters of substrate type, substrate concentration, pH, temperature, applied voltage and reactor configuration on hydrogen yield in MECs. The data revealed that the hydrogen yield was highly affected by substrate type, followed by applied voltage, substrate concentration, pH, reactor configuration and temperature with a sensitivity of 0.68, 0.37, 0.30, 0.17, 0.15 and 0.032 in decreasing order, respectively. This implied that slight changes in the organic load of the feed stream with regard to its concentration or type, will have a high impact on the hydrogen yield in MEC processes. These findings are in line with the study undertaken by Selembo et al.,[Citation11] who reported a significant difference in MEC yield by using glucose, pure glycerol and glycerol by-products and achieving yields of 7.2 mol H2/mol glucose, 3.9 mol H2/mol glycerol and 1.8 mol H2/mol glycerol, respectively. Similar observations on substrate type and concentration have been reported by Cheng and Logan,[Citation5] Liu et al.,[Citation32] Jia et al. [Citation41] and Tartakovsky et al.[Citation42]
In the same vein, slight changes in the applied voltage have shown to considerably effect the H2 yield.[Citation31] Hu et al. [Citation31] demonstrated that when maintaining the other parameters at constant set points and varying the applied voltage values between 0.4 V and 0.6 V, the corresponding H2 yield was 1.0 mol H2/mol acetate and 2.5 mol H2/mol acetate, respectively. Similar trends have been reported by Tartakovsky et al.,[Citation13] Guo et al.,[Citation14] Jia et al.,[Citation33] Call and Logan [Citation43] and Escapa et al.[Citation44]
Conclusions
The development of a reliable bioprocess model, capable of accurately navigating the optimization search space, is highly challenging owing to the non-linearities, associated with these processes. In this work, a committee of ANN was developed by using 15 reported investigations on MEC processes. An average coefficient of determination of 0.85 was achieved on novel MEC processes, not used in model training. Furthermore, the ANN committee revealed that H2 yield performance of MEC was greatly influenced by variations in substrate type, followed by applied voltage, substrate concentration, pH, MEC configuration and temperature in decreasing order 0.68, 0.37, 0.30, 0.17, 0.15 and 0.032, respectively. This study demonstrated that the ANN committee model efficiently encapsulated the non-linear relationship between the input parameters and the hydrogen yield and thus may serve as a useful device to navigate the optimization search space in MEC scale-up and industrial development in addition to other bioprocesses. As the pressure to transit from fossil fuel sources to renewable ones steadily builds up and various research groups are streaming high value data on novel renewable fuel processes, it is highly likely that bioprocess models, capable of synergistically integrating these data streams, would shorten the energy transition curve.
Disclosure statement
No potential conflict of interest was reported by the authors.
Additional information
Funding
References
- Levin DB, Pitt L, Love M. Biohydrogen production: prospects and limitations to practical application. Int J Hydrogen Energy. 2004;29:173–185.
- Nath K, Das D. Modeling and optimization of fermentative hydrogen production. Bioresour Technol. 2011;102:8569–8581.
- Belafi-Bakó K, Bakonyi P, Nemesto´thy N, et al. Biohydrogen production in integrated system. Desalin Water Treat. 2010;14:116–118.
- Das D, Veziroglu TN. Advances in biological hydrogen production processes. Int J Hydrogen Energy. 2008;33:6046–6057.
- Cheng SA, Logan BE. Sustainable and efficient biohydrogen production via electrohydrogenesis. Proc Natl Acad Sci USA. 2007;104(47):18871–18873.
- Ambler JR, Logan BE. Evaluation of stainless steel cathodes and a bicarbonate buffer for hydrogen production in microbial electrolysis cells using a new method for measuring gas production. Int J Hydrogen Energy. 2011;36:160–166.
- Logan BE, Regan JM. Electricity-producing bacterial communities in microbial fuel cells. Trends Microbiol. 2006;14:512–518.
- Logan BE, Call D, Cheng S, et al. Microbial electrolysis cells for high yield hydrogen gas production from organic matter. Environ Sci Technol. 2008;42(23):8630–8640.
- Zhu G, Wu T, Jha AK, et al. Review of biohydrogen production and new application in the pollution control via microbial electrolysis cell. Desalin Water Treat. 2014;52(28–30):5413–5421.
- Kyazze G, Popov A, Dinsdale R, et al. Influence of catholyte pH and temperature on hydrogen production from acetate using a two chamber concentric tubular microbial electrolysis cell. Int J Hydrogen Energy. 2010;35:7716–7722.
- Selembo PA, Perez JM, Lloyd WA, et al. High hydrogen production from glycerol or glucose by electrohydrogenesis using microbial electrolysis cells. Int J Hydrogen Energy. 2009;34:5373–5381.
- Lu L, Ren N, Zhao X, et al. Hydrogen production, methanogen inhibition and microbial community structures in psychrophilic single chamber microbial electrolysis cells. Energy Environ Sci. 2011;4:1329–1336.
- Tartakovsky B, Manuel MF, Wang H, Guiot SR. High rate membrane-less microbial electrolysis cell for continuous hydrogen production. Int J Hydrogen Energy. 2009;34:672–677.
- Guo K, Tang X, Du Z, et al. Hydrogen production from acetate in a cathode-on-top single-chamber microbial electrolysis cell with a mipor cathode. Biochem Eng J. 2010;51:48–52.
- Azwar Y, Abdul-Wahab AK, Mohamed Azlan Hussain MA. Optimal production of biohydrogen gas via microbial electrolysis cells (MEC) in a controlled batch reactor system. Chem Eng J. 2013;32:727–732.
- Gueguim Kana EB, Oloke JK, Lateef A, et al. Modelling and optimization of biogas production on saw dust and other co-substrates using artificial neural network and genetic algorithm. Renew Energy. 2012;46:276–281.
- LOTFY AL, Khaled M, Ehab R, et al. Citric acid production by a novel Aspergillus niger isolate: II. Optimization of process parameters through statistical experimental designs. Bioresour Technol. 2007;98:3470–3477.
- Franco-Lara E, Link H, Weuster-Botz D. Evaluation of artificial neural networks for modeling and optimization of medium composition with a genetic algorithm. Process Biochem. 2006;41:2200–2206.
- Nagata U, Chu KH. Optimization of a fermentation medium using neural networks and genetic algorithms. Biotechnol Lett. 2003;25:1837–1842.
- Shi Y, Gai G, Zhao X, et al. Back propagation neural network (BPNN) simulation model and influence of operational parameters on hydrogen bio-production through integrative biological reactor (IBR) treating wastewater. Paper presented at: Bioinformatics and Biomedical Engineering (iCBBE), 2010 4th International Conference. 2010 June 18–20; Chengdu (China).
- Nasr N, Hafez H, El Naggar MH, et al. Application of artificial neural networks for biohydrogen production. Int J Hydrogen Energy. 2013;38:3189–3195.
- Wang J, Wan W. Application of desirability function based on neural network for optimizing biohydrogen production process. Int J Hydrogen Energy. 2009;34:1253–1259.
- Mu Y, Yu HQ. Simulation of biological hydrogen production in a UASB reactor using neural network and genetic algorithm. Int J Hydrogen Energy. 2007;32:3308–3314.
- Desai KM, Survase SA, Saudagar PS, et al. Comparison of artificial neural network (ANN) and response surface methodology (RSM) in fermentation media optimization: case study of fermentative production of scleroglucan. J Biochem Eng. 2008;41:266–273.
- Whiteman JK, Gueguim Kana EB. Comparative assessment of the artificial neural network and response surface modeling efficiencies for biohydrogen production on sugar cane molasses. Bioenergy Res. 2014;7(1):295–305.
- Liu H, Grot S, Logan BE. Electrochemically assisted microbial production of hydrogen from acetate. Environ Sci Technol. 2005;39:4317–4320.
- Chae KJ, Choi MJ, Lee J, et al. Biohydrogen production via biocatalyzed electrolysis in acetate-fed bioelectrochemical cells and microbial community analysis. Int J Hydrogen Energy. 2008;33:5184–5192.
- Chae KJ, Choi MJ, Kim KY, et al. Selective inhibition of methanogens for the improvement of biohydrogen production in microbial electrolysis cells. Int J Hydrogen Energy. 2010;35:13379–13386.
- Nam JY, Logan BE. Enhanced hydrogen generation using a saline catholyte in a two chamber microbial electrolysis cell. Int J Hydrogen Energy. 2011;36:15105–15110.
- Nam JY, Logan BE. Optimization of catholyte concentration and anolyte pHs in two chamber microbial electrolysis cells. Int J Hydrogen Energy. 2012;37:18622–18628.
- Hu H, Fan F, Liu H. Hydrogen production using single-chamber membrane-free microbial electrolysis cells. Water Res. 2008;42:4172–4178.
- Liu W, Huang S, Zhou A, et al. Hydrogen generation in microbial electrolysis cell feeding with fermentation liquid of waste activated sludge. Int J Hydrogen Energy. 2012;37:13859–13864.
- Jia YH, Ryu JH, Kim CH, et al. Enhancing hydrogen production efficiency in microbial electrolysis cell with membrane electrode assembly cathode. J Ind Eng Chem. 2012;18:715–719.
- Lee HS, Rittmann BE. Characterization of energy losses in an upflow single-chamber microbial electrolysis cell. Int J Hydrogen Energy. 2010;35:920–927.
- Wang AJ, Liu WZ, Ren NQ, Zhou JZ, Cheng SA. Key factors affecting microbial anode potential in a microbial electrolysis cell for H2 production. Int J Hydrogen Energy. 2010;35:13481–13487.
- Rosales-Colunga LM, Garcia RG, Rodriguez AD. Estimation of hydrogen production in genetically modified Escherichia coli fermentations using an artificial neural network. Int J Hydrogen Energy. 2010;35:13186–13192.
- Nikhil BO, Visa A, Lin CY, et al. An artificial neural network based model for predicting H2 production rates in a sucrose-based bioreactor system. W.A.S.E.T. 2008;37:20–25.
- Prakasham RS, Sathish T, Brahmaiah P. Imperative role of neural networks coupled genetic algorithm on optimization of biohydrogen yield. Int J Hydrogen energy. 2011;36:4332–4339.
- Gunawan R, Cao Y, Petzold L, et al. Sensitivity analysis of discrete stochastic systems. Biophys J. 2005;88(4):2530–2540.
- Shojaeefard MH, Akbari M, Tahani M, et al. Sensitivity analysis of the artificial neural network outputs in friction stir lap joining of aluminum to brass. Adv Mater Sci Eng. 2013;2013:1–7.
- Jia YH, Choi JY, Ryu JH, et al. Hydrogen production from wastewater using a microbial electrolysis cell. Korean J Chem Eng. 2010;27(6):1854–1859.
- Tartakovsky B, Mehta P, Santoyo G, et al. Maximizing hydrogen production in a microbial electrolysis cell by real time optimization of applied voltage. Int J Hydrogen Energy. 2011;36:10557–10564.
- Call D, Logan BE. Hydrogen production in a single chamber microbial electrolysis cell lacking a membrane. Environ Sci Technol. 2008;42:3401–3406.
- Escapa A, Manuel MF, Moran A, et al. Hydrogen production from glycerol in a membraneless microbial electrolysis cell. Energy Fuels. 2009;23:4612–4618.