
Abstract
Peach (Prunus mira L.; 2n = 16), which originated in China, is a fruit tree widely cultivated all over the world with high economic value. Prunus mira Koehne is a wild species distributed in Tibet with special medicinal and ecological values. To conserve its breeding and germ plasm resources, two DNA-based molecular markers, inter-simple sequence repeat (ISSR) and random amplified polymorphic DNA (RAPD), were used for genetic diversity evaluations of 48 samples from three regions, including Tibet (XZ), Henan Province (HN) and Heilongjiang Province (HLJ), in this study. High levels of polymorphism were observed: 77.80% (ISSR) and 72.73% (RAPD), which indicated that ISSR and RAPD were efficient methods to detect the genetic diversity of P. mira Koehne. The samples from Tibet preserved higher genetic diversity and most genetic variations occurred among populations. There was no significant relationship observed between the genetic distance of populations and their geographic distribution. For conservation of P. mira Koehne, ex situ conservation is a suitable strategy that needs to be established in the future.
Abbreviations
| AFLP: | = | amplified fragment length polymorphism |
| CTAB: | = | hexadecyltrimethylammonium bromide (cetyltrimethylammonium bromide) |
| dNTPs: | = | deoxyribonucleoside triphosphates |
| EDTA: | = | ethylenediaminetetraacetic acid |
| ISSR: | = | inter simple sequence repeat |
| PCoA: | = | principal coordinates analysis |
| PCR: | = | polymerase chain reaction |
| PVP: | = | polyvinylpyrrolidone |
| RAPD: | = | random amplified polymorphic DNA |
| SDS: | = | sodium dodecyl sulphate |
| TE: | = | Tris-EDTA buffer |
Introduction
Peach (Prunus mira L.; 2n = 16), which originated in China,[Citation1] is a fruit tree belonging to Rosaceae widely cultivated in the world. Due to its high medicinal and economical values, China performs extensive cultivation and selection of wild peach species.[Citation2] To conserve peach landraces and cultivars, several peach germ plasm repositories have been established in China.
Owing to the high nutritional value of peach fruits, preserved fruit and fruit juice can be processed, which brings huge economic benefits.[Citation1] Peach is also identified as an ornamental plant for its beautiful flowers blossoming in spring.[Citation3] Prunus mira Koehne (P. mira Koehne Kov et Kpst) is a wild peach species distributed in Tibet. Due to its long evolutionary history and unique natural growing environment, besides edibleness and ornamental value, P. mira Koehne has special medicinal and ecological values. Its fruits have been applied to treat irregular menstruation and fractures because of their potential to remove blood stasis and enhance blood circulation.[Citation4] In addition, P. mira Koehne has strong tolerance to environmental stresses, thus it can be utilized for soil erosion control and vegetation restoration.[Citation5,Citation6] However, P. mira Koehne has become an endangered plant as a result of the impact of climate changes, pollution and deforestation in recent years. Therefore, there is a pressing need to conserve P. mira Koehne germ plasm at present.
Similar to most old domesticated fruit trees with poorly documented selection and breeding history and missing records, cultivar identification of Chinese peach based on morphological differences alone has proven to be difficult.[Citation2] Molecular fingerprinting can provide accurate genetic information for future breeding and collection efforts.[Citation7–9]
DNA-based molecular markers of random amplified polymorphic DNA (RAPD), amplified fragment length polymorphism (AFLP) and inter-simple sequence repeats (ISSR) are widely used for peach germ plasm identification and the assessment of genetic diversity.[Citation10,Citation11] RAPD and ISSR have been generally used in the last two decades [Citation12] in cultivar identification programmes among different taxa at the DNA level because of their cost-effectiveness and simple operation without requiring prior knowledge of species DNA sequences.[Citation13] For the high polymorphism and reproducibility, these approaches have been applied to identify cultivars in numerous plant species such as turmeric, apple and strawberry.[Citation14–16]
The aim of this study was to perform a genetic variability analysis on Chinese peach, including wild species – P. mira Koehne from Tibet, and cultivated and wild peach species from Henan Province and cultivated species from Heilongjiang Province. As part of a long-term commitment to conserve the genetic resources of this valuable fruit tree, we hereby continue our previous research [Citation17], which was focused on the genetic diversity of wild peach species. The present study includes a wider range of accessions to make a comparative analysis of the genetic relationship between wild and cultivated peach species. In order to propose conservation measures for P. mira Koehne, the level of genetic diversity in three populations of peach was analysed as well as the genetic diversity distributed within and among populations. We also discussed the use of RAPD and ISSR markers in conservation genetics of this plant.
Materials and methods
Plant material
In this investigation, a total of 48 samples were collected from three different regions in China, including Tibet (XZ), Henan Province (HN) and Heilongjiang Province (HLJ). From each population, 7–30 individual samples were studied (). Fresh and young leaves were collected and kept at −80 °C for DNA isolation.
Table 1. Locations and sample size of three populations used in this study.
DNA isolation
Total genomic DNA was isolated using the CTAB (cetyltrimethylammonium bromide) method with minor modification.[Citation18] Leaves (200 mg) were adequately ground in liquid nitrogen, then 800 μL CTAB extraction buffer was added (2% CTAB (w/v), 1.4 mol/L NaCl, 100 mmol/L Tris-HCl, pH 8.5, 0.5% sodium dodecyl sulphate (SDS), 20 mmol/L ethylenediaminetetraacetic acid (EDTA), 2% β-mercaptoethanol (v/v) and 1% PVP (polyvinylpyrrolidone, w/v)). The mixture was incubated at 65 °C for 30 min followed by extraction with chloroform: isoamyl alcohol (24:1) twice. The remaining pellets were washed twice with 70% ethanol. After drying at room temperature, pellets were dissolved in TE (Tris-EDTA) buffer (10 mmol/L Tris-HCl, pH 8.0, 1 mmol/L EDTA, pH 8.0). The concentration of total genomic DNA was detected by spectrophotometer (SHIMADZU UV-1800) and DNA with high purity was quantified by 0.8% agarose gel electrophoresis.
ISSR amplification
Nine primers (I-69 to I-81) screened for ISSR analysis represented good repeatability and polymorphism, and were synthesized in Shanghai Sangon Biological Engineering Technology and Service Co. Ltd., Shanghai, China. ISSR amplifications were performed in a volume of 25 µL including 2 µL of template DNA (40 ng/µL), 1 µL primer (0.4 µmol/µL), 5.0 µL deoxyribonucleoside triphosphates (dNTPs; 0.5 mmol/L), 2.5 µL 10 × assay buffer (Takara Biotechnology, Dalian, Co., LTD), 2.5 µL MgCl2 (2.5 mmol/L), 0.1 µL of Taq DNA polymerase (5 U/µL) (Takara Biotechnology Co. Ltd., Dalian, China) and 11.9 µL ddH2O. Amplification was performed by the following procedure in an Eppendorf PCR aAmplifier (GeneAmp PCR System 9700): the first cycle included initial denaturation of the template DNA at 94 °C for 4 min; the next 40 cycles consisted of denaturation of the template DNA at 94 °C for 1 min, primer annealing at 48 °C for 1 min and primer extension at 72 °C for 2 min; and then 10 min final extension at 72 °C.[Citation19] PCR products were electrophoresed in 1.6% agarose gels stained with ethidium bromide (0.5 μg/mL). After electrophoresis, gels were observed under ultraviolet-illuminator and photographed. Only reproducible and distinct bands were selected for furthering analysis.
RAPD amplification
Ten primers providing reproducible and distinct bands were screened for the RAPD amplification. RAPD amplifications were performed in a volume of 25 µL, including 1 µL template DNA (40 ng/µL), 2 µL primer (0.4 µmol/µL), 0.75 µL dNTPs (0.5 mmol/L), 2.5 µL 10 × buffer, 1.5 µL MgCl2 (2.5 mmol/L), 0.3 µL Taq DNA polymerase (5 U/µL) and 16.95 µL dd H2O. The RAPD amplification was performed by the following procedure in an Eppendorf PCR amplifier: the first cycle included initial denaturation of the template DNA at 94 ºC for 4 min; the next 44 cycles consisted of denaturation of the template DNA at 94 ºC for 1 min, primer annealing at 37 °C for 1 min and primer extension at 72 ºC for 2 min; and then primer extension was performed again at 72 ºC for 10 min.[Citation13] PCR products were electrophoresed in 1.6% agarose gels stained with ethidium bromide (0.5 μg/mL). After electrophoresis, gels were observed under ultraviolet-illuminator and photographed. Only reproducible and distinct bands were selected for subsequent analysis.
Data analysis
In this study, only reproducible, distinct bands with high resolution were scored as present (1) or absent (0). Then, a binary data matrix was established. The unweighted pair group method with arithmetic average (UPGMA) of NTSYS-pc Version 2.10e was used for constructing a dendrogram which can reveal the genetic relationship among all the individuals according to the similarity coefficient [Citation20] in this experiment. The PIC (polymorphic index) was calculated by the formula PIC = 1 − ΣPi2, where Pi is the frequency of the ith band, with the software POWERMARKER Version 3.25. The resolving power (Rp) of the two molecular markers was calculated as Rp = ΣIB (IB = 1 − [2'(0.5 − P)]), where P is the rate of the species containing the band.[Citation21] Some basic parameters for genetic diversity such as the total number of bands (TNB), the number of polymorphic bands (NPB), the percentage of polymorphic bands (PPB), mean Nei's gene diversity index (H), Shannon index (I), the observed number of alleles per locus (Na), the effective number of alleles per locus (Ne), the level of gene flow (Nm), population diversity (Hs), the total gene diversity (Ht) and inter-population differentiation (Gst) were calculated using the POPGENE Version 1.32 software.[Citation22]
In order to evaluate the population genetic structure and group the individuals based on ISSR and RAPD markers, structure analysis was carried out with the software STRUCTURE Version 2.2 [Citation23] from the VBA application, with 10 runs for each group number k.
The distribution of genetic diversity within and among populations in different regions was estimated by the method of analysis of molecular variance (AMOVA) Version 1.55.[Citation24]
Results and discussion
ISSR analysis
Nine ISSR primers were screened to investigate the genetic diversity and population structure between and within three peach populations in China. A total of 66 bands were produced, of which all were polymorphic bands. The number of bands ranged from 5 (I-69 and I-80) to 9 (I-73 and I-76) with a mean of 7.22, which was almost the same as the average number of polymorphic bands. The percentage of polymorphic bands was 100%. The Rp value of the nine primers varied from 2.65 (I-73) to 4.06 (I-71) distinguishing the three populations. The PIC values ranged from 0.71 (I-72) to 0.88 (I-81) with a mean of 0.80 (). Gst determined on the basis of the ISSR markers was 0.19, demonstrating that 19% of the total genetic variability was among populations and 81% of the total genetic variability was within populations. The Nm value among populations was 2.13 ().
Table 2. Amplification of ISSR and RAPD markers in 48 samples.
Table 3. Estimates of the genetic variability among three populations determined on the basis of ISSR and RAPD analysis.
In addition, the average Na value was 1.83 ± 0.45; the maximum (1.921 ± 0.39) and minimum (1.683 ± 0.36) ones being for XZ and HLJ, respectively. The Ne value was invariably less than the Na value for each population, presenting a distinction in the range of 1.52 ± 0.26 (HLJ) to 1.91 ± 0.43 (XZ), with a mean of 1.72 ± 0.57. The mean Nei's gene diversity (H) value was 0.23 ± 0.10. Similarly, the mean Shannon's information index (I) was 0.38 ± 0.13. The PPB ranged from 72.13% in HLJ to 82.23% in XZ at the level of population, with a mean of 77.80% (). Based on the ISSR analysis, the variance among populations accounted for 73.66% of the total variance, while that within populations accounted for 26.34% ().
Table 4. Summary of genetic variations among three populations as revealed through ISSR and RAPD analysis.
Table 5. Analysis of molecular variance (AMOVA) based on ISSR and RAPD for 48 samples.
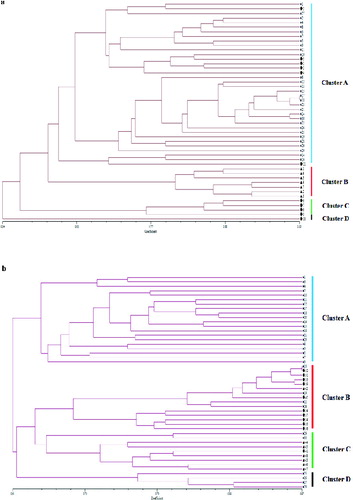
When a dendrogram was constructed by the UPGMA method, all the individuals were separated into two major clusters at the coefficient of 0.54, of which one contained 47 samples and there was only one in the second cluster ((a)). The larger cluster was further separated into two clusters: one containing 43 samples and the other containing 4 samples at the coefficient level of 0.56. The first subcluster was further divided into two clusters sharing a common coefficient at 0.60 of which one contains 36 samples and the other contains 7 samples.
Figure 1. Dendrogram of 48 samples resulting from the UPGMA cluster analysis based on Jaccard's similarity coefficients obtained from ISSR (a) and RAPD (b).
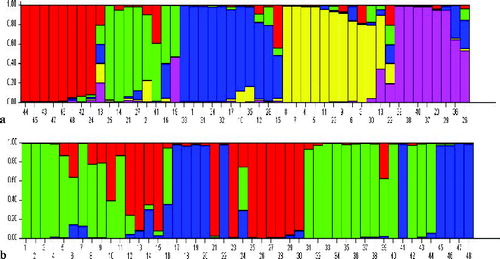
In the analysis of genetic structure, the K value was set from 2 to 10 with 10 cycles. ln Pr (X/K) showed a clear maximum for K = 5. Thus, individuals were separated into five population groups in theory which were partitioned into different coloured segments. Each individual is represented by a single vertical bar. The greater the proportion of the colour, the greater the possibility of the represented population to be distributed into the corresponding group ((a)).
Figure 2. Inferred genetic structure of 48 samples from different geographic groups based on ISSR (a) and RAPD (b).
The relationship of all the individuals from the three populations based on the ISSR markers was also presented in principal coordinates analysis (PCoA) ((a)) which was consistent with the dendrogram analysis.
Figure 3. Principle coordinates analysis of 48 samples based on ISSR (a) and RAPD (b).
RAPD analysis
The 10 primers screened for the final study had given reproducible and distinct bands in preliminary experiments. A total of 105 bands ranging from 100 to 2000 bp were produced, with all of the products being polymorphic. The number of bands ranged from 6 (S32) to 13 (S30), with a mean of 10.56, which was the same as the average number of polymorphic bands (). The percentage of polymorphic bands was 100%. PIC values ranged from 0.76 (S32) to 0.90 (S34) with a mean of 0.86. The Rp value of the 10 primers varied from 2.05 (S25) to 3.98 (S30). The Gst determined on the basis of the RAPD markers was 0.28, indicating that 28% of the total genetic variability was among populations and 72% was within populations. The Nm value among populations was 1.29 ().
The mean Na value was 1.72 ± 0.67; the maximum (1.93 ± 0.24) and minimum (1.37 ± 0.49) being for XZ and HLJ. The Ne value showed a distinction in the range of 1.27 ± 0.40 (HLJ) to 1.43 ± 0.33 (HN), with a mean of 1.33 ± 0.35. The mean Nei's gene diversity (H) value was 0.21 ± 0.19 and Shannon's information index (I) was 0.31 ± 0.25. The PPB ranged from 37.88% in HLJ to 93.94% in XZ at the level of population, with a mean of 72.73% (). The results from the RAPD analysis indicated that variance among populations accounted for 82.31% of the total variance, whereas that within populations accounted for 17.69% ().
All the individuals were separated into two clusters at the coefficient level of 0.61 ((b)). One contained 20 samples and the other one contained 28 samples. The larger cluster was further divided into two clusters. The larger subcluster consisted of 24 samples and the other one, of 4 samples. Similarly, the larger subcluster was still further divided into two clusters of 14 samples and 10 samples each, at the coefficient level of 0.63.
In genetic structure analysis, ln Pr (X/K) showed a clear maximum for K = 3. This indicated that the studied individuals could theoretically be separated into three population groups ((b)).
The relationship of individuals from the three populations based on the RAPD markers was also presented by PCoA ((b)). These results were in agreement with the dendrogram analysis.
Polymorphism analysis
In the analysis based on the RAPD markers used in this study, there were high levels of polymorphism (72.73% polymorphism) observed among populations. In comparison, the levels of polymorphism were higher (77.80% polymorphism) based on ISSR analysis, confirming its better discrimination ability. Our results showed similar findings with an earlier research on genetic diversity in other peach species by using RAPD [Citation25,Citation26] and AFLP markers [Citation27]. The cause for the high level of polymorphism could be sought in the wide range of ecological conditions in different areas of China [Citation19] and the fact that P. mira Koehne is a wild plant. Our results indicated that ISSR and RAPD markers were efficient methods to estimate the genetic diversity of Chinese peach populations.
Genetic diversity of Chinese peach
The correlation between geographical distance and genetic similarity has been assessed by molecular markers.[Citation28] Our previous result indicated that there was no significant relationship between the geographic distribution of populations and the genetic distance using the AFLP method [Citation29] and SSR method, which is similar to our result based on ISSR and RAPD here. Taken together, our results from this study and those from our previous one on P. mira Koehne [Citation17] demonstrate that there is genetic relationship not only in wild peach species, but also between wild and cultivated peach species. This could provide useful information for protecting the germ plasm resources of P. mira Koehne.
Based on the results from the ISSR analysis, high level of genetic diversity of population (H = 0.26 ± 0.11, I = 0.42 ± 0.15) was observed in Tibet. This is probably due to the fact that these 30 samples were collected at a relatively low attitude with moist tropical climate. As a wild species, advantageous growing conditions could contribute to the high level of genetic diversity of P. mira Koehne. In addition, AMOVA demonstrated that the major part of genetic variations occurred among populations: 73.66% based on the ISSR markers and 82.31% on the RAPD markers. A possible reason for this could be that peach is predominantly selfing and diploid. Thus, there are different breeding systems and ploidy levels accounting for the overall genomic diversity of different peach species. Another reason underlying the high genetic variation among populations could be the wide geographical origin of Chinese peach.
Moreover, the Nei's estimate of the P. mira population structure (Gst) was lower than 0.50, which indicates that more than a half of the genetic variation occurred among populations. As the populations are distributed in different environmental conditions with significant landmasses between them, gene flow among populations was not prominent. This study confirmed our previous suggestion that the genetic diversity of wild P. mira plants was influenced by the ecological environment.[Citation17] Therefore, to conserve P. mira resources, more materials should be collected.
Conservation recommendations for Prunus mira Koehne
As an endangered species, P. mira Koehne has been threatened by human-related factors such as climate change, over-exploitation, pollution, land clearing for agriculture and other developments.[Citation3] Therefore, action is urgently needed to be taken to conserve P. mira Koehne germ plasm. It is generally considered that an ideal way to conserve wild plant species is to construct an in situ conservation region. Such an approach would lead to effective conservation of the genetic resources and would allow evolution of the species in its natural environment.[Citation30] However, the natural conditions in Tibet are unique due to complex local physiognomy and specific plateau climate. What is more, in situ conservation also needs to be supported by appropriate policy measures funded by local authorities.[Citation31] That is why it is difficult to conduct in situ conservation of P. mira Koehne. Taking this into consideration, it appears that a more feasible approach for protecting P. mira Koehne germ plasm would be ex situ conversation based on seed banks.[Citation32] Thus, for the purpose of ex situ conversation, samples of high quality should be collected from different populations. Although this study and our previous ones [Citation17,Citation29] covered a considerable area, the number of P. mira Koehne accessions collected is still limited. Therefore, future work should include collecting more P. mira Koehne germ plasm as well as obtaining more genetic information. At the same time, other supportive actions should also be undertaken. For example, promoting cultivation and domestication of this wild resource would be expected to give beneficial results both in order to satisfy the market demand and to protect the wild resource.
Conclusions
The results from this study confirmed that both ISSR and RAPD markers are efficient methods to estimate the genetic diversity of P. mira Koehne germ plasm. High genetic diversity among populations indicates that P. mira Koehne has high genetic variation. Future studies should focus on collecting more P. mira Koehne germ plasm as well as obtaining more genetic information for the purpose of ex situ conservation of this species.
Disclosure statement
No potential conflict of interest was reported by the authors.
Additional information
Funding
References
- Wang ZH, Zhuang EJ. [Fruit annals in China – scroll of peach and nectarine]. Beijing: China Forestry Publishing House; 2001. Chinese.
- Huang H, Cheng Z, Zhang Z, et al. History of cultivation and trends in China. In: Layne DR, Bassi D, editors. The peach: botany, production and uses. Wallingford: CABI; 2008. p. 37–60.
- Zhong ZC. Studies on resource ecology of Prunus mira Koehne (Amygdalus mira Koehne Kow et. Kpst) in Xizang (Tibet) Linzhi [ dissertation]. Linzhi: Tibet University; 2008.
- Dong GZ. The investigation of Prunus mira Koehne in Tibet. Q For By-prod Spec China. 1991;3:44–45.
- Fang JP, Zhong ZC, Zhong GH. The age structure of Tibetan Prunus mira Koehne Kov et Kpsl population in Tibet Linzhi region. China For Sci Technol. 2008;22:53–56.
- Hao HP, Jiang CD, Shi L, et al. Effects of root temperature on thermostability of photosynthetic apparatus in Prunus mira seeding. Chin J Plant Ecol. 2009;33:984–992.
- Hokanson SC, Szewc-McFadden AK, Lamboy WF, et al. Microsatellite (SSR) markers reveal genetic identities, genetic diversity and relationships in a Malus× domestica Borkh core subset collection. Theor Appl Genet. 1998;97(5–6):671–683.
- Cantini C, Iezzoni AF, Lamboy WF, et al. DNA fingerprinting of tetraploid cherry germplasm using simple sequence repeats. J Am Soc Hortic Sci. 2001;126(2):205–209.
- Cheng ZP, Huang HW. SSR fingerprinting Chinese peach cultivars and landraces (Prunus persica) and analysis of their genetic relationships. Sci Hort. 2009;120:188–193.
- Aranzana M, Pineda A, Cosson P, et al. A set of simple-sequence repeat (SSR) markers covering the Prunus genome. Theor Appl Genet. 2003;106(5):819–825.
- Christensen S, von Bothmer R, Poulsen G, et al. AFLP analysis of genetic diversity in leafy kale (Brassica oleracea L. convar. acephala (DC.) Alef.) landraces, cultivars and wild populations in Europe. Genet Resour Crop Evol. 2011;58(5):657–666.
- Ebrahimi R, Zamani Z, Kashi A. Genetic diversity evaluation of wild Persian shallot (Allium hirtifolium Boiss.) using morphological and RAPD markers. Sci Hortic. 2009;119(4):345–351.
- Williams JG, Kubelik AR, Livak KJ, et al. DNA polymorphisms amplified by arbitrary primers are useful as genetic markers. Nucleic Acids Res. 1990;18(22):6531–6535.
- Goulão L, Oliveira CM. Molecular characterisation of cultivars of apple (Malus × domestica Borkh.) using microsatellite (SSR and ISSR) markers. Euphytica. 2001;122(1):81–89.
- Arnau G, Lallemand J, Bourgoin M. Fast and reliable strawberry cultivar identification using inter simple sequence repeat (ISSR) amplification. Euphytica. 2003;129(1):69–79.
- Kar PK, Srivastava PP, Awasthi AK, et al. Genetic variability and association of ISSR markers with some biochemical traits in mulberry (Morus spp.) genetic resources available in India. Tree Genet Genomes. 2008;4(1):75–83.
- Xing C, Tian Y, Meng F. Evaluation of genetic diversity in Amygdalus mira (Koehne) Ricker using SSR and ISSR markers. Plant Syst Evol. 2015;301:1055–1064.
- Doyle JJ. A rapid DNA isolation procedure for small quantities of fresh leaf tissue. Phytochem Bull. 1987;19:11–15.
- Zietkiewicz E, Rafalski A, Labuda D. Genome fingerprinting by simple sequence repeat (SSR)-anchored polymerase chain reaction amplification. Genomics. 1994;20(2):176–183.
- Sneath PH, Sokal RR. Numerical taxonomy: the principals and practice of numerical classification. San Francisco (CA): W H Freeman & Co; 1973.
- Singh AK, Smartt J, Simpson CE, et al. Genetic variation vis-à-vis molecular polymorphism in groundnut, Arachis hypogaea L. Genet Resour. Crop Evol. 1998;45:119–126.
- Nei M. Analysis of gene diversity in subdivided populations. Proc Natl Acad Sci U S A. 1973;70(12):3321–3323.
- Pritchard JK, Stephens M, Donnelly P. Inference of population structure using multilocus genotype data. Genetics. 2000;155(2):945–959.
- Excoffier L, Smouse PE, Quattro JM. Analysis of molecular variance inferred from metric distances among DNA haplotypes: application to human mitochondrial DNA restriction data. Genetics. 1992;131(2):479–491.
- Chaparro JX, Werner DJ, O'malley D, et al. Targeted mapping and linkage analysis of morphological isozyme, and RAPD markers in peach. Theor Appl Genet. 1994;87(7):805–815.
- Dirlewanger E, Duha S, Viruel MA, et al. Identification of peach varieties using molecular markers. Acta Hort. 1997;465:69–78.
- Hu D, Zhang Z, Zhang D, et al. Genetic relationship of ornamental peach determined using AFLP markers. Hort-Science. 2005;40(6):1782–1786.
- Islam A. Genetic diversity of the genus Curcuma in Bangladesh and further biotechnological approaches for in vitro regeneration and long-term conservation of C. longa germplasm [ dissertation]. Hannover: University of Hannover; 2004.
- Li T, Liu J, Xie Y, et al. Analysis of genetic diversity in Prunus mira Koehne ex Sargent populations using AFLP markers. Plant Syst Evol. 2014;300(3):475–482.
- Eriksson G, Namkoong G, Roberds JH. Dynamic gene conservation for uncertain futures. For Ecol Manag. 1993;62(1):15–37.
- Gole TW, Borsch T, Denich M, et al. Floristic composition and environmental factors characterizing coffee forests in southwest Ethiopia. For Ecol Manag. 2008;255(7):2138–2150.
- Hamilton MB. Ex situ conservation of wild plant species: time to reassess the genetic assumptions and implications of seed banks. Conserv Biol. 1994;8(1):39–49.