
 ?Mathematical formulae have been encoded as MathML and are displayed in this HTML version using MathJax in order to improve their display. Uncheck the box to turn MathJax off. This feature requires Javascript. Click on a formula to zoom.
Abstract
The aim of this study was to emphasize the need for considering the stakeholders’ opinions on the planning, implementation and monitoring processes in determining the adverse effects created by the recreational and tourism activities in the protected natural areas. Natural protected areas are rich in terms of resource values. Therefore, the impact assessment of the stakeholders turns into a multi-criteria decision-making problem. In this respect, Kure Mountains National Park (KMNP), which joined Protected Areas Network (PAN) in 2012 and is one of the most important protected areas in Turkey, was selected as a sample area. The analytical hierarchy process (AHP), a multi-criteria decision-making approach, was used to compare the resource values dually between each other. As a result of the assessment, it was found that all the area stakeholders (managers, local people, experts and visitors) expressed that the adverse impacts of the recreational and tourism activities were observed primarily in the air and water quality. It was identified that the stakeholder groups assessed the recreational and tourism activities’ impact on the fauna, flora and vegetation at the same level. Consequently, the active involvement of the stakeholders in all processes in KMNP, which is run through a participatory approach, allowed them to have a common opinion on the impact assessment as well.
Introduction
The reduction of places, which allow people, living in urban areas, to be physically and mentally relaxed in, has led to an increase in the demand for natural areas in recent years. This causes a substantial pressure and challenges the management of the protected natural areas.[Citation1] Saving the natural ecosystems in the protected areas, on the one hand, and allowing the use of these areas for recreational/tourism purposes, on the other hand, presents a very complicated pattern. Within this complexity, determining the damage that the users cause in natural places and taking the necessary precautions are of great importance for the sustainability of the protected areas.
Area managers have a major role in ensuring the balance between use and protection of the natural fields. They should assess all the related quantitative and qualitative decision variables and make the right decision for all stakeholders (biotic and abiotic assets in the area, local people, visitors, managers, experts). The analytical hierarchy process (AHP) is a method that enables the combination of quantitative and qualitative evaluation analyses of all the decision variables that allows an assessment, when multiple interest groups and a large number of people participate in the decision-making process.[Citation2,Citation3]
The aim of this study was to emphasize the need for considering the stakeholders’ opinions on the planning, implementation and monitoring processes in determining the adverse effects created by the recreational and tourism activities in the protected natural areas. In addition, determining whether the opinions of the stakeholders with different impact assessments meet on a common ground would be of great importance in the future planning decisions. In this line, the Kure Mountains National Park (KMNP), one of the most important protected areas in Turkey, where participatory management approach is adopted, has been selected as the study area.
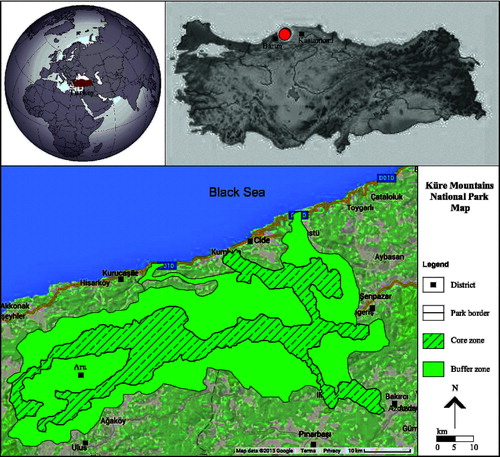
The study area, KMNP, is situated along the Central Black Sea coast in northern Turkey between Kastamonu and Bartın provinces (33° 13′ 04″–32° 29′ 27″ east longitude and 41° 52′ 35″–41° 37′ 27″ north latitude) ().[Citation4] The national park covers an area of 37,000 ha and is a significant protected area at regional and national scale in Turkey with its natural, cultural and recreational resource values. The national park has untouched moist and old growth karst forests, canyons, caverns, rich herbaceous and woody vegetation, flora, fauna, original architectural structure and various folkloric values that are rarely seen in the world.[Citation5] The site represents the best remaining example of the deciduous and coniferous forests of the North Anatolia sub-ecoregion as well as of the highly endangered karst mountains of the Black Sea humid forest ecotype.[Citation6] The number of the plant taxons documented in KMNP is 930. A number of these species (157) are endemic and 59 of the endemic species are in the red list. High-altitude karst plateaus with limited human influence are home to a healthy and intact forest ecosystem. The forest animals can live in the old and dry trees, and the rich plant groups are proper for their feeding.[Citation7] KMNP's biological importance is bound to the fact that it offers different habitats for many animals. Mammal species (48 out of 160) that live in Turkey can be found in KMNP.[Citation7] The cultural values have always been an important asset in the national parks. The village houses with their original architectural properties, the colourful clothes that women still wear in their daily lives, as well as the handicrafts and local food, are important cultural values of this national park.[Citation8]
Figure 1. Location map of Kure Mountains National Park, Turkey.
KMNP was listed as one of the priority areas for protection in 1988 and was defined as the ‘hot spot of European forests’ by the World Wide Fund for Nature (WWF) with the contribution of the Turkish department.[Citation9] KMNP, received the Protected Areas Network (PAN) Parks certificate in 2012, which is granted to well-managed protected areas, where successful sustainable tourism activities are conducted.[Citation10]
KMNP has a low tourism profile at national and international levels.[Citation11] The development of the tourism industry in KMNP started in 2000s, following the designation of the national park. By receiving the PAN Parks certificate in 2012, KMNP drew attention, and some tourist groups, especially eco-tourists, began to visit the area. Visitor management plan for this area was prepared, however, not yet implemented. Also, the lack of adequate infrastructure services in the area causes adverse effects on the resource values.
KMNP is a rich protected area with the resource values that it has. The impacts of the visitors using the area for recreational and tourism activities are also seen in vegetation, flora, fauna, canyons, caves, forests, original architectural structures and various folkloric values. KMNP has been divided into two zones – core zone and buffer zone. The core zone is more sensitive to impacts than the buffer zone, so the impacts are seen in different levels. In particular, the fact that the visitors of the national park come from a very different demographic structure and the fact that the national park has areas with different sensitivity levels influence on the way of perception of the recreational and tourism activities’ impacts on the resource values. This makes the evaluation of the impacts of the recreational and tourism activities into a multi-criteria decision-making problem.
This study consists of four parts. The first part evaluates the use of the protected areas for tourism and recreational purposes. The second part shows the AHP methodology and its use in the present study. The third part explains the assessment of the impacts of the recreational and tourism activities on the resource values of KMNP through the perspectives of the area stakeholders. In the conclusion of the study, the recommendations were made based on analysis results.
The main priority for the protected natural areas is to preserve the natural, cultural and visual resource values, to improve the environmental conditions, to meet the tourism and recreational needs of the individuals and the community, while performing scientific researches and educational activities.[Citation1]
The increasing recreational and tourism demand and the improperly planned and managed protected natural areas is a big threat.[Citation12] Protected natural areas have become an attractive destination for urban people, especially because of the fact that they have a high potential for recreational possibilities and also because of the diversity of the natural landscapes and the existing fauna, flora and vegetation.[Citation13] The increasing number of people visiting the area means that there will be an increase in the different characters and demands. This creates a visitor group with various expectations from the area and causes different satisfaction levels. Furthermore, the lack of adequate knowledge from people with different education and awareness levels about the protected area also determines the sensitivity that they show towards the area. This may cause various effects on the area. In the study by Peterson et al. [Citation14], the impact was defined as the visitor-originating unwanted physical damage.
Although recreational and tourism activities in the protected natural areas seem to be natural, it is inevitable that the area of such activities is under their influence. Such impacts are felt in all resource values of the protected natural regions. The impact levels vary depending on the sensitivity of the resource value, the type of the activity and the intensity and duration of use.
The use of the protected natural areas for recreational and tourism purposes can cause serious problems, such as top soil compaction, reduction of flora and vegetation, changes in fauna behaviour, pollution of water resources, alteration of air quality and changes in the landscape and terrain. Therefore, the recreational and tourism activities impacts should be kept on minimum in order to protect and maintain the natural environment.[Citation15]
Materials and methods
Research material
Face-to-face surveys applied to the stakeholders selected through simple random sampling method formed the main material for the study. According to the results of the Address Based Population Registration System held in 2013, the population of Kastamonu and Bartın provinces has been declared as 557,232.[Citation16,Citation17] The number of the applied surveys was determined with 5% sampling error. A total number of 350 surveys (200 to visitors, 50 to experts, 50 to managers and 50 to local people) were conducted.[Citation18]
Research method
The AHP method was used in the study to determine the resource values that are affected by recreational and tourism activities. AHP is a complex and the most preferred method in the priority analysis of the multi-criteria problems.[Citation19] This is a mathematical method developed by Saaty [Citation20] for the analysis of complex decisions by using multiple criteria. It is considered a successful approach for the evaluation of qualitative and quantitative characteristics. In particular, the AHP is applied widely in the analyses for efficiency and effectiveness and in the performance measurement cases. It has four implementation phases [Citation21,Citation22]:
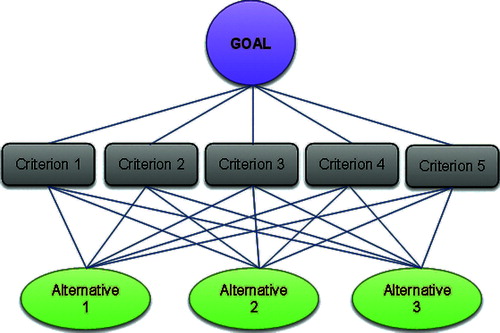
In line with the main objective of the decision-maker in the AHP, this is the phase where the criteria and sub-criteria were determined, and the hierarchical structure was created accordingly.[Citation23] The factors affecting each other were defined and grouped with the created hierarchical structure ().[Citation24]
Figure 2. A hierarchical example with five criteria and three alternatives for a goal.
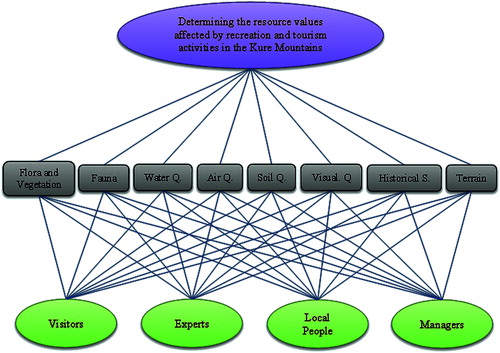
A literature review and fieldwork were carried out in order to determine the resource values of KMNP. The resource values of the area were determined in eight criteria: flora and vegetation, fauna, water quality, air quality, soil quality, visual quality and aesthetics, historical and cultural features, terrain. The stakeholders were identified as visitors, experts, managers and local people ().
The factors involved in the decision-making process were compared according to their importance or preference status.[Citation25] During the comparison, it was determined which of the two factors was more important and how important it was. The evaluator made an evaluation providing points from 1 to 9, according to his/her own perspective. If both criteria were equally important, 1 was given, whereas 9 was given if one of the criteria was certainly more important, compared to the other one ().[Citation26]
Table 1. Analytic hierarchy process scale and definitions.[Citation2,Citation26]
Figure 3. Hierarchy process created for determination of the resource values affected by the recreational and tourism activities in the Kure Mountains National Park.
An nxn pairwise comparison matrix A, whose diagonal elements are 1 was created through the comparison. The number of evaluation criteria considered was n. The value of nth alternative with respect to nth criteria was ann.
In order to determine the importance levels of the recreational and tourism activities on the resource values (relative importance, priorities), the expert group, area managers, local people and visitors of the area were asked to make an evaluation. People, participating in the survey, were requested to carry out the evaluation by comparing each resource value dually. For this purpose, a comparison matrix was created ().
In this phase, percentage distribution of the factors’ importance was determined. The comparison matrix showed the importance levels of the factors regarding each other in a reasonable manner. However, column vectors consisting of the comparison matrix were used in order to determine the distribution of importance percentage of such factors, and column vector B was created. This vector is shown below (EquationEquation (1
Table 2. AHP pairwise comparison matrix.
Priority vector (W) was calculated by taking the arithmetic average of the line components of the C matrix. The priority vector shows the importance values of the factors regarding each other.[Citation3,Citation26]
A consistency ratio (CR) was calculated depending on the mutual matrix properties. With the CR, the consistency of the priority vector and thus one-to-one comparisons between the factors can be tested. The maximum eigenvalue (λmax) is always greater than or equal to the number of lines or columns (n). If the comparisons do not contain inconsistencies, it is expressed as λmax = n. As the consistency between the comparisons increases, λmax value approximates to n. In order to calculate λmax, weighted priority vector (V1) was obtained primarily by the matrix multiplication of the comparison matrix A and the priority vector W.[Citation3]
The random consistency index (RI), which is the average of the CI of the randomly generated comparisons and the value given in , is taken into account based on the factor number.[Citation27] If the calculated CR value is less than 10%, it shows that the comparisons made by the decision-makers are consistent.[Citation28,Citation29]
Table 3. Random consistency index values (RI values).[Citation27]
Statistical analyses
One-way analysis of variance and post hoc t-tests were run to evaluate the differences between the stakeholders’ views, using the SPSS software (Version 22, SPSS Inc., Chicago, IL, USA). The standard errors and significance level were calculated for each stakeholder. The accepted level of significance was 0.01.
Results and discussion
The evaluation of the affected resource values from the recreational and tourism activities, according to the stakeholders views, determined that there were differences between the views with a significance level of 0.01 ().
Table 4. Differences between the views of stakeholders.
Given the priority vector (W) of the recreational and tourism impacts in KMNP resource values, the CR for visitors (0.098) was found to be less than 10%. Visitors stated that the impact of the recreational and tourism activities were important for the air quality (0.34), water quality (0.22) and visual quality and aesthetics (0.15). The priority vectors of the other resource values are given in .
Table 5. Impact of recreational and tourism activities on the resource values – visitors’ evaluations.
As a result of the calculations for the expert group, the CR (0.099) was found to be less than 10%, which meant that the comparisons were consistent. When the priority vector was evaluated in terms of the resource values, it was found out that the experts stated that recreational and tourism activities had significant impacts on air quality (0.29), water quality (0.25) and visual quality and aesthetics (0.14). The priority vectors of the other resource values are given in .
Table 6. Impact of recreational and tourism activities on the resource values – experts’ evaluations.
When the local people's evaluations of the recreational and tourism activities impacts on the resource values were done, the CR (0.089) was found to be less than 10%. They stated that the recreational and tourism impacts were mostly on the air quality (0.33) and water quality (0.24) ().
Table 7. Impact of recreational and tourism activities on the resource values – local people's evaluations.
When the situation was evaluated by the area managers, it was seen that similar results to those, from the other stakeholder groups, were obtained. The CR (0.095) was found to be less than 10% and the impacts on the air (0.33) and water quality (0.23) were the most significant ().
Table 8. Impact of recreational and tourism activities on the resource values – managers’ evaluations.
When the stakeholder groups’ opinions were evaluated, the expert group stated that the water quality (0.25) and soil quality (0.06) were affected the most by the recreational and tourism activities impacts, compared to the other groups, whereas the most impact seen in the air quality (0.34) was stated by the visitors. Visitors and managers stated that the impacts of recreational and tourism activities on the visual quality (0.15) were more, when compared to the local people and experts’ opinion (0.14). Experts and the managers (0.04) stated that the impacts of recreational and tourism activities on the terrain were more than those the local people and visitors (0.03) did. The impacts of recreational and tourism activities on historical and cultural values were rated less by managers (0.08). It was found out that the stakeholders came to an agreement on the recreational and tourism impacts on fauna (0.05) and flora and vegetation (0.08) ().
Figure 4. The percent distribution (priority vector) of each stakeholder.
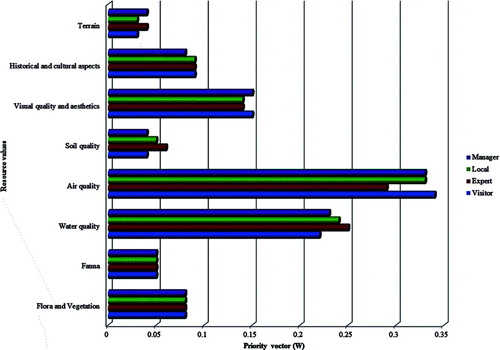
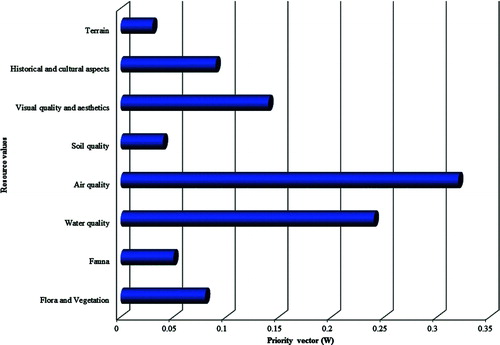
When the priority vector, which was the percentage distribution of the decision points obtained as a result of the study, was examined, the following were found: air quality (0.32), water quality (0.24), visual quality and aesthetics (0.14), historical and cultural features (0.09), flora and vegetation (0.08), fauna (0.05), soil quality (0.04) and terrain (0.03). As shown by the priority values of the criteria, the most affected resource value was found to be air quality (0.32) ( and ). When was analyzed, it could be seen that the terrain, one of the resource values of KMNP, was exposed to minimum impacts of the recreational and tourism activities.
Table 9. Stakeholders’ evaluations of the recreational and tourism activities’ impacts on the resource values.
Figure 5. Stakeholders’ evaluation of the recreational and tourism activities’ impacts on the resource values.
The studies carried out so far presented many adverse effects on the natural areas as a result of the recreational and tourism activities, such as top soil compaction, reduction of the flora and vegetation, changes in fauna behaviour, area loss, pollution, noise and forest fires.[Citation13,Citation15] Likewise, in the study of KMNP, it was shown that similar resource values were affected, according to the views of the stakeholders. Experts stated that the impacts of recreational and tourism activities on the soil quality and water quality were more, when compared to the other groups’ opinion. These results are consistent with previous similar studies.[Citation15]
It is thought that the adverse effects caused on the resource values are due to a not properly applied visitor management plan for the area. There is a considerable lack of infrastructure in the area. It is thought that there are some adverse effects caused by inadequate sewerage systems, not defined vehicle–pedestrian paths, lack of access control and undefined recreation and tourism areas, such as picnic areas and camp areas. These deficiencies caused adverse effects on the air, water and visual qualities, as well as on the aesthetic value, as noted by the stakeholders. It was considered that stakeholders might evaluate the resource values, according to the current situation of the area, except for the air quality. The opinion that the air quality was damaged the most came to the forefront, but no activities that may have an impact on the air quality were found in and around the area, as a result of the analyses (industry, traffic, forest fires, etc.). It is a fact that a potential forest fire in the area would reduce the air quality. It was considered that the stakeholders might have evaluated a potential situation for the area.
KMNP was decided to be announced as a national park through a participatory approach. Its borders were determined by the participation of all the area stakeholders, and its planning decisions were taken and managed in line with this approach. Because a participatory approach was adopted in all processes that the national park went through, the approach of all the stakeholders to the resource values was assumed to be the same.
Conclusions
In conclusion, the results of the study indicated that the stakeholders had similar opinions about the recreational and tourism impacts on the KMNP resource values. Therefore, to avoid adverse effects occurring in the area, first, the stakeholders’ opinion about the recreational and tourism impacts on the resource values should be determined, and then, a proper and participatory approach-based visitor management plan should be produced and implemented. It is also necessary to solve the infrastructure problems in order to protect the air quality, water quality, visual quality and aesthetic values, which are by far the most affected values by the recreational and tourism activities, according to the views of the stakeholders.
Acknowledgement
This study is performed with KÜBAP-01/2012-14 project results supported by Kastamonu University Coordinatorship of Scientific Research Projects.
Disclosure statement
No potential conflict of interest was reported by the authors.
Additional information
Funding
References
- Gül A, Akten M. Recreational carrying capacity in protected natural areas and conceptual approaches. Protected Natural Areas Symposium; 2005 Sep 8–10; Isparta, Turkey.
- Ananda J, Herath G. The use of analytic hierarchy process to incorporate stakeholder preferences into regional forest planning. For Policy Econ. 2003;5:13–26.
- Yavuz S. Determination of effective factors in teachers car preferences with the analytic hierarchy process. DPUJSS. 2012;32(2):29–46.
- Anonymous. Kure Mountains National Park ecosystem-based forest management functional plan preparation project. Ankara (Turkey): TR Ministry of Forestry and Water Management, GEF and UNDP, Middle East Forestry Project and Consultancy Trading Co.; 2011. p. 7.
- Anonymous. Kure Mountains National Park long term development plan planning report. Ankara (Turkey): TR Ministry of Forestry and Water Management, General Directorate of Nature Conservation and National Parks; 2012. p.1–2.
- Kalem S. Hot spots for nature conservation. Nat Geogr Turkiye. 2005;2:24–36.
- Kure Mountains National Park Animals [Internet]. Turkey; 2014 [cited 2014 May 15] Available from: http://www.kdmp.gov.tr/alt_detay_3-en.asp?id=10&alt_id=19&id_son=28.
- Kure Mountains National Park History and Culture [Internet]. Turkey; 2014 [cited 2014 May 15]. Available from: http://www.kdmp.gov.tr/alt_detay_2-en.asp?id=10&alt_id=18.
- Kure Mountains National Park and buffer area rapid field assessment, final report. Ançeo Ltd. GEF-supported “Enhancing Forest Protected Areas Management Project” Ministry of Environment and Forestry, UNDP Turkey and WWF Turkey. Ankara, Turkey; 2010.
- Kure Mountains National Park Received Pan parks certificate [Internet]. Turkey; 2014 [cited 2014 May 15]. Available from: http://www.kdmp.gov.tr/haber_detay_en.asp?haid=163.
- Turker N, Ozturk S. Perceptions of residents towards the impacts of tourism in the Kure Mountains National Park, Turkey. Int J Business Soc Sci. 2013;4:45–56.
- Newsome D, Moore SA, Dowling RK. Natural area tourism: ecology, impacts and management. Cleveland: Channel View Publications; 2002.
- Uzun S, Müderrisoğlu H, Kaya LG. Ecological impacts of recreational activities in natural areas. I. Recreation Studies Congress; 2012 Apr 12–15; Kemer, Antalya, Turkey. p. 791–809.
- Peterson GL, Driver BL, Brown PJ. The benefits and costs of recreation: dollars and sense. In: Johnson RL, Johnson GV, editors. Economic valuation of natural resources: issues, theories and applications. Boulder (CO): Westview Press; 1990. p. 7–24.
- Demir C. Adverse environmental impacts of tourism and recreation activities: an application on national parks in Turkey. J Dokuz Eylul Univ Fac Econ Admin Sci. 2002;17(2):93–117.
- Turkish Address Based Population Registration System datas for Bartın [Internet]. Turkey; 2013 [cited 2014 May 19]. Available from: http://www.bartin.gov.tr/nufus-ve-idari-durum.
- Turkish Address Based Population Registration System datas for Kastamonu [Internet]. Turkey; 2013 [cited 2014 May 03]. Available from: http://kastamonu.gov.tr/nufus.asp.
- Yazıcıoğlu Y, Erdoğan S. SPSS applied research methods. Ankara: Detail Publishing; 2004. p. 74.
- Varis O. The analysis of preferences in complex environmental judgments-a focus on the analytic hierarchy process. J Environ Manage. 1989;28:283–294.
- Saaty TL. Fundamentals of decision making and priorty theory. Pittsburgh (PA): RWS Publications; 2000. p. 6.
- Peters M, Zelewski S. Pitfalls in the application of analytic hierarchy process to performance measurement. Manage Decision. 2008;46(7):1039–1051.
- Eroğlu E, Lorcu F. Data envelopment analytic hierarchy process with digital decision making. Istanbul Univ Fac Bus Admin Bus J. 2007;36(2):30–53.
- Scholl A, Manthey L, Helm R. Solving multi attribute design problems with analytic hierarchy process and conjoint analysis: an empirical comparison. Eur J Oper Res. 2005;164(3):760–777.
- Adıgüzel O, Çetintürk İ, Er O. Determining the customer preferences to hospitality industry with analytic hierarchy process method. Suleyman Demirel Univ Vis J. 2009;1(1):17–35.
- Özgörmüş E, Mutlu Ö, Güner H. Staff selection with Fuzzy AHP. Istanbul Commerce University V. National Production Research Symposium; 2005 Nov; Istanbul, Turkey. p. 111–115.
- Yaralıoğlu K. Analytic hierarchy process in performance evaluation. J Dokuz Eylul Univ Fac Econ Admin Sci. 2001;16(1):129–142.
- Saaty TL, Vargas LG. Models, methods, concepts and applications of the analytic hierarchy process. Norwell (MA): Kluwer Academic Publishers; 2001.
- Saaty TL. Decision making with dependence and feedback, the analytic network process. 2nd ed. Pittsburgh (PA): RWS Publications; 2001.
- Kangas J. An approach to public participation in strategic forest management planning. For Ecol Manage. 1994;70:75–88.