
 ?Mathematical formulae have been encoded as MathML and are displayed in this HTML version using MathJax in order to improve their display. Uncheck the box to turn MathJax off. This feature requires Javascript. Click on a formula to zoom.
Abstract
The aim of this study was to estimate the kinetic parameters of alkaline protease production with consideration of different growth kinetic models in order to establish the most adequate one to describe the bioprocess dynamics in both batch and fed-batch modes. As a result, a particular method for parameter estimation is developed in this paper. In this method, a hybrid of two metaheuristic techniques, genetic algorithm (GA) and particle swarm optimization (PSO), which takes advantage of both techniques, is applied. In the suggested hybrid algorithm, GA provides the initial population for PSO and then PSO performs the improvement task. The method needs low-intensive computation and proved to be superior to the traditional methods. As a result of applying this method, it was found that the Contois model, in spite of its simplicity, provides a satisfactory agreement with the experimental data, whereas the adoption of more detailed models leads to negligible improvements of the fit. Finally, for comparison of performance of the hybrid algorithm, we used GA only and PSO only. It was shown that the proposed hybrid between meta-heuristics GA and PSO is more effective in terms of running time (two-fold faster) and solution quality, since it benefits from synergy. Also it was concluded that PSO performed slightly better than GA.
Introduction
Alkaline proteases are the most commercialized and used enzymes in the world.[Citation1] Microbial alkaline proteases dominate the global enzyme market, as they are known to account for about two-thirds of the detergent industry in the world.[Citation2] They are widely used in the tanning industry, in the manufacturing of biological detergents, meat tenderization, peptide synthesis, food industry, pharmaceutical industry, and in bioremediation processes.[Citation3] Microbial proteases are gaining more importance than conventional chemicals that cleave peptides because of the cheaper production cost and use of renewable resources.[Citation4] Among all protease-producing microbial systems, microbes belonging to the Bacillus genus have gained importance because of extracellular enzyme production under submerged fermentation conditions.[Citation5] Although there have been a number of studies on protease production by Bacillus species, there are only a few reports on kinetic analysis of the protease production process.
In order to effectively analyze and subsequently optimize a biological process, the kinetics of the process need to be understood and quantified. Although a lot of kinetic models have been developed for the growth of cells in bioprocesses, unstructured models are considered to still give the most basic understanding of metabolism of microbiological processes.[Citation6] These unstructured models include a set of kinetic parameters. The large number of parameters and the nonlinearity of the differential equations describing these models pose serious challenges when it comes to fitting them to experimental data. The employment of classical nonlinear optimization techniques, such as the Levenberg–Marquardt algorithm,[Citation7] has limited success, especially when there are many parameters, the search space for each of them is vast, and there is not a good initial estimate for their values. These limitations serve as a motivation to use metaheuristics to perform the optimization, as opposed to fully deterministic algorithms.[Citation8,Citation9]
Different metaheuristic methods have been applied to circumvent the parameter estimation difficulties. Genetic algorithms (GAs) were first proposed by John Holland in 1975.[Citation10] GAs are quite promising as a stochastic global optimization method.[Citation11] They are adaptive heuristic search algorithms based on the evolutionary ideas of natural selection and genetics.[Citation12] GA is perhaps the most popular method used in the parameter estimation problem.[Citation13] GA requires only information concerning the quality of the solution and does not need linearity of the parameters. Properties such as noise tolerance and ease of interfacing and hybridization make GA a suitable method for the identification of parameters in fermentation models.[Citation11] Particle swarm optimization (PSO) is also an evolutionary algorithm first proposed by Kennedy and Eberhart in 1995.[Citation14] The theoretical fundamental of PSO is the social influence and social learning mechanism of a kind of social psychological modal motivated by the behaviour of organisms such as fish schooling and bird flocking.[Citation15] PSO shares many similarities with evolutionary computation techniques such as GA.[Citation16] Both methods are issued from artificial intelligence which makes them possible to handle highly nonlinear problems based on efficient stochastic optimization formalisms.[Citation17] Both are population-based search approaches and they depend on information shared among their population members to improve their search processes using probabilistic rules.[Citation18] However, unlike GA, PSO has no evolution operators such as crossover and mutation.[Citation16]
Considering the efficiency of PSO and the compensatory property of GA and PSO, combining the searching abilities of both methods in one algorithm seems to be a logical approach to decrease the computational time and improve their effectiveness (solution quality) and convergence.[Citation18,Citation19]
In recent years, both GA and PSO, as well as hybrid algorithms combining the two, have been applied to parameter estimation problems, in the context of kinetic models of microorganisms.[Citation9,Citation13,Citation20–24]
In this study, parameter estimation was carried out in different growth kinetic models in both batch and fed-batch modes to satisfy the experimentally measured growth rate, substrate concentration, and enzyme production.
Materials and methods
Microorganisms
The bacterial strain used in this study was isolated from soils collected at different locations in north Iran. It was identified as Bacillus licheniformis (strain MG5) as described previously.[Citation25] The strain was maintained on nutrient agar slant and used throughout the study.
Fermentation conditions
The pre-culture medium was nutrient broth containing yeast extract, 2 g/L; peptone, 5 g/L; NaCl, 5 g/L; beef extract, 1 g/L. It was sterilized at 121 °C for 15 min.[Citation26] Production of protease was carried out in 500-mL shake flasks with 100 mL medium containing the following constituents: glucose, 20 g/L; K2HPO4, 7 g/L; KH2PO4, 2 g/L; MgSO4.7H2O, 0.2 g/L; NaCl, 0.5 g/L; (NH4)2SO4, 1 g/L; CaCl2, 0.07 g/L. Separately sterilized glucose was added to the medium as a carbon source just before inoculation. The cultures were inoculated with the above-mentioned pre-cultures and incubated at 35 °C and 150 r/min. To identify the model parameters, a reaction was carried out for 32 h in batch and fed-batch modes.
The initial concentration of substrate in both batch and fed-batch modes was 40 g/L, and in fed-batch mode, the feed rate and feed concentration were 0.01 L/h and 40 g/L, respectively.
Analytical procedures
Periodically, samples were withdrawn and the concentrations of cells and residual glucose as well as protease enzyme activity were determined. Bacterial growth was monitored by using a spectrophotometer at the optical density of 600 nm (OD600), which was then converted to cell dry weight (CDW), using a calibration curve. A standard graph was plotted for CDW versus absorbance for further estimation of CDW.[Citation26] Dinitrosalicylic acid was used for residual sugar assessment.[Citation27] Protease activity was determined as released tyrosine from the supernatants, according to a modified Lowry method.[Citation28] One unit of enzyme activity was defined as the amount of the enzyme resulting in the release of 1 mg of tyrosine per minute at 34 °C under the reaction conditions.
All experiments were performed in triplicate and the experimental data given in this paper were arithmetic mean values of the triplicate experiments.
Problem formulation
The following set of differential equations [Citation24] describes a fermentation process:
(1)
(1)
(2)
(2)
(3)
(3)
(4)
(4)
In the above equations, X, S, P, t, and µ are cell mass concentration, substrate concentration, product concentration, the fermentation time, and specific growth rate, respectively. EquationEquation (1)(1)
(1) describes the dynamics of cell mass concentration. In this equation, kd denotes the death constant for biomass. EquationEquation (2)
(2)
(2) describes the dynamics of substrate concentration. In this equation, YX/S, ms, k, and S0 are the yield of biomass per unit mass of substrate, maintenance coefficient, saturation constant for the enzyme, and initial substrate concentration, respectively. EquationEquation (3)
(3)
(3) describes the product formation. In this equation, α is the product yield parameter and kp is the decomposition rate of the enzyme. EquationEquation (4)
(4)
(4) gives the reactor volume (V) in terms of feed-in rate (f) and initial volume. It should be noted that in batch mode f was taken to be zero.
The growth of microorganisms during bioconversion is a complex process.[Citation6] The kinetic model of microbial fermentation is a fundamental tool for better understanding cell growth and product formation in a quantitative manner.[Citation29] Many mathematical models have been suggested to describe microbial growth as a function of concentration of the growth-limiting medium component and a set of kinetic parameters.[Citation30]
The Monod equation is usually used to relate the specific growth rate (µ) to the concentration of the substrate (S) with Equation (9) in . Today, this model is widely used for simulation of microbial growth processes in biotechnology and microbial ecology. Nevertheless, Monod's equation has been criticized in various respects and, therefore, many alternative models (Equations (5)–(11)) have been proposed in the literature ().[Citation6,Citation30]
Table 1. Growth models considered for the data evaluation.[Citation30–32]
Parameter estimation
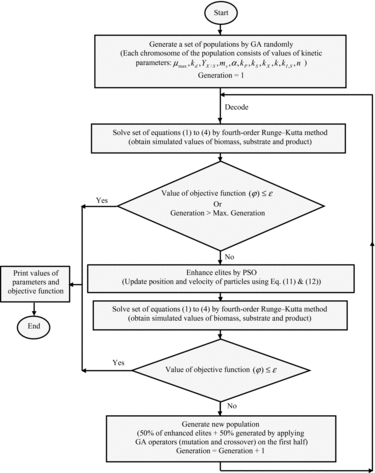
In this paper, we investigate a hybrid metaheuristic method that combines GA and PSO. In the proposed algorithm, first, GA generates a set of population randomly. Each population introduces a set of potential solutions to the problem. The potential solution (individual) is coded as a binary vector called a chromosome, the elements of which are called genes and situated in predefined positions indicated as alleles. One chromosome consists of eight or nine genes (depending on the number of parameters in each kinetic model (Equations (5)–(11))), coding for the parameters ( ), respectively. One gene is coded by a binary string of 20 bits. Therefore, every possible solution of the parameters is simply represented by a binary string of 160 or 180 bits ().
Figure 1. Chromosome structure in GA.
Then, via decoding, the binary number of each gene in the chromosome is transformed to a decimal system. In the next step, for obtaining simulated values of biomass, substrate, and product, a set of nonlinear differential equations (EquationEquations (1)(1)
(1) –(Equation4
(4)
(4) )) is solved by the fourth-order Runge–Kutta method (equation kinetic parameters are replaced with the ones estimated in the previous step). Next, value of objective function is calculated.
The estimation of the parameters in the biological model is often formulated as an optimization problem. Formally, the objective function of the problem is usually intended to minimize the difference between the model outputs produced by the estimated parameters and the respective experimental measurements.[Citation22] In this study, the objective function (EquationEquation 12(12)
(12) ) is presented as a minimization of a distance measure ϕ between the experimental and the calculated values of the main state variables (X, S, and P):
(12)
(12) where m is the number of the experimental data; Xexp, Sexp, and Pexp are the experimental data for biomass (B. licheniformis), substrate (glucose), and product (alkaline protease); Xpred, Spred, and Ppred are the predicted values for biomass, substrate, and production with a given set of parameters.
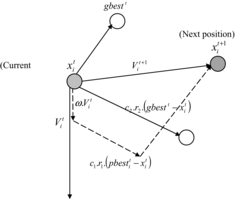
After calculating the value of the objective function, the final criteria are investigated. These can typically be (1) maximum number of generations: 100; or (2) minimization of the objective function ( ). While the final criteria are met, the values of parameters would be printed; otherwise an elite solution (the upper-half of the best-performing individuals in a population are regarded as elites) would be enhanced by PSO. In PSO, particles (50 particles) search for the best solution across the search space consisting of the elite solution. The position and velocity of particles are updated by applying an operator so that particles can be expected to change towards the better solution. The updating procedure is defined by the following equations:
(13)
(13)
New velocity
(14)
New position
Figure 2. Depiction of the velocity and position updates in PSO.
In the next step, a set of nonlinear differential equations (EquationEquations (1)(1)
(1) –(Equation4
(4)
(4) )) is solved by the fourth-order Runge–Kutta method (equations kinetic parameters are replaced with the ones estimated in the previous step) and then the final criterion (minimization of the objective function) is investigated. While the final criterion is met, values of parameters would be printed; otherwise a new population is generated. The enhanced elites constitute half of the population in the new generation, whereas the other half is generated by applying GA operators (crossover and mutation) on these enhanced elites.
This loop would continue until the final criteria are reached. The flowchart of the hybrid GA/PSO is shown in
Figure 3. The flowchart of hybrid GA/PSO.
It should be noted that all calculations of hybrid GA/PSO were implemented in Matlab R2012b (MathWorks Inc., Massachusetts, USA).
Results and discussion
In this study, the kinetic models that are presented in were validated against experimental data by estimating the model parameters ( n). The final results of parameter estimation obtained by hybrid GA/PSO for growth kinetic models are presented in . These parameters are used to generate time profiles of substrate, biomass, and product concentrations for the model.
Table 2. Estimated kinetic parameters by hybrid GA/PSO method and value of objective function for various kinetic models.
(a)–(g) and (a)–(g) show the comparison between simulated data and experimental data for various growth kinetic models in batch and fed-batch mode, respectively. The simulated data are obtained by solving EquationEquations (1)(1)
(1) –(Equation4
(4)
(4) ) by the fourth-order Runge–Kutta method (equation kinetic parameters are replaced with the ones estimated by hybrid GA/PSO).
Figure 4. Comparison of the experimental and simulated data of batch fermentation by various growth kinetic models: Aiba (a), Andrews (b), Contois (c), Haldane (d), Monod (e), Moser (f), and Tessier (g). Experimental concentrations of X (٭), S (○), and P (◊) vs. hybrid GA/PSO simulated data (solid lines). Note: X, biomass (B. licheniformis); S, substrate (glucose); P, product (protease). Initial concentration of substrate is 40 g/L.
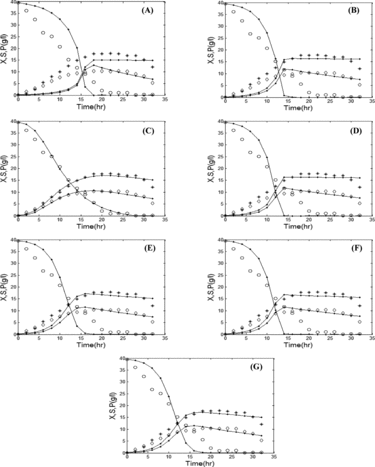
Figure 5. Comparison of the experimental and simulated data of fed-batch fermentation by various growth kinetic models: Aiba (a), Andrews (b), Contois (c), Haldane (d), Monod (e), Moser (f), and Tessier (g). Experimental concentrations of X (٭), S (○), and P (◊) vs. hybrid GA/PSO simulated data (solid lines). Note: X, biomass (B. licheniformis); S, substrate (glucose); P, product (protease). Initial concentration of substrate is 40 g/L; feed rate = 0.01 L/h.
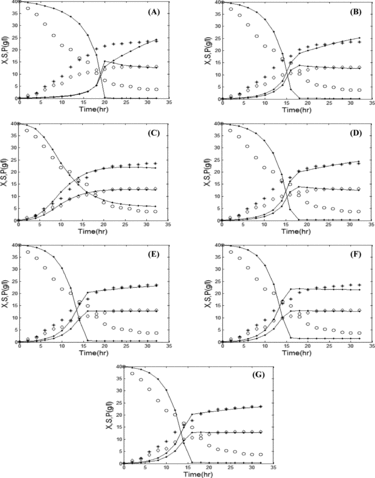
The results presented in indicate that for an initial glucose concentration (S0) of 40 g/L, the Contois model shows a better fit as compared to other models in both batch and fed-batch modes, i.e. the value of the objective function is less than those in the other growth kinetic models (ϕ = 0.0582 for batch and ϕ = 0.0518 for fed-batch).
The results show that the Contois model was able to replicate the concentrations of product, substrate, and biomass as obtained in the experiment. This is evident by the low value of the objective function and, hence, the model exhibits a good fit with the experimental data. Thus, the Contois model may be proposed as the best model to describe alkaline protease production in both batch and fed-batch modes.
To evaluate the performance of the hybrid algorithm, we used GA only and PSO only for comparison. As an example, this comparison was performed for the best-fit model (the Contois model).
and along with (c) and (c) illustrate that all the three algorithms successfully model the dynamics of protease production in both batch and fed-batch modes. Nevertheless, the values of the objective function and computation time that are presented in revealed that the hybrid GA/PSO fits the real experimental data more precisely than either conventional GA or PSO alone. We observed that our hybrid GA/PSO algorithm achieves results similar to those obtained by GA only and PSO only, i.e. the values of the objective function are close to those obtained by each of the algorithms alone), but uses less computation time (t = 53.21 and 57.02 s in batch and fed-batch mode, respectively). The time needed is about two-fold less compared to others.
Figure 6. Comparison of the experimental and simulated data of batch fermentation by the Contois model by using GA (a) and PSO (b). Experimental concentrations of X (٭), S (○), and P (◊) vs. simulated data (solid lines). Note: X, biomass (B. licheniformis); S, substrate (glucose); P, product (protease). Initial concentration of substrate is 40 g/L.
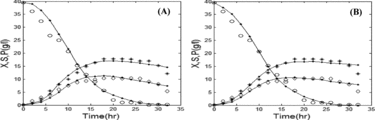
Figure 7. Comparison of the experimental and simulated data of fed-batch fermentation by the Contois model by using GA (a) and PSO (b). Experimental concentrations of X (٭), S (○), and P (◊) vs. simulated data (solid lines). Note: X, biomass (B. licheniformis); S, substrate (glucose); P, product (protease). Initial concentration of substrate is 40 g/L; feed rate = 0.01 L/h.
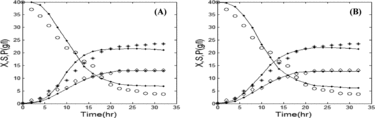
Table 3. Comparison of performance across GA, PSO, and hybrid GA/PSO.
Furthermore, in all three algorithms, the computation time in fed-batch mode was observed to be slightly higher than that in batch mode. This is due to more complicated computation in fed-batch mode than in batch mode. In fed-batch mode, a set of four nonlinear differential equations (EquationEquations (1)(1)
(1) –(Equation4
(4)
(4) )) must be solved, unlike the batch mode which needs three simpler equations (EquationEquations (1)
(1)
(1) –(Equation3
(3)
(3) ) with f = 0).
The results also show that PSO has slightly better performance and possesses better convergence properties than GA. The simple structure associated with minimal parameter tuning helps PSO algorithm in outperforming GA. A higher convergence rate of PSO over GA is also reported in [Citation33] with fed-batch optimization of α-amylase and protease production.
It should be noted that while applying PSO and GA, a number of parameters are required to be specified. An appropriate choice of the parameters affects the speed of convergence of the algorithm. In this study, the parameters of GA were set as follows: population size 80, maximum generations 100, cross-over probability 0.5, and mutation probability 0.0009. In the case of PSO, the parameters of particle size, maximum generations, and inertia weight were set to 50, 100, and 0.4, respectively.
In general, the fitting of fermentation data to kinetic models of microbial growth is a complex problem for which the usual deterministic optimization algorithms based on the derivatives of the objective function often yield poor results. Alternatively, the present nature-inspired optimization approaches may replace the traditional gradient-based ones and give new perspectives in the optimization studies of industrial enzyme production.
Conclusions
This work tested an alternative parameter estimation strategy using two population-based stochastic optimization algorithms, namely PSO and GA. Different growth models were investigated in order to establish the most adequate one to describe the bioprocess dynamics. The hybrid GA/PSO technique was successfully used here for parameter estimation of the models. The results proved that hybrid GA/PSO is a good and often superior technique for parameter estimation problem in the studied biological models by fitting the simulation data with the corresponding experimental measurements. A comparison of the proposed hybrid GA/PSO algorithm with conventional GA and conventional PSO was also made. The results revealed that combination of these two meta-heuristic algorithms speeds up the search (twice, in comparison to conventional GA and conventional PSO) to locate a better solution.
Symbols
| f | = | feed rate (L/h) |
| k | = | saturation constant for product (g/L) |
| kd | = | decay rate or death constant for biomass (h−l) |
| kI,S | = | substrate-inhibition constant (g/L) |
| kP | = | product decomposition rate (h−1) |
| kS | = | saturation constant (g/L) |
| kX | = | Contois saturation constant (g/L) |
| ms | = | maintenance coefficient (g) |
| n | = | exponential term for Moser model |
| P | = | product concentration (g/L) |
| S | = | substrate concentration (g/L) |
| S0 | = | initial substrate concentration (g/L) |
| V | = | reactor volume (L) |
| X | = | cell mass concentration (g/L) |
| YX/S | = | yield of biomass per unit mass of substrate (g/g) |
| α | = | product yield parameter (g/g) |
| μ | = | specific growth rate (h−1) |
| μmax | = | maximum specific growth rate (h−1) |
Acknowledgements
The authors would like to express their profound gratitude to Keyvan Bolouri (Department of Industrial Engineering, Science and Research Branch, Islamic Azad University, Tehran, Iran) for his invaluable guidance and helpful comments.
Disclosure statement
No potential conflict of interest was reported by the authors.
References
- Jellouli K, Ghorbel-Bellaaj O, Ben Ayed H, et al. Alkaline-protease from Bacillus licheniformis MP1: purification, characterization and potential application as a detergent additive and for shrimp waste deproteinization. Process Biochem. 2011;46:1248–1256.
- Patel RK, Dodia MS, Joshi RH, et al. Purification and characterization of alkaline protease from a newly isolated haloalkaliphilic Bacillus sp. Process Biochem. 2006;41:2002–2009.
- Al-Askar AA, Rashad YM, Hafez EE, et al. Characterization of alkaline protease produced by Streptomyces griseorubens E44G and its possibility for controlling Rhizoctonia root rot disease of corn. Biotechnol Biotechnol Equip. 2015;29:457–462.
- Potumarthi R, Ch S, Jetty A. Alkaline protease production by submerged fermentation in stirred tank reactor using Bacillus licheniformis NCIM-2042: effect of aeration and agitation regimes. Biochem Eng J. 2007;34:185–192.
- Subba Rao Ch, Sathish T, Mahalaxmi M, et al. Modelling and optimization of fermentation factors for enhancement of alkaline protease production by isolated Bacillus circulans using feed-forward neural network and genetic algorithm. J Appl Microbiol. 2008;104:889–898.
- Amenaghawon NA, Okieimen CO, Ogbeide SE. Kinetic modelling of ethanol inhibition during alcohol fermentation of corn stover using Saccharomyces cerevisiae. Int J Eng Res Appl. 2012;2:798–803.
- Kelley CT. Iterative methods for optimization. Philadelphia (PA): SIAM; 1999.
- Calcada D, Rosa A, Duarte LC, et al. Comparison of GA and PSO performance in parameter estimation of microbial growth models: a case-study using experimental data. IEEE Congress on Evolutionary Computation (CEC). Proceedings; 2010 Jul 18; Barcelona. Spain: IEEE Press; 2010. doi:10.1109/CEC.2010.5586489
- Calcada D. Modeling of the physiology of D. hansenii using population-based search methods for parameter estimation [dissertation]. Lisbon: Technical University of Lisbon; 2009.
- Holland J. Adaptation in natural and artificial systems. Ann Arbor (MI): The University of Michigan Press; 1975.
- Angelova M, Pencheva T. Tuning genetic algorithm parameters to improve convergence time. Int J Chem Eng. 2011; Article ID 646917. Available from: http://dx.doi.org/10.1155/2011/646917
- Jantschi L, Bolboaca SD, Sestras RE. Hard problems in gene sequence analysis: classical approaches and suitability of genetic algorithms. Biotechnol Biotechnol Equip. 2009;23:1275–1280.
- Sun J, Garibaldi JM, Hodgman C. Parameter estimation using metaheuristics in systems biology: a comprehensive review. IEEE/ACM Trans Comput Biol Bioinform. 2012;9:185–202.
- Kennedy J, Eberhart RC. Particle swarm optimization. Proceedings of IEEE International Conference on Neural Networks; 1995; Piscataway. p. 1942–1948.
- Tang J, Yan J, Yuan J, et al. Parameter estimation of beta distribution based on PSO and application in mission reliability analysis. J Comput Inform Syst. 2012;8:3839–3849.
- Lazinica A. Particle swarm optimization. Vienna: In-Tech; 2009.
- Bouaoudat BD, Yalaoui F, Amodeo L, et al. Efficient developments in modeling and optimization of solid state fermentation. Biotechnol Biotechnol Equip. 2012;26:3443–3450.
- Younes M, Benhamida F. Genetic algorithm-particle swarm optimization (GA-PSO) for economic load dispatch. Przegląd Elektrotech. 2011;87:369–372.
- Kaveh A, Malakouti Rad S. Hybrid genetic algorithm and particle swarm optimization for the force method-based simultaneous analysis and design. Iran J Sci Technol. 2010;34:15–34.
- Rivera EC, Costa AC, Atala DI, et al. Evaluation of optimization techniques for parameter estimation: application to ethanol fermentation considering the effect of temperature. Process Biochem. 2006;41:1682–1687.
- Skolpap W, Nuchprayoon S, Scharer JM, et al. Fed-batch optimization of α-amylase and protease-producing Bacillus subtilis using genetic algorithm and particle swarm optimization. Chem Eng Sci. 2008;63:4090–4099.
- Abdullah A, Deris S, Mohamad MS, et al. A new particle swarm evolutionary optimization for parameter estimation of biological models. Int J Comput Inform Syst Ind Manage Appl. 2013;5:571–580.
- Benjamin KK, Emmanuel AN, David A, et al. Genetic algorithms using for a batch fermentation process identification. Appl Sci. 2008;8:2272–2278.
- Dutta JR, Dutta PK, Banerjee R. Modeling and optimization of protease production by a newly isolated Pseudomonas sp. using a genetic algorithm. Process Biochem. 2005;40:879–884.
- Anvari M, Khayati G. Production and characterization of alkaline protease from Bacillus licheniformis sp. isolated from Iranian northern soils with ram horn hydrolysate. Trends Appl Sci Res. 2011;6:1206–1213.
- Anvari M, Khayati G. In situ recovery of 2,3-butanediol from fermentation by liquid–liquid extraction. J Ind Microbiol Biotechnol. 2009;36:313–317.
- Miller GL. Use of dinitrosalycilic acid reagent for determination of reducing sugars. Anal Chem. 1959;31:426–430.
- Meyers SP, Ahearn DG. Extracellular proteolysis by Candida lipolytica. Mycologia. 1977;69:646–651.
- Choi M, Al-Zahrani SM, Lee SY. Kinetic model-based feed-forward controlled fed-batch fermentation of Lactobacillus rhamnosus for the production of lactic acid from Arabic date juice. Bioprocess Biosyst Eng. 2014;37:1007–1015.
- Lendenmann U, Snozzi M, Egli T. Growth kinetics of Escherichia coli with galactose and several other sugars in carbon-limited chemostat culture. Can J Microbiol. 2000;46:72–80.
- Annuar MSM, Tan IKP, Ibrahim S, et al. A kinetic model for growth and biosynthesis of medium-chain-length poly-(3-hydroxyalkanoates) in Pseudomonas putida. Braz J Chem Eng. 2008;25:217–228.
- Agarry SE, Solomon BO, Audu TOK. Substrate utilization and inhibition kinetics: batch degradation of phenol by indigenous monoculture of Pseudomonas aeruginosa. Int J Biotechnol Mol Biol Res. 2010;1:22–30.
- Raquel CR, Naval PC. An effective use of crowding distance in multiobjective particle swarm optimization. In: Beyer HG, editor. Genetic and evolutionary computation conference (GECCO 2005). Proceedings; 2005 Jun 25. New York (NY): ACM Press; 2005. p. 257–264.