
ABSTRACT
In this study, 10 pear genotypes (İncir, Bal, Nene, Kabak, Banda, Kırmızı, İmlahor, Baraka, Limon and Güğüm), which grow in the Ardahan region, were evaluated for their total phenolic content, total anthocyanin content, brix°, pH, titratable acidity, total ascorbic acid content and antioxidant activity. According to the results, the pear genotypes used in this study had a high brix˚ content, high phenolic, anthocyanin and ascorbic acid contents, as well as high antioxidant activity. It was determined that ‘Bal’ pear had the highest total phenolic content and antioxidant activity. In ‘Nene’ and ‘Incir’ pears, the quantity of ascorbic acid and anthocyanin, as well as the antioxidant activity were less than those in the other genotypes. Correlations between brix° and pH, acidity and pH, peel phenolic content and flesh phenolic content, flesh ascorbic acid content and peel phenolic content, peel antioxidant activity and flesh phenolic content, were found to be significant. As a conclusion, due to the high levels of antioxidants and other bioactive compounds in pears, it is suggested to consume those fruits, especially with their peels. The results from this study will provide new insights into farming, fresh fruit consumption, industrial food processing and future research studies.
Introductıon
Pear is an important type of fruit, which is grown in Torrid Zones.[Citation1] China is in the first place of pear farming with its 60% share of the pear production in the world.[Citation2] According to 2012 data, Turkey's annual pear production is 387,345 tons.[Citation3] Pear, which is native to Anatolia, Caucasia and Central Asia, has nearly 600 types in our country. In Ardahan region, 38 tons of pears are produced annually in a 34 daa area. However, this amount of pear production provides limited economic profit to farmers compared to other agricultural products in the region.
Fruits, like pear, are important nutritions as carbohydrate sources. They contain approximately 54% fructose, 18% sorbitol, 15% sucrose, 13% glucose, low protein (0.5%) and lipid (0.3%) contents and high incidence of fibre (15–28 g/kg). These rates are suitable for diabetic and obese patients.[Citation4,Citation5] Pear contains more fibre than many other fruits.[Citation6] In addition to the high level of carbohydrate and fibre, it contains other important nutritional elements, such as vitamins, minerals, anthocyanins and phenolic contents.[Citation7] Phenolic compounds have a significant importance in the resistance to mechanical and biological stress. They also have a great importance due to the presence of pharmacological characteristics and factors which reveal the quality of the fruit, such as flavour, colour, soreness and acidity.[Citation8] Other previously performed studies showed that fruit consumption reduces the risk of chronic diseases such as cancer and diabetes, as well as cardiovascular and nerve diseases.[Citation9–12] It is stated that the antioxidant effect of phenolic compounds within fruits and vegetables reduces the disease risk.[Citation13] Therefore, consumption of nourishments containing phenolic compounds is essential.[Citation14]
In the human body, free radicals, such as H2O2, can occur due to various reasons.[Citation15] Free radicals may occur because of two reasons: internal sources, such as ageing and nutrition metabolism, and external sources, such as air pollution.[Citation16,Citation17] It is known that these free radicals can be inactivated by phenolic compounds with antioxidant activity, such as ascorbic acid, vitamin E, carotenoids and anthocyanins.[Citation18] Another antioxidant, which is nonenzymatic, is ascorbic acid and it has a great importance in the detoxification of reactive oxygen species.[Citation19] It is seen that in pear tissues, in which oxidative harm occurs, browning is seen due to the presence of ascorbic acid destruction.[Citation20,Citation21] Ascorbic acid participates in the prevention of plant diseases, browning and decay of the fruits.[Citation22,Citation23] The aim of the present study was to find out the nutritional value and to determine the bioactive compounds in pear genotypes growing in the Ardahan region.
Materials and methods
Fruit samples
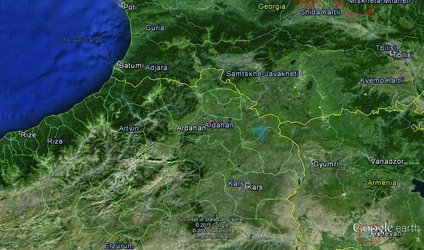
Fruit samples of 10 genotypes (İncir, Bal, Nene, Kabak, Banda, Kırmızı, İmlahor, Baraka, Limon and Güğüm) were harvested at optimum maturity periods (at the beginning of the fourth week of September) from the Ardahan region (). The samples were stored at 4 °C in a refrigerator. In every genotype, brix°, pH, titratable acidity, total phenolic, total anthocyanin and ascorbic acid contents, as well as total antioxidant activity, were analysed. The productivity was also determined. Sensory evaluations on fruit aroma, colour of the flesh and peels were carried out. The measurements were performed in triplicate.
Figure 1. Location of the Ardahan region.
Map data: US Dept of State Geographer © 2015 Google © 2015 Basarsoft Image Landsat.
Fruit weight, brix°, pH and titratable acidity
For each genotype, the weight of 10 fruits was measured in grams (g). Fruit samples were scaled on digital scales with an accuracy of 0.05 g. Brix° of fruits was determined at 22 °C with Mettler Toledo 30 P digital refractometer (Mettler-Toledo International Inc., Switzerland) in percentages (%). The acidity percentages were determined by using a titrimetric method according to Cemeroğlu.[Citation24] Purified water (90 mL) was added to 10 mL fruit juice, and it was titrated with 0.1 mol/L sodium hydroxide (NaOH) until the pH level reached 8.1. The obtained titratable acidity was calculated in terms of malic acid in percentages (%).
Total anthocyanin, total phenolic and ascorbic acid contents
Determination of total anthocyanin content of the fruit peel was made by using the method, described by Giusti and Wrolstad.[Citation25] Fruit peel (5 g) was homogenized in 10 mL methanol solution containing 1% (v/v) HCl for two minutes. After keeping for a night, it was filtered with Whatman No. 2 filter paper. The samples' absorption was measured by using a spectrophotometer (Unico S1205) at a wavelength of 530 nm. The anthocyanin content was measured by using molar absorptivity of cyanide-3-glucoside. Results were expressed as milligrams of total anthocyanin per 100 grams of fruit peel sample (mg/100 g).
The total phenolic compound content of the fruit peel and flesh was determined by using Folin–Ciocalteu method.[Citation26] After 14 g of fruit sample (separately for fruit peel and fruit flesh) was homogenized with 40 mL ethanol, it was centrifuged at 6000g for 3 min. Folin–Ciocalteu reagent with a quantity of 1000 µL (1/10 diluted) and 800 µL (7.5%) Na2CO3 were added to 200 µL supernatant. After incubating for 2 h at room temperature, the mixture was measured at 750 nm in a spectrophotometer against 50% ethanol–water mixture. The total amount of samples' phenolic compound was measured by using gallic acid standard. The results were expressed as milligrams of total phenolic content per 100 grams of fruit peel or flesh sample (mg/100 g).
Determination of the ascorbic acid content was made by using a spectrophotometric method.[Citation27] Fruit sample (5 g) was homogenized in 50 mL purified water and centrifuged at 4000g for 5 min. Supernatant (100 μL) was obtained and mixed with 400 μL 0.4% (v/v) oxalic acid and 4.5 mL 2,6-dichlorophenolindophenol solution, and then measured at a wavelength of 520 nm in a spectrophotometer. The amount of ascorbic acid in fruits was measured by using a calibration chart. Results were expressed as milligrams of ascorbic acid content per 100 grams of fruit flesh sample (mg/100 g).
Antioxidant activity
The antioxidant activity of the fruit peel and flesh was determined according to 2,2-diphenyl-1-picrylhydrazyl (DPPH) scavenging factor. Tissue sample (2 g) was homogenized by mixing with 2 mL extraction solution (85% methanol, 15% acetic acid) and incubated for 24 h at 4 °C. After this, it was centrifuged at 11,952g for 10 min. DPPH solution (950 µL, 0.1 mol/L) was mixed with 50 µL extract, diluted separately from the fruit flesh and peel. The solution was left for 30 min in a shaker at room temperature in the dark. Afterwards, samples were measured at a standard wavelength of 515 nm with a spectrophotometer. For each sample, fruit flesh and peel were measured separately. The antioxidant activity was measured with the following equation: %DPPH radical scavenging = (Absorbancecontrol–Absorbancesample)/Absorbancecontrol × 100.[Citation28,Citation29] The control was containing all reagents without the sample.
Data analyses
In this study, all analyses were performed in triplicate, and during the evaluation of the obtained data, SPSS 15.0 statistical analysis packaged software was used. Differences among groups were determined with Duncan's multiple comparison tests and were considered significant at p < 0.05. Analysis of relationships between variables was carried out using Pearson's correlation test on data sets. Cluster analyses were applied for determination of the distance between genotypes.
Results and discussion
Ten different pear genotypes were detected in Ardahan. It was determined that one of the genotypes, ‘Banda’ pear, belonged to Pyrus salicifolia, whereas the other genotypes belonged to Pyrus communis species. Fruit weight, brix°, pH, degree of acidity and some pomological features of the genotypes are described in . Statistically significant differences among different genotypes of these parameters were found (p < 0.05).
Table 1. Fruit weight, brix°, pH, acidity and some pomological features of pear genotypes.
The occurrence of fruit peel colour, such as green, yellow and brown, is determined by factors like genetic, phenolic and flavonoid contents.[Citation30] In the study, green, yellow and brown peel colours were observed. In some genotypes, red and orange marks were observed on the peel. It was indicated that the weight of the pear genotypes varied from 282 g (‘Güğüm’ pear) to 53 g (‘Banda’ pear). According to a study conducted in Iran on 10 different pear types, the weight of the fruit was the highest in ‘Latanz’ type (171 g) and the lowest in ‘Arbakhoj’ type of pear (50.7 g).[Citation29]
The amount of brix° and acid in fruits is an indicator of flavour.[Citation29] In our study, it was determined that ‘Bal’ pear had the highest amount of brix° (16%) and ‘Limon’ pear had the lowest amount of brix° (11%). Corresponding to the results of brix°, it was found that ‘Bal’ pear had the lowest amount of acidity (0.20%) and the highest pH value (5.50), and ‘Limon’ pear had the highest amount of acidity (0.59%) and the lowest pH value (3.84). Similar results were obtained by different researchers. Tanrioven and Eksi [Citation31] reported that brix° contents of pear types vary from 8.4% to 13.6%. They also reported that ‘Sugar’ type had the highest rate and ‘Starkrimson’ type had the lowest rate.[Citation31] In a previously conducted study, it was found that ‘Latanz’ had the highest brix° rate (13.44%), ‘Zizaling’ had the lowest one (8.83%), ‘Arbakhoj’ had the highest acidity rate (0.89%) and ‘Amrud’ had the lowest one (0.22%).[Citation29] Rahmatian et al. [Citation32] reported that in ‘Faevrit Daglas’ type, the total acidity rate was 0.75% and in ‘Shahmive’ type it was 0.18%. Chen et al. [Citation33] found out that the acidity levels of ‘Jingbai’ and ‘Kuerle Fragrant’ were 0.46% and 0.10%, respectively.
It can be seen from that pear genotypes contain anthocyanin, ascorbic acid and phenolic contents, as well as antioxidant compounds. Statistically significant differences among different genotypes were found (p < 0.05). The phenolic content differs in accordance with the fruit maturity. It increases during the first three months of fruit development and then it starts to decrease. The amount of phenolic content in the fruit depends on the type and maturity degree. The phenolic content is higher in immature plants.[Citation31] In the present study, it was determined that the amount of phenolic content in peels was the highest in ‘Bal’ pear (687.2 mg/100 g) and in ‘Limon’ pear (650.3 mg/100 g), and the lowest amount was in ‘Nene’ pear (300.1 mg/100 g) and in ‘İncir’ pear (342.3 mg/100 g). Correspondingly, it was found that the total phenolic content in the fruit flesh was the highest in ‘Bal’ pear (300 mg/100 g) and in ‘Limon’ pear (230.5 mg/100 g) and the lowest content was found in ‘Nene’ pear (112.6 mg/100 g) and in ‘İncir’ pear (115.9 mg/100 g). Results similar to ours were also discovered by other researchers.[Citation31,Citation34] Chong et al. [Citation35] found out that the total phenolic content in the fruit flesh was 231.7 mg/100 g. In some pear peels grown in Iran, the total phenolic content was found to be between 261.13 and 135.17 mg/100 g.[Citation29] The total phenolic content was the highest in ‘Abkhoj’ and the lowest in ‘Khoj Babaei’. It was reported that the total phenolic content in fruit flesh was between 10.06 and 30.11 mg/100 g. The highest phenolic content was reported in ‘Khoj Babaei’ and the lowest one was reported in ‘Arbakhoj’.[Citation29] It was found that in ‘Nakh’ and ‘Naspati’ pear types, the total phenolic content of the fruit peel was between 601 and 619 mg/100 g, and that of the fruit flesh was between 333 and 355 mg/100 g.[Citation36] The amount of the phenolic content in plant tissues is affected by environmental conditions, such as ultraviolet light, heat and nutrition.[Citation37–40] Because pear fruits have phenolic contents, they are strong antioxidant sources and have medical features; tumours, inflammations and most of the allergic diseases can be prevented by them.[Citation41,Citation42]
Table 2. Antioxidant activity and anthocyanin, ascorbic acid and total phenolic contents of pear genotypes.
Ascorbic acid, which is in abundance in plant cells, has many biological functions. As an antioxidant, it protects plants from oxidative harm derived from internal factors, such as respiration and photosynthesis metabolism, or from external factors, such as environmental pollution.[Citation43] In the present study, it was identified that ascorbic acid contents were the highest in ‘Banda’ pear (10.2 mg/100 g) and in ‘Limon’ pear (10.1 mg/100 g), and lowest in ‘İncir’ pear (4.4 mg/100 g). Like other biochemical components, the ascorbic acid concentration in fruits differs, depending on the growth conditions, such as light and heat.[Citation44,Citation45] It was reported that ascorbic acid content in pear tissues after the harvest was 7.2 mg/100 g.[Citation46] However, after a storage of 199 d in controllable atmosphere conditions, it decreased to 2.3 mg/100 g.[Citation46] Similarly, it was indicated that in six varieties of pears, the amount of ascorbic acid was between 2.6 and 5.3 mg/100 g.[Citation47]
The red colour in pears originates from the presence of anthocyanin. Alongside the anthocyanin in fruits, there are also chlorophyll and carotenoids. The colour of the fruit changes according to the concentrations of these pigments and the interactions between them.[Citation48–61] The synthesis of anthocyanin in pears is affected especially by environmental factors, such as light and heat.[Citation52–54] In our study, the highest level of anthocyanin in pear peels was found in ‘Kırmızı’ pear (20.2 mg/100 g) and the lowest one was found in ‘İncir’ pear genotype (1.4 mg/100 g). In a study, conducted in China, it was reported that the amount of anthocyanin in pear types was 10 mg/100 g.[Citation55] In another study, it was reported that it was 8.95 mg/100 g.[Citation34] Steyn et al. [Citation53,Citation54] indicated that the low temperature increases the anthocyanin abundance, and the high temperature decreases it in European pear cultivars. In our study, the obtained average anthocyanin rate was higher than that in other studies. This can be associated with the low temperatures of the Ardahan region.
Fruits and fruit products are rich sources of antioxidants.[Citation56] It is known that some nutrition ingredients found in fruits, such as carotenoids, vitamin C, vitamin E, phenolic components, ascorbic acid and anthocyanin, have an antioxidant activity.[Citation18] Phenolic contents in fruits have an effect as free radical scavengers, especially for DPPH radicals.[Citation57] According to the analyses, it was determined that ‘İncir’ pear's fruit flesh (25.6%) and fruit peel (20.2%) had the lowest antioxidant activity among the genotypes. ‘Bal’ pear's fruit flesh (55.4%) and fruit peel (65.3%) had the highest antioxidant activity among the studied genotypes. Rezaeirad et al. [Citation29] reported that in pear's peels, the antioxidant activity was the highest in ‘Amrud’ (67.6%) and lowest in ‘Rashtehkhoj’ (64.3%). In the fruit flesh, the antioxidant activity was the highest in ‘Zizaling’ (73.6%) and lowest in ‘Amrud’ (42.2%).[Citation29] Manzoor et al. [Citation36] observed that the antioxidant activity in the fruit peel was 50% and it was 29% in the fruit flesh. There is a report that when the antioxidant activity increases, the resistance, quality and storage endurance of genotypes also increase.[Citation58]
Cluster analysis
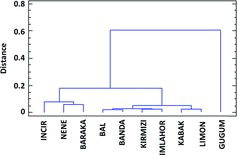
Cluster analysis was performed for the determination of the relationship between variables and was presented as a dendrogram. Eleven parameters (fruit weight, brix˚, acidity, pH, productivity, total phenolic content of the peel and flesh, ascorbic acid content of the flesh, total antioxidant activity of the peel and flesh, and total anthocyanin content of the peel) were clustered in the dendrogram (). The cluster analysis identified three main clusters of pear varieties. There were 1, 6 and 3 genotypes distributed in three clusters. This result indicated that there was a significant difference between the evaluated genotypes for pomological and biochemical traits. Cluster 1 included Güğüm pear. Cluster 2 included Limon, Kabak, İmlahor, Kırmızı, Banda, Bal pears and cluster 3 included İncir, Nene and Baraka pears. The first group had the highest fruit weight. The second group had the highest peel and flesh phenolic contents. The third group had the lowest peel and flesh phenolic contents.
Figure 2. Dendrogram of pear varieties according to their pomological and biochemical properties.
Pearson's correlation analysis
Correlations between pomological and biochemical traits were also observed (). There were no correlations between anthocyanin, productivity and other fruit quality attributes. Correlations between brix° and pH, fruit weight and pH, pH and acidity were found to be significant. In general, fruit weight was positively correlated with pH.[Citation59,Citation60] Negative significant correlations were also observed between pH and acidity. Viana et al. [Citation61] also found a negative correlation between pH and titratable acidity (r = −0.756). pH was positively correlated with brix° and these parameters increased with fruit ripening.[Citation62,Citation63] This increase in the brix° also increases the perceived fruit sweetness, thereby strongly influencing the fruit taste.[Citation64]
Table 3. Pearson's correlation coefficients between pomological and biochemical traits.
In the present study, flesh ascorbic acid content and peel–flesh phenolic content, peel–flesh antioxidant activity and flesh phenolic content, peel phenolic content and flesh phenolic content were found significantly correlated. Koh et al. [Citation65] found that total phenolics correlated positively and highly with ascorbic acid content (r = 0.608). Similar to our research, different research studies found the positive linear correlation between antioxidant activity and total phenolic content and between total phenolic content and ascorbic acid content.[Citation66,Citation67]
Conclusions
As a consequence of this study, it was concluded that pear genotypes growing in the ecological conditions of Ardahan are rich in phenolic substances, anthocyanin and ascorbic acid contents, and have a high antioxidant activity. The highest amount of phenolic substances and the highest antioxidant activity were observed in the ‘Bal’ variety of pears. There was a higher content of phenolic substances and antioxidant activity in the pear genotypes' peels than in their flesh. Consumption of pear fruit, containing rich bioactive compounds, in a balanced diet will be helpful in protecting the body from harmful oxygen radicals. Moreover, it is also suggested that fruits should be consumed with their peels, because it is thought that the antioxidant activity that they have is effective in protecting the health and preventing diseases.
Disclosure statement
No potential conflict of interest was reported by the authors.
Additional information
Funding
References
- Hudina M, Stampar F. Sugars and organic acids contents of European (Pyrus communis L) and Asian (Pyrus serotina Rehd.) pear cultivars. Acta Aliment. 2000;29:217–230.
- Teng YW, Chai M, Li X. A historic retrospect and the progress in the taxonomy of the genus Pyrus. J Fruit Sci. 2004;21:252–257.
- Turkish Statistical Institute (TSI): Agricultural production statistics [Internet]. Ankara: Turkish Statistical Institute; 2012 [cited 2015 Jun 15]. Available from: http://www.turkstat.gov.tr/Start.do
- Blattny C. Pears. In: Caballero B, Trugo LC, Finglas PM, editors. Encyclopedia of food sciences and nutrition. London: Academic Press; 2003. p. 4428–4433.
- Senser F, Scherz H, Munchen G. Tablas de Composicio´n de Alimentos [Food Composition Tables]. Zaragoza: Editorial Acribia; 1999.
- McKee LH, Latner TA. Underutilized sources of dietary fiber: a review. Plant Food Hum Nutr. 2000;55:285–304.
- Silos-Espino H, Fabian-Morales L, Osuna-Castro JA, et al. Chemical and biochemical changes in prickly pears with different ripening behaviour. Nahrung/Food. 2003;47:334–338.
- Macheix JJ, Fleuriet A, Billot J. Fruit phenolics. Boca Raton: CRC Press; 1990.
- Boeing H, Bechtold A, Bub A, et al. Critical review: vegetables and fruit in the prevention of chronic diseases. Eur J Clin Nutr. 2012;6:637–663.
- Jenkins DJ, Wong JM, Kendall CW, et al. The effect of a plant-based lowcarbohydrate (“Eco-Atkins”) diet on body weight and blood lipid concentrations in hyperlipidemic subjects. Arch Intern Med. 2009;169:1046–1054.
- Esposito K, Marfella R, Ciotola M, et al. Effect of a mediterranean-style diet on endothelial dysfunction and markers of vascular inflammation in the metabolic syndrome. JAMA. 2004;292:1440–1446.
- Elmer PJ, Obarzanek E, Vollmer WM, et al. Effects of comprehensive lifestyle modification on diet, weight, physical fitness, and blood pressure control: 18-month results of a randomized trial. Ann Intern Med. 2006;144:485–495.
- Gorinstein S, Martin-Belloso O, Lojek A, et al. Comparative content of some phytochemicals in Spanish apples, peaches and pears. J Sci Food Agr. 2002;82:1166–1170.
- Galvis Sanchez AC, Gil-Izquierdo A, Gil MI. Comparative study of six pear cultivars in terms of their phenolic and ascorbic acid contents and antioxidant capacity. J Sci Food Agr. 2003;83:995–1003.
- Foyer C, Lopez-Delgado H, Dat JF, et al. Hydrogen peroxide and glutathione-associated mechanisms of acclimatory stress tolerance and signaling. Physiol Plantarum. 1997;100:241–254.
- Elsayed NM. Antioxidant mobilization in response to oxidative stress: a dynamic environmental nutrition intervention. Nutrition. 2001;17:828–834.
- Lachance PA, Nakat Z, Jeong W. Antioxidants: an integrative approach. Nutrition. 2001;17:835–838.
- Pinelo M, Manzocco L, Nunez MJ, et al. Interaction among phenols in food fortification: negative synergism on antioxidant capacity. J Agr Food Chem. 2004;52:1177–1180.
- Foyer CH, Lelandais M, Edwards EA, et al. The role of ascorbate in plants, interactions with photosynthesis, and regulatory significance. In: Pell E, Steffen K, editors. Active oxygen/oxidative stress and plant metabolism. Rockville (MD): American Society of Plant Physiologists; 1991. p. 131–144.
- Lentheric I, Pinto E, Vendrell M, et al. Harvest date affects the antioxidative systems in pear fruits. J Hortic Sci Biotech. 1999;74:791–795.
- Veltman RH, Kho Van RM, Schaik ACR, et al. Ascorbic acid and tissure browning in pears (Pyrus communis L., cvs Rocha and Conference) under controlled atmosphere conditions. Postharvest Biol Tech. 2000;19:129–137.
- Davey MW, Van Montagu M, Inze D, et al. Plant L-ascorbic acid chemistry, function, metabolism, bioavailability and effects of processing. J Sci Food Agr. 2000;89:825–860.
- Lee Sk, Kader AA. Preharvest and postharvest factors influencing vitamin C content of horticultural crops. Postharvest Biol Tech. 2000;20:207–220.
- Cemeroğlu B. Meyve ve sebze işleme endüstrisinde temel analiz metotları [Fundamental analysis methods in fruit and vegetable processing industry]. Ankara: Biltav Press; 1992. Turkish.
- Giusti MM, Wrolstad RE. Anthocyanins characterization and measurement with UV visible spectroscopy. In: Wrolstad RE, editor. Current protocols in food analytical chemistry. New York (NY): Wiley; 2001. p. 1–13.
- Spanos GA, Wrolstad RE. Wrolstad, phenolic of apple, pear and white grape juices and their changes with processing and storage. J Agr Food Chem. 1992;40:1478–1487.
- Şahin G. Effect of deep freezing and air drying on some quality characteristics of rose hip fruits [MSc thesis]. Tokat (TR): Gaziosmanpaşa University; 2013.
- Bakhshi D, Arakawa O. Effects of UV-B irradiation on phenolic compound accumulation and antioxidant activity in ‘Jonathan’ apple influenced by bagging, temperature and maturation. J Food Agr Environ. 2006;4:75–79.
- Rezaeirad D, Bakhshi D, Ghasemnezhad M, et al. Evaluation of some quantitative and qualitative characteristics of local pears (Pyrus sp.) in the north of Iran. J Agr Crop Sci. 2013;5:882–887.
- Awad MA, Dejager A. Relationship between fruit nutrients and concentrations of flavonoids and chlorogenic acid in ‘Elstar’ apple skin. Sci Hortic. 2002;92:265–270.
- Tanrioven D, Eksi A. Phenolic compounds in pear juice from different cultivars. Food Chem. 2005;93:89–93.
- Rahmatian A, Talaei A, Momenpor A, et al. Evaluation of qualitative and quantitative characteristics of five cultivars of pear fruit in the climatic conditions of Karaj. Paper presented at: Iranian Horticultural Science Congress. 6th Congress; 2009 Jul 2–15; Rasht, IR.
- Chen JZ, Wang Wu J, Wang Q, et al. Chemical compositional characterization of eight pear cultivars grown in China. Food Chem. 2007;104:268–275.
- Huang C, Yu B, Teng Y, et al. Effects of fruit bagging on coloring and related physiology, and qualities of red Chinese and pears during fruit maturation. Sci Hortic. 2009;121:149–158.
- Chong CH, Law CL, Figiel A, et al. Colour, phenolic content and antioxidant capacity of some fruits dehydrated by a combination of different methods. Food Chem. 2013;141:3889–3896.
- Manzoor M, Anwar F, Bhatti IA, et al. Variation of phenolics and antioxidant activity between peel and pulp parts of pear (Pyrus communis L.) fruit. Pak J Bot. 2013;45:1521–1525.
- Markham KR, Ryan KG, Bloor SJ, et al. An increase in luteolin-apigenin ratio in Marchantia polymorpha on UV-B enhancement. Phytochemistry. 1998;48:791–794.
- Markham KR, Tanner GJ, Caasi-Lit M, et al. Protective role for 30,40-dihydroxyflavones induced by UV-B in a tolerant rice cultivar. Phytochemistry. 1998;49:1913–1919.
- Rivero R, Ruiz J, Garcia PC, et al. Resistance to cold and heat stress: accumulation of phenolic compounds in tomato and in watermelon plants. Plant Sci. 2001;160:315–321.
- Ruehmann S, Leser C, Bannert M, et al. Relationship between growth, secondary metabolism, and resistance of apple. Plant Biol. 2002;4:137–143.
- Triantis T, Stelakis A, Dimotikali D, et al. Investigations on the antioxidant activity of fruit and vegetable aqueous extracts on superoxide radical anion using chemiluminescence techniques. Anal Chim Acta. 2005;536:101–105.
- Salta J, Martins A, Santos RG, et al. Phenolic composition and antioxidant activity of Rocha pear and other pear cultivars – a comparative study. J Funct Foods. 2010;2:111–115.
- Smirnoff N. The function and metabolism of ascorbic acid in plants. Ann Bot. 1996;78:661–669.
- Nagy S. Vitamin C contents of citrus fruit and their products: a review. J Agr Food Chem. 1980;28:8–18.
- Klein BP, Perry AK. Ascorbic acid and vitamin A activity in selected vegetables from different geographical areas of the United States. J Food Sci. 1982;47:941–945.
- Veltman RH, Sanders MG, Persijin ST, et al. Decreased ascorbic acid levels and Brown core development in pears (Pyrus communis L. cv Conference). Physiol Plantarum. 1999;107:39–45.
- Sanchez-Moreno C, Plaza L, De Ancos B, et al. Quantitative bioactive compounds assessment and their relative contribution to the antioxidant capacity of commercial orange juices. J Sci Food Agr. 2003;83:430–439.
- Knee M. Anthocyanin, carotenoid, and chlorophyll changes in the peel of Cox's Orange Pippin apples during ripening on and off the tree. J Exp Bot. 1972;23:184–196.
- Saure MC. External control of anthocyanin formation in apple. Sci Hortic. 1990;42:181–218.
- Lancaster JE. Regulation of skin color in apples. Plant Sci. 1992;10:487–502
- Lancaster JE, Grant JE, Lister CE. Skin color in apples influence of copigmentation and plastid pigments on shade and darkness of red color in five genotypes. J Am Soc Hortic Sci. 1994;119:63–69.
- Dussi MC, Sugar D, Wrolstad RE. Characterizing and quantifying anthocyanins in red pears and effect of light quality on fruit color. J Am Soc Hortic Sci. 1995;120:785–789.
- Steyn WJ, Holcroft DM, Wand SJE, et al. Regulation of pear color development in relation to activity of flavonoid enzymes. J Am Soc Hortic Sci. 2004;129:6–12.
- Steyn WJ, Holcroft DM, Wand SJE, et al. Anthocyanin degradation in detached pome fruit with reference to preharvest red color loss and pigmentation patterns of blushed and fully red pears. J Am Soc Hortic Sci. 2004; 29:13–19.
- Yu B, Zhang D, Huang C, et al. Isolation of anthocyanin biosynthetic genes in red Chinese sand pear (Pyrus pyrifolia Nakai) and their expression as affected by organ/tissue, cultivar, bagging and fruit side. Sci Hortic. 2012;136:29–37.
- Imeh U, Khokhar S. Distribution of conjugates and free phenols in fruits: antioxidant activity and cultivar variations. J Agr Food Chem. 2002;50:6301–6306.
- Kıvrak I, Duru ME, Ozturk M, et al. Antioxidant, anticholinesterase and antimicrobial constituents from the essential oil and ethanol extract of Salvia potentillifolia. Food Chem. 2009;116:470–479.
- Lata B. Relationship between apple peel and the whole fruit antioxidant content: year and cultivar variation. J Agr Food Chem. 2007;55:663–671.
- Badanes ML, Martinez-Calvo J, Llacer G. Analysis of apricot germplasm from the European ecogeographical group. Euphytica. 1998;102:93–99.
- Asma BM, Ozturk K. Analysis of morphological, pomological and yield characteristics of some apricot germplasm in Turkey. Genet Res Crop Evol. 2005;52:305–313.
- Viana AP, Riaz S, Walker MA. Genetic dissection of agronomic traits within a segregating population of breeding table grapes. Genet Mol Res. 2013;12:951–964.
- Gautier H, Diakou-Verdin V, Benard C, et al. How does tomato quality (sugar, acid, and nutritional quality) vary with ripening stage, temperature, and irradiance? J Agr Food Chem. 2008;56:1241–1250.
- Fanizza G. Factor analyses for the choice of a criterion of wine grape (V.V.) maturity in warm regions. Vitis. 1982;21:334–336.
- Kingston CM. Maturity indices for apple and pear. Hortic Rev. 1991;13:407–432.
- Koh E, Wimalasiri KMS, Chassy AW, et al. Content of ascorbic acid, quercetin, kaempferol and total phenolics in commercial broccoli. J Food Compost Anal. 2009;22:637–643.
- Lachman J, Hamouz K, Sulc M, et al. Differences in phenolic content and antioxidant activity in yellow and purple-fleshed potatoes grown in the Czech Republic. Plant Soil Environ. 2008;54:1–6.
- Ahmed S, Beigh SH. Ascorbic acid, carotenoids, total phenolic content and antioxidant activity of various genotypes of Brassica Oleracea encephala. J Med Biol Sci. 2009;3:1–5.