
 ?Mathematical formulae have been encoded as MathML and are displayed in this HTML version using MathJax in order to improve their display. Uncheck the box to turn MathJax off. This feature requires Javascript. Click on a formula to zoom.
ABSTRACT
Ammonia oxidation is the first and rate-limiting step of nitrification and is carried out by ammonia-oxidizing bacteria (AOB). Ebinur Lake Wetland, the most representative temperate arid zone wetland ecosystem in China, is the centre of oasis and desertification of the northern slope of Tianshan conjugate. Soil samples were collected from three sites (Tamarix ramosissima, Halocnemum strobilaceum and Phragmites australis) and different soil layers (0–5, 5–15, 15–25 and 25–35 cm) in this wetland in spring, summer and autumn and were used to characterize the diversity of AOB based on the ammonia monooxygenase (amoA) gene. Polymerase chain reaction denaturing gradient gel electrophoresis (PCR-DGGE) and bivariate correlation analysis were used to analyse the relationship between the diversity of AOB and soil environment factors. The PCR-DGGE indicated that the diversity of AOB was high in the entire sample and the Shannon diversity index varied from 1.369 to 2.471. The phylogenetic analysis showed that the amoA fragments were grouped into Nitrosospira sp. and Nitrosomonas sp. Most amoA gene sequences fell within the Nitrosospira sp. cluster, and only a few sequences were clustered with Nitrosomonas sp., indicating that Nitrosospira sp. may be more adaptable than Nitrosomonas sp. in this area. Bivariate correlation analysis showed that the diversity of AOB was significantly correlated with soil organic matter, conductivity, total phosphorus and nitrate in the Ebinur Lake Wetland in Xinjiang.
Introduction
Nitrification, the microbial oxidation of ammonia to nitrate, is a key process in the global biogeochemical nitrogen cycle. Transformation of ammonia to nitrite is the first and rate-limiting step of nitrification, which is carried out by ammonia-oxidizing bacteria (AOB).[Citation1]
AOB represent the most active micro-organism population in nitrification, can utilize oxygen as a terminal electron acceptor and catalyse ammonia oxidation. Therefore, the diversity, abundance and distribution of AOB have been extensively studied in natural and engineered environments, such as deep-sea,[Citation2] biofilms [Citation3] and marine sediments.[Citation1,Citation4,Citation5] Molecular techniques have allowed to obtain reliable information on the diversity and community composition of AOB in various environments, and currently, 16S rRNA and amoA genes are universally used in diversity studies of AOB.[Citation6–9] In all known AOB, ammonia monooxygenase (AMO) is the key enzyme in the oxidation of ammonia to nitrite. This enzyme is composed of three subunits that are encoded by the amoC, amoA and amoB genes.[Citation10] The AMO subunit A contains the active site of AMO, which oxidizes ammonia to the intermediate hydroxylamine and generates energy for the oxidation reaction.[Citation11] Although the entire amoCAB can be studied molecularly, only a portion of the amoA gene has been used as a molecular marker to study the diversity of AOB.[Citation5] However, most published surveys have been conducted on marine water and sediments, whereas the diversity of AOB in the Ebinur Lake in Xinjiang is still poorly studied.
Ebinur Lake Wetland National Nature Reserve is the most representative temperate arid zone wetland ecosystem in China. It is the centre of oasis and desertification of the northern slope of the Tianshan conjugate.[Citation12] It has a key role in regulating the climate and maintaining the regional ecological balance.[Citation13] Because of its special geographic location, there is high species diversity. However, the research study on the diversity of species in Ebinur Lake Wetland is still in a primary stage. Since AOB play a critical role in the nitrogen (N) biogeochemical cycle, the aim of the present study was to evaluate the relationship between the diversity of AOB and soil environment factors in Ebinur Lake Wetland. Polymerase chain reaction denaturing gradient gel electrophoresis (PCR-DGGE) and bivariate correlation analysis were used to analyse this relationship. The obtained results lay the foundation for future restoration and reconstruction of the wetland ecological environment.
Materials and methods
Ethics statements
In this research study, samples were collected with the permission of Gao Xiang, Director of the Ebinur Lake Wetland National Nature Reserve administration in Xinjiang, and Xu Wei, Chief of the Ebinur Lake Wetland bird island station in Xinjiang.
Site description, sample collection and physicochemical characteristics analysis
Ebinur Lake Wetland National Nature Reserve is located in the north-west of Jinghe County in Xingjiang (82°36′–83°50′E, 44°30′–45°09′N), the south-west of Junggar Basin, which is the centre of the lowest depression and saltwater in this area [Citation12]. In this study, the rhizosphere soil of Tamarix ramosissima (S1), Halocnemum strobilaceum (S2) and Phragmites australis (S3) was sampled and five sample plots were chosen in each site in different soil layers (0–5, 5–15,15–25 and 25–35 cm). Samples were collected in August 2010, November 2010 and May 2011. More detailed description of the sampling sites in the Ebinur Lake Wetland is given in . The soil samples were put into sterile plastic bags and transported to the laboratory on ice. All samples were immediately stored at −20 °C after being collected until later use for molecular analysis. Soil acidity (pH), soil moisture (SM), electrical conductivity (EC), organic matter (OM), total nitrogen (TN), available nitrogen (AN), total phosphorus (TP), available phosphorus (AP), total potassium (TK), available potassium (AK), ammonium (NH4+-N) content and nitric nitrogen (NO3−-N) content were assayed as described by Malchair and Carnol.[Citation14]
Table 1. Basic description of sampling sites in the Ebinur Lake Wetland.
DNA extraction, PCR and DGGE
To improve the DNA extraction efficiency, a pre-lysis buffer washing step was introduced before the extraction procedure.[Citation15] TENP buffer (15 mL) was used: 50 mmol/L Tris, 20 mmol/L ethylenediaminetetraacetic acid disodium salt (EDTA·2Na), 100 mmol/L NaCl, 0.01 g/mL polyvinylpolypyrrolidone (PVPP), pH 10. The protocol of Nakamura [Citation16] was used for total genomic DNA extraction from 5.0 g freeze-dried soil. DNA extracts were kept at −20 °C until use. The purity and integrity of the extracted DNA samples were checked by 1% agarose gel electrophoresis.
The composition of AOB communities was assessed by PCR-DGGE. The amoA gene was amplified from genomic DNA by using a nested PCR approach. The first-round PCR was carried out with specific amoA PCR primers (amoA-1F and amoA-2R).[Citation9] First-stage PCR products were used as a template in second-round PCR. The second-round PCR was carried out with primers (amoA-1FGC: 5'-CGC CCG CCG CGC CCC GCG CCC GGC CCG CCG CCC CCG CCC CGG GGT TTC TAC TGG TGG T-3' and amoA-2R: 5'-CCC CTC KGS AAA GCC TTC TTC-3' (K = G/T, S = G/C)). DGGE was performed at 60 °C in 1 × TAE (Tris base, acetic acid and ethylenediaminetetraacetic acid) at 200 V for 5 h on a DCode™ gel system (Bio-Rad, CA, USA), using a 8% polyacrylamide gel with 30%–70% (M/V) gradient of urea formamide denaturant. Gels were stained as described by Bassam and Gresshoff [Citation17] and were visualized in an ultraviolet gel-imaging system.
Sequencing and phylogenetic analysis
Specific or common bands were excised from the gel, re-amplified under the conditions described for the first-round PCR and sequenced by Beijing Liuhe Genomics Technology Co., LTD (Beijing, China). The DNA sequences obtained were compared to sequences available in GenBank database using BLAST software (http://www.ncbi.nlm.nih/gov/blast/). The nucleotide sequences obtained in this study were deposited in the GeneBank database under accession numbers KT597977–KT597996 for AOB. The top-hit amoA gene sequences from GenBank were retrieved and all sequences were aligned using the Clustal X program.[Citation18] The phylogenetic tree was constructed using the neighbour-joining criterion [Citation19] of the MEGA 4 software [Citation20] with 1000 bootstrap tests.
Statistical analysis
DGGE patterns were handled with Quantity One® v. 4.62 software (Bio-Rad, CA, USA), which is used for analysing the number of AOB bands, mobility and greyscale in a digital quantitative way. Similarity matrices for clustering analysis were generated from pairwise comparison of banding patterns (presence/absence of bands) of all samples, using the Dice Coefficient (CD) as follows: CD = 2j/(a + b), where j is the number of bands in common between lanes A and B, a is the total number of bands in lane A and b is the total number of bands in lane B. Samples generating similar banding patterns were clustered by means of the unweighted pair group method with arithmetic averages (UPGMA), resulting in the construction of dendrograms. The diversity index (Shannon–Wiener, richness and evenness) was used in estimating the diversity of AOB. The diversity index (Shannon–Wiener, H) and (evenness, E) were calculated as follows:where S is the total number of bands in DGGE patterns and Pi is the ith band of dominance. Bivariate correlation analysis was used to assess the relationship between the diversity of the AOB community structure from DGGE patterns and environmental factors (pH, SM, EC, OM, TN, AN, TP, AP, TK, AK, NH4+-N and NO3−-N) by SPSS 16.0 software and Microsoft Excel 2007.
Results and discussion
Community structure of AOB in different soil layers and seasons in Ebinur Lake Wetland
Very few studies have focused on the diversity of ammonia-oxidizing bacteria in Ebinur Lake Wetland, where the area is saline and is characterized with instability and sensibility. This study revealed the presence of the bacterial amoA gene in a desert wetland ecosystem in different seasons. shows the DGGE profiling of AOB. Using DGGE, 36 PCR products derived from different soil layers and different seasons in three sites were separated. As seen from , there were some differences in the AOB diversity. The diversity of AOB in the summer is shown in (A). Although there was again some divergence in the community structure of AOB in the summer, band 7 was observed in all lanes ( (A-b)). The maximum number of bands was observed in lane A9, and the least number of bands in lanes A6 and A8 ( (A-a)). Bands 13 and 14 ( (A-b)) were observed only in lanes A11 and A12 ( (A-b)) and band 2 was observed only in lane A9,which indicated that there were differences in the soil at these sites in the summer. The diversity of AOB in the autumn is shown in (B). In this set of samples, there were again some differences in the number, mobility and intensity of bands in each lane, but band 6 ( (B-b)) was detected in all lanes. The maximum number of bands was observed in lanes B5 and B9, and the least number of bands in lanes B6 and B8 ( (B-a)). Band 11 ( (B-b)) was only observed in lanes B11 and B12 ( (B-a)). In other words, band 11 was only identified in the sample from the P. australis site, indicating that the species/strain it belongs to is sensitive to changes in environmental factors, such as soil moisture, electrical conductivity and temperature. In the spring samples, some differences were observed in the numbers, the mobility and intensity of bands in each lane, but band 6 ( (C-b)) was observed in all lanes. The maximum number of bands was observed in lanes C5 and C9, and the least number of bands in lane C6 ( (C-a)). Band 3 ( (C-b)) was observed only in lanes C2, C5 and C9 ( (C-a)) and band 11 ( (C-b)) was observed only in lanes C11 and C12 ( (C-a)). This indicated that the AOB corresponding to these bands were sensitive to environmental changes. The DGGE profiles of spring, summer and autumn samples showed that there were different band patterns but each site and layer had a special characteristic band.
Figure 1. DGGE fingerprint of soil AOB sampled in the summer (A), autumn (B) and spring (C): eletrophoretogram (a); sketch map (b).
Clustering analysis
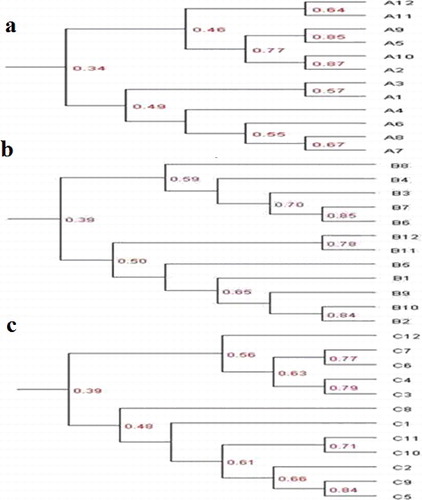
Clustering analysis across sites indicated that the banding patterns were distributed in two main clusters (). In the summer soil samples, the Dice similarity coefficient showed 13.9%–86.7% similarity of all the samples. Samples A11 and A12 grouped together (at 64% similarity), whereas samples A2 and A10 clustered at 87% similarity and samples A5 and A9 were affiliated to the same cluster ((a)). The second main cluster included samples A3, A1, A4, A6, A8 and A7. The similarity between the banding patterns of samples A2 and A10 indicated that there was greater similarity in the same soil layer but not in the same site. However, the clustering analysis indicated that the community structure of AOB showed higher similarity in the adjacent soil layers and in the same site based on the stronger similarity of A11, A12, A7 and A8 lanes. The Dice similarity coefficient showed that the similarity of all the autumn soil samples ranged from 23.4% to 84.7%. The clustering analysis of soil AOB in the autumn samples based on the banding patterns revealed two main clusters ((b)): one was composed of samples B3, B6, B7 and B8 and the other one, of samples B1, B2, B5, B9, B10, B11 and B12, among which the similarity of B2 and B10 reached 84%. This indicated that there were large differences in the community structure of AOB in different soil layers and different sites in autumn. The Dice similarity coefficient showed that the similarity of all the samples was from 18.8% to 83.9% in spring soil samples. In spring soil samples, we observed two main clusters: one of them was composed of samples C3, C4, C6, C7 and C12 and the other one, of samples C1, C2, C5, C8, C9, C10 and C11 ((c)). Among them, the similarity of C5 and C9 reached 84%. This reflected the diversity of the community structure of AOB in different soil layers and different sites in Ebinur Lake Wetland in spring.
Figure 2. UPGMA dendrogram generated from AOB DGGE profiles of samples collected in the summer (a), autumn (b) and spring (c).
The Shannon–Wiener index gives information about the richness and the stability of the community structure in a whole ecosystem. In this study, the Shannon–Wiener index (H) and evenness (E) were used to assess the diversity of the samples in different soil layers, sites and seasons ().
Table 2. Shannon–Wiener index (H), richness (S) and evenness (E) of AOB communities in spring, summer and autumn soil samples.
In the summer soil samples, the Shannon–Wiener index was observed to be from 1.380 to 2.471, with a peak again in the 0–5 cm layer at the H. strobilaceum site, and a minimum in the 25–35 cm layer at the H. strobilaceum site. The index of richness varied from 4 to 12, with a maximum in the 0–5 cm layer at the P. australis site and a minimum in the 5–15 cm layer at the H. strobilaceum site and the 15–25 cm layer at the T. ramosissima site. The dynamics of evenness did not show any considerable changes: the index of evenness was in the range of 0.9890–0.9991.
In the autumn samples, the Shannon–Wiener index was between 1.369 and 2.291, with a peak in the 0–5 cm layer at the H. strobilaceum site, and the lowest point in the 25–35 cm layer of the H. strobilaceum site. The index of richness ranged from 4 to 10, with a maximum in the 0–5 cm layer of the H. strobilaceum site and the P. australis site and a minimum in the 5–15 cm and 25–35 cm layer at the H. strobilaceum site. No obvious changes were found in the dynamics of evenness: the index of evenness was in the range of 0.9876–0.9991; its highest value was observed in the 5–15 cm layer at the H. strobilaceum site and the lowest one in the 25–35 cm layer at the H. strobilaceum site.
The Shannon–Wiener index ranged from 1.384 to 2.391 in spring and its peak occurred in the 0–5 cm layer at the H. strobilaceum site. The index of richness was from 4 to 11, with a maximum in the 0–5 cm layer at the H. strobilaceum site and the P. australis site and a minimum in the 5–15 cm layer at the H. strobilaceum site. There were no obvious changes in the dynamics of evenness: the index of evenness was between 0.9878 and 0.9986.
Overall, the highest and the lowest diversities of AOB occurred in the H. strobilaceum site (). There was no clear correlation between the AOB diversity observed in different sites and soil layers in the summer and the autumn. In short, the highest diversity of AOB was found in the P. australis community area. The diversity of AOB revealed by DGGE patterns in the T. ramosissima community area was higher than that in the H. strobilaceum community area. However, our study on the number of AOB showed a different trend: the abundance was highest in the T. ramosissima community area, lowest in the H. strobilaceum community area and least in the P. australis community area.[Citation21] This indicates that the number of AOB did not depend on the diversity of AOB in the same site. There might be two reasons for this phenomenon: one could be that the dominant population may have a large ratio in the total abundance, which would limit the growth of inferior populations; and another reason could be that the dominant population in the environment was detected by DGGE but some inferior populations may not have been accurately detected by DGGE.
Phylogenetic analysis of AOB in Ebinur Lake Wetland
For the purpose of phylogenetic analysis, the 20 bands of the DGGE profile were excised from the gel, re-amplified and sequenced by Beijing Liuhe Genomics Technology Co., LTD (Beijing, China). The phylogenetic trees constructed by the neighbour-joining method are shown in . The phylogenetic analysis revealed that the amoA sequences in the studied samples from Ebinur Lake Wetland were grouped into two genera: Nitrosospira spp. and Nitrosomonas spp. The majority of the amoA gene sequences (17 bands) fell within genus Nitrosospira and only a few sequences belonged to genus Nitrosomonas (3 bands). This indicated that the AOB communities in the soil at the sampling sites were dominated by Nitrosospira, and not by Nitrosomonas. These results are in good agreement with previous reports that Nitrosospira is the dominant AOB in soil.[Citation22] The amoA gene sequences were grouped into five clusters. Of them, Cluster I, Cluster II, Cluster III and Cluster IV were affiliated to Nitrosospira sp., whereas Cluster V was clustered with Nitrosomonas sp. These results showed that more than 85% of the AOB sequences were identified as Nitrosospira spp. in the phylogenetic tree and therefore, Nitrosospira was the dominant genera in the studied soil samples from Ebinur Lake Wetland.
Figure 3. Phylogenetic tree of AOB based on partial DGGE sequences (neighbour-joining tree).
The sequences of Nitrosospira and Nitrosomonas are usually detected in studies on the microbial diversity of wetlands [Citation11] and are also detected in soil, ocean and sediment samples.[Citation1,Citation2,Citation5,Citation23] However, there are also some reports in which Nitrosomonas spp. were not detected in the soil.[Citation24,Citation25] The fact that, in this research study, only a few Nitrosomonas spp. were detected could possibly be due to the low temperature and the high salinity in Ebinur Lake in Xinjiang, resulting in adaptation of some new species of AOB to low temperatures. It could be speculated that Nitrosospira spp. might prefer high-salinity environment, while Nitrosomonas spp., low-salinity environment [Citation2]; and that DGGE might have only detected the dominant population.
Relationships between AOB community structure and environmental factors
The detailed physiochemical parameters of the studied soil samples are summarized in Table S1 in the online Supplementary Appendix. All stands were located on alkaline soils with pH ranging from 7.41 to 9.25. The soil moisture was relatively low. The electrical conductivity and organic matter of soil ranged from 1.80 to 11.46 mS/cm and from 1.75 to 8.58 g/kg, respectively. The total nitrogen, total phosphorus and total potassium were high across all sites (respectively, > 0.23, 0.41 and 4.24 g/kg). The ammonium content, nitric nitrogen, available nitrogen, available phosphorus and available potassium were low across all sites (respectively, < 9.13, 2.57, 35.69, 33.07 and 318.03 mg/kg).
There are scarce data on the factors that determine the AOB community structure and richness, although the regulation of nitrification process by abiotic factors has been largely discussed.[Citation8,Citation23,Citation24] The abundance, distribution and community structure of AOB are related to the net N mineralisation rate, microbial quotient and microbial biomass in the soil.[Citation23] However, in the present study (), with the change of seasons, there were significant positive correlations between the Shannon–Wiener diversity index of AOB and electrical conductivity (r = 0.726, p < 0.01 in spring; r = 0.626, p < 0.05 in autumn), organic matter (r = 0.691, p < 0.05 in spring; r = 0.664, p < 0.05 in summer; r = 0.538, p < 0.05 in autumn), nitric nitrogen (r = 0.483, p < 0.01 in spring; r = 0.689, p < 0.05 in summer; r = 0.362, p < 0.05 in autumn), total phosphorus (r = 0.505, p < 0.05 in spring; r = 0.783, p < 0.01 in summer; r = 0.630, p < 0.05 in autumn) and available phosphorus (r = 0.499, p < 0.05 in spring; r = 0.405, p < 0.05 in autumn). The Shannon–Wiener diversity index of AOB showed a positive correlation with pH, total nitrogen, available nitrogen, ammonium content, total potassium and available potassium. With the change of soil layers, the Shannon–Wiener diversity index of AOB showed negative correlation with pH and soil moisture and, at the same time, it correlated positively with total nitrogen, nitric nitrogen, total phosphorus and available phosphorus. There was significant positive correlation between the Shannon–Wiener diversity index of AOB and nitric nitrogen (r = 0.089, p < 0.05) in the 0–5 cm soil layer and total phosphorus (r = 0.626, p < 0.05) in the 5–15 cm soil layer. Moreover, it correlated with the electrical conductivity, organic matter, available nitrogen, ammonium content, total potassium and available potassium.
Table 3. Correlation analysis (r) between Shannon–Wiener diversity index of AOB and environmental factors.
Based on the correlation analysis, with the change of seasons, the electrical conductivity, organic matter, nitric nitrogen and total phosphorus were proposed to be potential contributors to the diversity of AOB in this study. The level of electrical conductivity is indicative of the level of salinity and a high-salinity site may be less heterogeneous, providing restricted niche differentiation.[Citation5,Citation26,Citation27] However, the diversity in the 0–5 cm soil layer in the spring, which was with highest salinity, was relatively high, and the diversity in the 25–35 cm soil layer in the summer, which was with lower salinity, was low. The organic matter was used to assess the quality of soil, as it has an influence on the physiochemical parameters of soil and promotes the activities of micro-organisms. The type and availability of organic matter can impact AOB community structure through its influence on the competition between AOB and heterotrophs for inorganic nitrogen. In different soil layers, the diversity and community structure of AOB correlated with total nitrogen, nitric nitrogen, total phosphorus, available phosphorus, nitric nitrogen and total phosphorus. This indicates that the overall level of AOB diversity in Ebinur Lake Wetland might depend on a complex combination of multiple environmental factors and the diversity of AOB might have an indicative function for changes in environmental factors in this wetland ecosystem.
Conclusions
Taken together, the results from this study provide evidence for the presence of AOB in Ebinur Lake Wetland. The PCR-DGGE profiles revealed that the diversity of ABO was high in the entire sample, suggesting that AOB might play an important role in ammonia oxidation in Ebinur Lake Wetland. Meanwhile, the phylogenetic analysis showed that the amoA fragments were grouped into Nitrosospira sp. and Nitrosomonas sp. clusters. The large majority of the fragments were identified to fall within the Nitrosospira spp. cluster, while only a few sequences were clustered with the Nitrosomonas sp., indicating that Nitrosospira spp. were dominant in this area. Furthermore, the diversity of AOB might be strongly influenced by the soil organic matter, the conductivity, the total phosphorus and the nitrate content in the Ebinur Lake Wetland in Xinjiang.
Online_supplementary_appendix.pdf
Download PDF (86.2 KB)Acknowledgments
The authors would like to thank Gao Xiang, Director of the Ebinur Lake Wetland National Nature Reserve administration, and Xu Wei, Chief of the Ebinur Lake Wetland bird island station in Xinjiang, for having permitted the collection of samples for this study. The authors would like to thank the editor and anonymous reviewers for their valuable comments and suggestions to improve the quality of this paper.
Supplemental data for this article can be accessed at: http://dx.doi.org/10.1080/13102818.2015.1124738
Disclosure statement
No potential conflict of interest was reported by the authors.
Additional information
Funding
References
- Liu B, Li Y, Zhang J, et al. Abundance and diversity of ammonia-oxidizing microorganisms in the sediments of Jinshan Lake. Curr Microbiol. 2014;69(5):751–757.
- Xu W, Li M, Ding JF, et al. Bacteria dominate the ammonia-oxidizing community in a hydrothermal vent site at the Mid-Atlantic Ridge of the South Atlantic Ocean. Appl Microbiol Biotechnol. 2014;98(18):7993–8004.
- Gieseke A, Tarre S, Green M, et al. Nitrification in a biofilm at low pH values: role of in situ microenvironments and acid tolerance. Appl Environ Microbiol. 2006;72(6):4283–4292.
- Dorador C, Busekow A, Vila I, et al. Molecular analysis of enrichment cultures of ammonia oxidizers from the Salar de Huasco, a high altitude saline wetland in northern Chile. Extremophiles. 2008;12(3):405–414.
- Chen Y, Zhen Y, He H, et al. Diversity, abundance, and spatial distribution of ammonia-oxidizing β-proteobacteria in sediments from Changjiang Estuary and its adjacent area in East China Sea. Microbial Ecol. 2014;67(4):788–803.
- Purkhold U, Wagner M, Timmermann G, et al. 16S rRNA and amoA-based phylogeny of 12 novel betaproteobacterial ammonia-oxidizing isolates: extension of the dataset and proposal of a new lineage within the nitrosomonads. Int J Syst Evol Microbiol. 2003;53(5):1485–1494.
- Purkhold U, Pommerening-Roser A, Juretschko S, et al. Phylogeny of all recognized species of ammonia oxidizers based on comparative 16S rRNA and amoA sequence analysis: implications for molecular diversity surveys. Appl Environ Microbiol. 2000;66(12):5368–5382.
- Sher Y, Zaady E, Nejidat A. Spatial and temporal diversity and abundance of ammonia oxidizers in semi-arid and arid soils: indications for a differential seasonal effect on archaeal and bacterial ammonia oxidizers. FEMS Microbiol Ecol. 2013;86(3):544–556.
- Jin T, Zhang T, Ye L, et al. Diversity and quantity of ammonia-oxidizing Archaea and Bacteria in sediment of the Pearl River Estuary, China. Appl Microbiol Biotechnol. 2011;90(3):1137–1145.
- Chain P, Lamerdin J, Larimer F, et al. Complete genome sequence of the ammonia-oxidizing bacterium and obligate chemolithoautotroph Nitrosomonas europaea. J Bacteriol. 2003;185(9):2759–2773.
- Junier P, Molina V, Dorador C, et al. Phylogenetic and functional marker genes to study ammonia-oxidizing microorganisms (AOM) in the environment. Appl Microbiol Biotechnol. 2010;85(3):425–440.
- Ren JL, Jin HL, Ye M, et al. Analysis and evaluation of water quality of Aibihu Lake Wetland Natural Reserve. J Arid Land Resources Environ. 2011;25(5):154–157. Chinese.
- Liu Y. Protect wetland and improve eco-environment of Ebinur Wetland Lake. Environ Sci Trend. 2004;4:3–5. Chinese.
- Malchair S, Carnol M. AOB community structure and richness under European beech, sessile oak, Norway spruce and Douglas-fir at three temperate forest sites. Plant Soil. 2013;366:521–535.
- Zhao Y, Zhou ZH, Li W, et al. DNA extraction from soil for molecular analysis of microbial community. J Agro-Environ Sci. 2005;24(5):854–860. Chinese.
- Nakamura K. Removal of mercury from mercury-contaminated sediments using a combined method of chemical leaching and volatilization of mercury by bacteria. Biodegradation. 1999;10(6):443–447.
- Bassam BJ, Gresshoff PM. Silver staining DNA in polyacrylamide gels. Nat Protoc. 2007;2(11):2649–2654.
- Thompson JD, Gibson TJ, Plewniak F, et al. The CLUSTAL_X windows interface: flexible strategies for multiple sequence alignment aided by quality analysis tools. Nucl Acids Res. 1997;25(24):4876–4882.
- Naruya Saitou MN. The neighbor-joining method: a new method for reconstructing phylogenetic trees. Mol Biol Evol. 1987;4(4):406–425.
- Tamura K, Dudley J, Nei M, et al. MEGA4: molecular evolutionary genetics analysis (MEGA) software version 4.0. Mol Biol Evol. 2007;24(8):1596–1599.
- Chen DW, Wang XG, Hu WG, et al. Correlation analysis between the distribution of ammonia-oxidizing bacteria and soil environment in Ebinur Lake Wetland. Microbiol China. 2012;39(3):334–343. Chinese.
- Olsson PA, Hansson MC, Burleigh SH. Effect of P availability on temporal dynamics of carbon allocation and Glomus intraradices high-affinity P transporter gene induction in arbuscular mycorrhiza. Appl Environ Microbiol. 2006;72(6):4115–4120.
- Malchair S, Carnol M. AOB community structure and richness under European beech, sessile oak, Norway spruce and Douglas-fir at three temperate forest sites. Plant Soil. 2012;366(1–2):521–535.
- Chu H, Fujii T, Morimoto S, et al. Community structure of ammonia-oxidizing bacteria under long-term application of mineral fertilizer and organic manure in a sandy loam soil. Appl Environ Microbiol. 2007;73(2):485–491.
- Webster G, Embley TM, Prosser JI. Grassland management regimens reduce small-scale heterogeneity and species diversity of β-proteobacterial ammonia oxidizer populations. Appl Environ Microbiol. 2002;68(1):20–30.
- Coci M, Riechmann D, Bodelier PL, et al. Effect of salinity on temporal and spatial dynamics of ammonia-oxidising bacteria from intertidal freshwater sediment. FEMS Microbiol Ecology. 2005;53(3):359–368.
- Bernhard AE, Donn T, Glblln AE, et al. Loss of diversity of ammonia-oxidizing bacteria correlates with increasing salinity in an estuary system. Environ Microbiol. 2005;7(9):1289–1297.