
ABSTRACT
Sunflower (Helianthus annuus L.) is one of the most important oil crops worldwide. Ago-morphological traits are important for sunflower breeders in selection of genotypes with high performance and other traits. The objectives of this study were to determine the population structure and linkage disequilibrium among 106 dispersed sunflower genotypes and to identify the genomic regions associated with agro-morphological traits using the association mapping approach. High genetic variability was observed among the sunflower genotypes for the studied agro-morphological traits. In molecular experiments, the genetic variability among the genotypes was assessed by using simple sequence repeat (SSR, or microsatellite), inter-retrotransposon-amplified polymorphism (IRAP) and retrotransposon-microsatellite amplified polymorphism (REMAP) markers. In this study, 248 loci were detected using 28 IRAP and REMAP primers and also a total number of 67 alleles were detected using 30 SSR loci. The studied sunflower lines were divided into two subpopulations using IRAP + REMAP data and into five subpopulations using SSR data. By using a mixed linear model procedure, 224 loci showed significant association with quantitative trait loci controlling the investigated traits. The identified and associated markers are expected to be useful in marker-aided selection in sunflower breeding programmes.
Introduction
Sunflower (Helianthus annuus L.) is one of the earliest oilseed species in North America. It belongs to the genus Helianthus in the family Compositae. It is grown mainly in Russia, Ukraine, Argentina, some Eastern European countries, China and the USA. It is the fifth largest among the oilseed crops after soybean, rapeseed, cottonseed and groundnut as a source of edible oil.[Citation1] The content of oil in the seeds of commercially available sunflower varieties ranges from 39% to 49%.[Citation1]
Normally, it may take as long as 25 years to create a new crop variety, but with the help of the tools now available in molecular biology, the process can be speeded up to 7–10 years. One of these tools is marker-assisted selection (MAS). As a precondition, identifying tightly linked markers is essential for the successful and effective use of DNA marker technology in breeding programmes.[Citation2,Citation3] Mapping QTL in plants is commonly achieved by means of systematic bi-parental breeding populations, e.g. backcrosses, F2-intercrosses or recombinant inbred lines (RILs).[Citation4,Citation5] In these populations, however, few recombination events occur, which is why the associated markers are often not tightly linked to the QTL of interest.[Citation6] Another effective approach for detecting existing associations between plant phenotypic traits and genotype is association mapping. It is applicable provided that there is available information about the population structure and the linkage disequilibrium (LD).[Citation7] Association mapping is particularly useful for the purpose of identifying markers that are tightly linked to a specific QTL in natural populations and germplasm collections.[Citation4,Citation8] This approach has been used in a number of plant species of agricultural importance, including maize,[Citation7] barley,[Citation9] hexaploid wheat,[Citation10] sunflower,[Citation11,Citation12] chickpea,[Citation2] tobacco,[Citation13] and others. Association mapping is often preferred to bi-parental linkage analysis because it allows higher mapping resolution due to using all the meiosis events accumulated in the breeding history of a species. Another advantage is the richness of allelic polymorphism due to the vast genetic variation in the diverse genetic background of the genotypes. Moreover, association mapping is considered more cost-effective, since available phenotypic data about populations can be obtained in multiple environments.[Citation14–16] However, false positive associations between markers and traits may be detected depending on the population structure, the sample size and the specific allele frequency.[Citation16] Such false-positive associations could be minimized using methods that include population structure (Q) and kinship (K) matrix or a combination of the two (Q + K).[Citation14,Citation17]
The molecular fingerprint of the sunflower germplasm available at present has been generated on the basis of different DNA markers. One of the most dependable DNA markers for genetic investigations are simple sequence repeats (SSR, or microsatellites), as they are highly polymorphic, randomly distributed and co-dominantly inherited following the Mendelian principles.[Citation18]. SSR are ubiquitous 1–6-base tandem repeats in coding and non-coding regions of prokaryotic and eukaryotic genomes and are characterized by high length polymorphism.[Citation19,Citation20] SSR markers have been previously used by us as molecular markers for genetic diversity studies in several agriculturally important plants, including sunflower,[Citation21,Citation22] chickpea [Citation23] and tobacco [Citation13,Citation24]. Different types of molecular markers based on retrotransposons, which are ubiquitous in plant genomes, have also been developed and employed for characterization of plant genetic resources.[Citation25,Citation26] Retrotransposon molecular markers have been demonstrated to be more informative and polymorphic compared to other marker systems in a variety of crop plants.[Citation3,Citation27,Citation28] Inter-retrotransposon amplified polymorphism (IRAP) and retrotransposon-microsatellite amplified polymorphism (REMAP) are two retrotransposon marker systems that require no DNA digestion and have been applied as molecular markers for genetic studies in several research works [Citation3,Citation26,Citation28,Citation29].
The aim of the present work was to document the genetic variability of a sunflower germplasm, characterize the population structure and identify SSR, REMAP and IRAP markers associated with agro-morphological characteristics, using the association mapping approach.
Material and methods
Plant material and phenotyping
In this study, 106 pure sunflower lines kindly provided by several research centres in Europe, Iran and the USA were used (). Seeds were planted in round pots (26 cm in diameter, 25 cm deep) filled with a mixture of one part peat moss and three parts top soil to about 1 cm from the top of the pots. Each line was planted in nine pots, each pot representing a replication. Pots were arranged in a completely randomized design with a spacing of 50 × 30 cm outside the greenhouse in an open-air area under natural environmental conditions. After complete emergence, seedlings were thinned to one plantlet per pot. Irrigation was done using a drip irrigation system. The pots were watered on a daily basis until the plants reached maturity. Water-soluble fertilizer (20-20-20: N-P-K) was applied twice a week until flowering. Fourteen agro-morphological traits, including plant height (PH, cm), stem diameter (SD, cm), number of leaves (LN), leaf length (LL, cm), leaf width (LW, cm), petiole length (PL, cm), head diameter (HD, cm), 100-seed weight (100SW, g), seed yield per plant (SY, g), head weight (HW, g), kernel ratio (KR), harvest index (HI), flowering date (DAYF, day) and maturity date (DAYM, day) were measured and calculated.
Table 1. Name and origin of the studied sunflower lines.
DNA isolation
Genomic DNA was extracted from the young leaves of 15-day-old seedlings by using the method described by Dellaporta et al. [Citation30] with some modifications in the extraction buffer (750 µL of extraction buffer: 100 mmol/L Tris-HCl pH 8.0, 50 mmol/L ethylenediaminetetraacetic acid (EDTA) pH 8.0, 248 mmol/L NaCl, 173 mmol/L sodium dodecyl sulphate (SDS)). Extracted DNA was re-suspended in 100 µL TE buffer (10 mmol/L Tris, 1 mmol/L EDTA pH 8.0). The concentration of each DNA sample was determined spectrophotometrically at 260 nm using a BioPhotometer 6131 (Eppendorf, Germany). DNA quality was checked by running 1 μL DNA in 0.8% (w/v) agarose gels in 0.5X TBE buffer (45 mmol/L Tris base, 45 mmol/L boric acid, 1 mmol/L EDTA, pH 8.0) at 80 V for 45 min. DNA samples that gave a smear in the gel were discarded.
SSR, IRAP and REMAP assay
Thirty microsatellite markers () out of 339 ‘ORS’ SSR markers from the SSR database [Citation31] were used for DNA fingerprinting. By analogy to our previous study,[Citation22] the selection of SSR markers was based on the clarity of the amplified bands and their genetic locations in order to give a uniform coverage of the sunflower genome.[Citation31,Citation32] Polymerase chain reaction (PCR) for each of the 30 SSR markers was performed in a volume of 20 µL, using a 96-well Eppendorf Mastercycler Gradient (Type 5331; Eppendorf AG, Hamburg, Germany). The reaction mixture contained 2.5 mmol/L of each primer, 0.4 U of Taq DNA polymerase (Cinagene Co., Tehran, Iran), 100 µmol/L of each deoxyribonucleoside triphosphate (dNTP; BioFluxbiotech, http://biofluxbiotech.com), 2 µL of 10X PCR buffer, 2 mmol/L MgCl2 (Cinagene Co., Tehran, Iran), ddH2O and 25 ng of template DNA. Touchdown PCR was used for amplification of all SSRs as follows: 94 ºC for 3 min, 1 cycle of 94 ºC for 30 s, 64 ºC for 30 s and 72 ºC for 45 s, followed by 10 cycles with a decrease of annealing temperature with 1 ºC per cycle. This was followed by 30 cycles of 94 ºC for 30 s, 54 ºC for 30 s and 72 ºC for 45 s. Final extension was 20 min at 72 ºC.[Citation31] The reaction products were mixed with an equal volume of formamide dyes and resolved in a 3% (w/v) agarose gel (Invitrogen, France) in 0.5X TBE buffer, stained with 1.0 μg/mL ethidium bromide and photographed under UV light using a Gel-Doc image analysis system (Gel Logic 212 PRO, USA).
Table 2. Name and sequence of SSR primer pairs.
Fourteen single and IRAP primer combinations ( and ) were used for genomic fingerprinting of 106 sunflower inbred lines. Primers were designed based on native LTR retrotransposons. PCR amplifications were performed in a final volume of 20 µL containing 20 ng of genomic DNA, 2 µL of 10X PCR buffer (500 mmol/L KCl, 500 mmol/L Tris-HCl, pH 8.4), 1.75 mmol/L MgCl2, 0.25 mmol/L of each dNTP, 1.1 U of Taq DNA polymerase, 10 µmol/L of each primer and distilled water in a 96-well Eppendorf Mastercycler Gradient. The amplification profile consisted of initial denaturation at 94°C for 4 min, followed by 37 cycles at 94 °C for 40 s, annealing temperature () for 40 s and 72 °C for 2 min, and a final extension of 5 min at 72 °C. The reaction products were mixed with 5 µL of formamide dye (98% formamide, 10 mmol/L of EDTA, 0.05% bromophenol blue and 0.05% xylene cyanol) and resolved in a 1.8% (w/v) ultrapure agarose gel in 0.5X TBE at 65 V for 4 h. DNA fragments were stained with ethidium bromide (1.0 μg/mL) and photographed under UV light using a Gel-Doc image analysis system.
Table 3. Name and sequence of retroelement and inter simple sequence repeat primers.
Table 4. IRAP and REMAP primer combinations, annealing temperature, total loci, polymorphic loci and size of amplified loci.
In the next step, 14 REMAP primer combinations ( and ) out of 72 combinations from 9 single IRAP and 8 ISSR primers were used for DNA fingerprinting. The choice of primer combinations was again based on the clarity of produced bands. PCR amplification reactions, electrophoresis and visualization of REMAP markers were the same as the procedures described for IRAP markers.
Data analysis
The SSR data were scored as co-dominant markers in order to distinguish homozygotes and heterozygotes for each locus. Amplified fragments from IRAP and REMAP markers were scored independently as 1 or 0 for their presence or absence at each position. The population structure was analysed using a model-based Bayesian approach in the software package Structure 2.3.4.[Citation33] Five independent runs were performed, setting the number of sub-populations (K) from 1 to 10, burn-in time and MCMC (Markov Chain Monte Carlo) replication number both to 100,000, and a model for admixture and correlated allele frequencies. The most likely k-value was determined by the log probability of data [LnP(D)] [Citation34] and an ad hoc statistic Δk based on the rate of change of LnP(D) between successive k values as described by [Citation35]. Inferred ancestry estimates of individuals (Q-matrix) were derived for the selected subpopulations.[Citation33] Software TASSEL 2.1 was used to estimate kinship coefficients and LD analysis. Association mapping was performed to analyze marker -trait association using kinship coefficients (K-matrix) and ancestry coefficient (Q values) estimates as covariates in the mixed linear model (MLM) function using TASSEL 2.1 software.
Results and discussion
Genetic variability and population structure
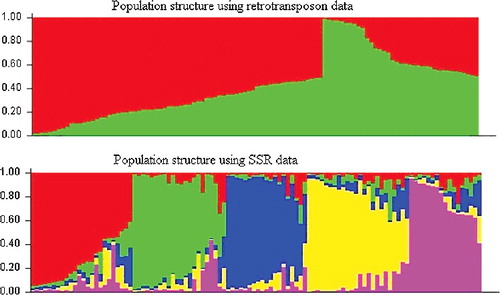
High levels of phenotypic variation for studied traits were observed among the lines (). Using 28 IRAP and REMAP primers, 248 loci () and using 30 SSR loci, a total number of 67 alleles were detected in this research. According to diagrams of LnP(D) and Δk (), the studied panel was subdivided into two and five subpopulations based on retrotransposon (IRAP + REMAP) and SSR marker data, respectively. This issue could be justified considering the low levels of genetic variation (about 6%) between grouped genotypes. These results also indicate that each dominant or co-dominant marker system could depict some aspects of the sunflower genome. Based on retrotransposon marker data and considering the Q values, 59% of the studied genotypes were assigned to the corresponding subgroups and the remaining ones were categorized into the ‘mixed’ group. This value was 71% based on SSR data (). In this study, 41% and 29% of the studied genotypes were categorized into ‘admixed’ subgroups based on their Q values obtained by retrotransposon and SSRs data, respectively. Similarly, Mandel et al. [Citation36] studied the existence of genetic diversity and population structure in 433 sunflower genotypes, an observed K = 2 clusters for the population structure.
Table 5. Mean values with standard deviations of the investigated traits in sunflower lines.
Figure 1. Diagrams for LnP(D) and delta K of the sunflower lines subdivided into two subpopulations based on IRAP + REMAP data (A) and five subpopulations based on SSR data (B).
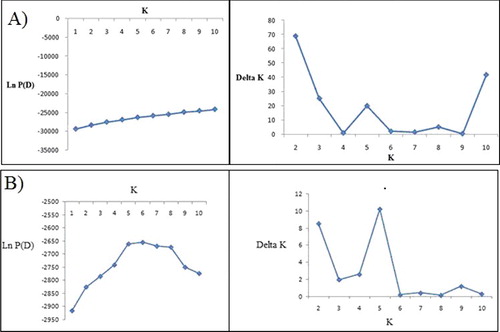
Figure 2. Population structure of 106 sunflower genotypes based on retrotransposon (IRAP + REMAP) and SSR data (Structure 2.3.4).
Successful association mapping in a given species requires an appropriate germplasm collection with phenotypic and underlying genetic variation for the traits of interest to be created.[Citation37,Citation38] The efficiency of association mapping largely depends on the population structure.[Citation15] What often complicates association studies is the complex germplasm stratification owing to the fact that many crop plants have an intricate breeding history and the gene flow in most wild plants is limited.[Citation15,Citation37] Since the population structure may affect the detection of false positive associations between markers and traits, the effects of population structure ought to be accounted for in order for the results from association analysis to be considered credible.[Citation13] Thus, the proper interpretation of the results from association assessment is achievable by means of the recent developments in statistical methodologies.[Citation15] All of these methods are based on the hypothesis that the effects of population structure are similar on all loci and therefore use independent marker loci to detect and correct for stratified populations.[Citation15,Citation39]
Linkage disequilibrium and association analysis
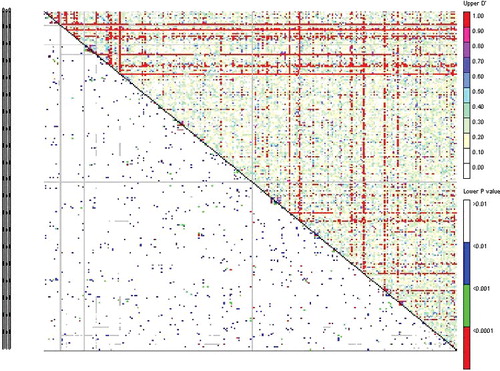
In the retrotransposon-based marker system, the r2 values ranged from 0.000 to 0.746 (), with an average value of 0.0151. The linkage disequilibrium rates (D′) ranged from 0.000 to 1 with an average value of 0.289. A significant level of LD was observed in 6.84% of the 30628 retrotransposon marker pairs (P < 0.05). In the genotyping system based on microsatellite markers, the r2 values ranged from 0.0001 to 0.541 and D' ranged from 0.004 to 1 (). Of 435 SSR marker pairs, 8.27% showed a significant level of LD (P < 0.05). LD is defined as a non-random association of alleles at separate loci located on the same chromosome.[Citation40] LD has been used in association mapping [Citation38] and to locate quantitative trait loci (QTL) or major genes, based on the co-segregation of specific marker alleles and traits.[Citation41] The presence of LD is a prerequisite for association mapping and the resolution of association mapping depends on the structure of LD across the genome.[Citation42] Factors contributing to the increase of LD include also small population size, inbreeding, genetic isolation between lineages, population subdivision, low recombination rate, population admixture, genetic drift and epistasis. In populations, for any pair of linked polymorphic loci LD decreases over generations, because of accumulation of recombination events.[Citation15]
Figure 3. LD plot generated by reterotransposon marker pairs. The upper diagonal shows r2 among each pair of markers. The lower diagonal shows the levels of significance between each pair of markers.
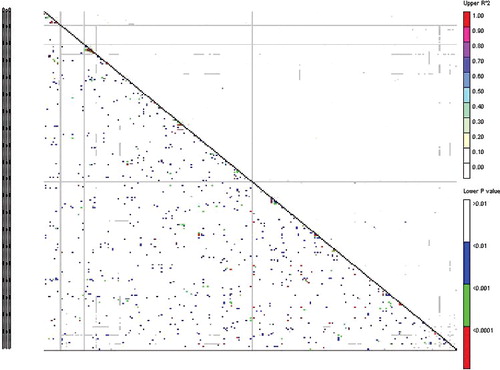
Figure 4. LD plot generated by SSR marker pairs. The upper diagonal shows the linkage disequilibrium rates (D′) among each pair of markers. The lower diagonal shows the levels of significance between each pair of markers.
Several statistical methods have been developed for quantification of LD, the choice of which for appropriate LD analysis actually depends on the objective of the study, since one performs better than others in particular situations and cases.[Citation8] The two most commonly used measures of LD are r2 and D′. The broad fluctuation of r2 and D′ values ( and ) pursue association analysis for this association panel.
The Q + K model of the TASSEL software was used to identify genes controlling some agro-morphological traits in the studied sunflower germplasm (). False positive associations of markers with traits can occur without considering the impact of population structures or familial relatedness.[Citation17] In our study, 214 loci showed significant association (P ≤ 0.05) with QTLs controlling the studied traits in the association panel: 15 of them were SSR, 107 of them were IRAP and 92 of them were REMAP markers (). The results pertaining to association analysis showed that some of the retrotransposon and SSR markers are tightly linked with some of the studied traits: 1064-ubc840 (REMAP) with the KR, 1062-1065 (IRAP) with the PL, cf-ubc826 (REMAP) with the flowering date (DAYF) and P307 (SSR) with the 100-seeds weight (100SW). SSR markers, including P9491 and P822, were commonly identified for more than one trait. The common markers between some of the studied traits can be due to linkage or pleiotropic effects. The common markers lead to an increase in the efficiency of MAS in plant-breeding programmes via simultaneous selection for several traits. According to the results shown in , both SSR and retrotransposon markers are associated with the genes controlling the studied agro-morphological traits in sunflower. These results are in agreement with the previous paralleled findings of Saeed et al. [Citation2] and Basirnia et al. [Citation13], who reported high resolution for association study in detecting genes controlling several characteristics in chickpea and tobacco, respectively.
Table 6. Markers identified for the studied agro-morphological traits in the studied sunflower germplasm using the association-mapping approach.
Conclusions
SSR and retrotransposon markers are useful tools in the study of genetic variation and population structure of sunflower germplasm. There was significant level of LD in sunflower germplasm which encouraged researchers to use natural populations for genomic studies. The obtained results showed that some identified markers were associated with more than one trait and, therefore, could be of great interest in MAS in sunflower breeding programmes.
Disclosure statement
No potential conflict of interest was reported by the author.
Additional information
Funding
References
- Hu J, Seiler G, Kole C. Genetics, genomics and breeding of crop plants: sunflower. Enfield (NH): Science Publishers; 2010. p. 79–109.
- Saeed A, Darvishzadeh R, Basirnia A. Simple sequence repeat markers associated with agro-morphological traits in chickpea (Cicer arietinum L.). Zemdirbyste Agric. 2013;100:433–440.
- Basirnia A, Darvishzadeh R, Abdollahi mandoulakani B. Retrotransposon insertional polymorphism in sunflower (Helianthus annuus L.) lines revealed by IRAP and REMAP markers. Plant Biosyst. Forthcoming 2014. doi:10.1080/11263504.2014.970595.
- Parrisseaux B, Bernardo R. In silico mapping of quantitative trait loci in maize. Theor Appl Genet. 2004;109:508–514.
- Russo MA, Ficco DBM, Marone D, et al. A major QTL for resistance to soil-borne cereal mosaic virus derived from an old Italian durum wheat cultivar. J Plant Interact. 2012;7:290–300.
- Myles S, Peiffer J, Brown PJ, et al. Association mapping: critical considerations shift from genotyping to experimental design. Plant Cell. 2009;21:2194–2202.
- Thornsberry JM, Goodman MM, Doebley J, et al. Dwarf8 polymorphisms associate with variation in flowering time. Nature Genet. 2001;28:286–289.
- Abdurakhmonov IY, Abdukarimov A. Application of association mapping to understanding the genetic diversity of plant germplasm resources. Int J Plant Genomics. 2008;2008:1–18.
- Kraakman ATW, Martínez F, Mussiraliev B, et al. Linkage disequilibrium mapping of morphological, resistance, and other agronomically relevant traits in modern spring barley cultivars. Mol Breed. 2006;17:41–58.
- Breseghello F, Sorrells M. Association mapping of kernel size and milling quality in wheat (Triticum aestivum L.) cultivars. Genetics. 2006;172 1165–1177.
- Darvishzadeh R, Poormohammad Kiani S, Huguet T, et al. Genetic variation and identification of molecular marker associated with partial resistance to Phoma macdonaldii in gamma-irradiation-induced mutants of sunflower. Can J Plant Pathol. 2008;30:106–114.
- Davar R, Darvishzadeh R, Rezaee Danesh Y, et al. Single sequence repeat markers associated with partial resistance in sunflower to Phoma macdonaldii. Phytopathol Mediterr. 2012;51:541–548.
- Basirnia A, Hatami Maleki H, Darvishzadeh R, et al. Mixed linear model association mapping for low chloride accumulation rate in oriental-type tobacco (Nicotiana tabacum L.) germplasm. J Plant Interact. 2014;9:666–672.
- Yu JM, Buckler ES. Genetic association mapping and genome organization of maize. Curr Opin Biotech. 2006;17:155–160.
- Sorkheh K, Malysheva-Otto LV, Wirthensohn MG, et al. Linkage disequilibrium, genetic association mapping and gene localization in crop plants. Genet Mol Biol. 2008;31:805–814.
- Zhang Q, Wu C, Ren F, et al. Association analysis of important agronomical traits of maize inbred lines with SSRs. Aust J Crop Sci. 2012;6:1131–1138.
- Yu J, Pressoir G, Briggs WH, et al. A unified mixed-model method for association mapping that accounts for multiple levels of relatedness. Nat Genet. 2010;38:203–208.
- Kalia RK, Rai MK, Kalia S, et al. Microsatellite markers: an overview of the recent progress in plants. Euphytica. 2011;177:309–334.
- Sonah H, Deshmukh RK, Singh VP, et al. Genomic resources in horticultural crops: status, utility and challenges. Biotech Adv. 2011;29:199–209.
- Singh H, Deshmukh RK, Singh A, et al. Highly variable SSR markers suitable for rice genotyping using agarose gels. Mol Breed. 2010;25:359–364.
- Kholghi M, Darvishzadeh R, Bernousi I, et al. Assessment of genomic diversity among and within Iranian confectionery sunflower (Helianthus annuus L.) populations by using simple sequence repeat markers. Acta Agric Scand Sect B Soil Plant Sci. 2012;62:488–498.
- Darvishzadeh R. Association of SSR markers with partial resistance to Sclerotinia sclerotiorum isolates in sunflower (Helianthus annuus L.). AJCS. 2012;6(2):276–282.
- Saeed A, Hovsepyan H, Darvishzadeh R, et al. Genetic diversity of Iranian accessions, improved lines of chickpea (Cicer arietinum L.) and their wild relatives by using simple sequence repeats. Plant Mol Biol Rep. 2011;29:848–858.
- Darvishzadeh R, Basirnia A, Maleki HH, et al. Association mapping for resistance to powdery mildew in oriental tobacco (Nicotiana tabacum L.) germplasm. Iranian J Genet Plant Breed. 2014;3(1):21–30.
- Flavell AJ, Knox MR, Pearce SR, et al. Retrotransposon based insertion polymorphisms (RBIP) for high throughput marker analysis. Plant J. 1998;16:643–650.
- Kalendar R, Grob T, Regina M, et al. IRAP and REMAP: two new retrotransposon-based DNA fingerprinting techniques. Theor Appl Genet. 1999;98:704–711.
- Queen RA, Gribbon BM, James C, et al. Retrotransposon-based molecular markers for linkage and genetic diversity analysis in wheat. Mol Genet Genom. 2004;271:91–97.
- Abdollahi Mandoulakani B, Piri Y, Darvishzadeh R, et al. Retroelement insertional polymorphism and genetic diversity in medicago sativa populations revealed by IRAP and REMAP markers. Plant Mol Biol Rep. 2012;30:286–296.
- Abdollahi Mandoulakani B, Bihamta MR, Schulman AH, et al. [Evaluation of retrotranposons as molecular markers in wheat]. Mod Genet J. 2009;4:17–25. Persian.
- Dellaporta SL, Wood J, Hicks JB. A plant DNA miniprepration: version II. Plant Mol Biol Rep. 1983;1:19–21.
- Tang S, Yu JK, Slabaugh MB, et al. Simple sequence repeat map of the sunflower genome. Theor Appl Genet. 2002;105:1124–1136.
- Poormohammad Kiani S, Talia P, Maury P, et al. Genetic analysis of plant water status and osmotic adjustment in recombinant inbred lines of sunflower under two water treatments. Plant Sci. 2007;172:773–787.
- Pritchard JK, Stephanes M, Rosenberg NA, et al. Association mapping in structured populations. Am J Hum Genet. 2000;67:170–181.
- Rosenberg NA, Pritchard JK, Weber JL, et al. The genetic structure of human populations. Science. 2002;298:2381–2385.
- Evanno G, Regnaut S, Goudet J. Detecting the number of clusters of individuals using the software STRUCTURE: a simulation study. Mol Ecol. 2005;14:2611–2620.
- Mandel JR, Dechaine JM, Marek LF, et al. Genetic diversity and population structure in cultivated sunflower and a comparison to its wild progenitor, Helianthus annuus L.. Theor Appl Genet. 2011;123:693–704.
- Sharbel TF, Haubold B, Mitchell-Olds T. Genetic isolation by distance in Arabidopsis thaliana: biogeography and postglacial colonization of Europe. Mol Ecol. 2000;9:2109–2118.
- Zhu C, Gore M, Buckler ES, et al. Status and prospects of association mapping in plants. Plant Genome. 2008;1:5–20.
- Pritchard JK, Rosenberg NA. Use of unlinked genetic markers to detect population stratification in association studies. Am J Hum Genet. 1999;65:220–228.
- Mackay L, Powell W. Methods for linkage disequilibrium mapping in crops. Trends Plant Sci. 2007;12:57–63.
- Rafalski A, Morgante M. Corn and humans: recombination and linkage disequilibrium in two genomes of similar size. Trends Genet. 2004;20:103–111.
- Remington DL, Thornsberry JM, Matsuoka Y, et al. Structure of linkage disequilibrium and phenotypic associations in the maize genome. Proc Natl Acad Sci USA. 2001;98:11479–11484.