
 ?Mathematical formulae have been encoded as MathML and are displayed in this HTML version using MathJax in order to improve their display. Uncheck the box to turn MathJax off. This feature requires Javascript. Click on a formula to zoom.
ABSTRACT
The yeast (Saccharomyces cerevisiae) strain 2137 involved in lychee wine production was used to investigate acetate metabolism at different temperatures during lychee wine fermentation. Fermentation tests were conducted using lychee juice supplemented with acetic acid. The ability of yeast cells to metabolize acetic acid was stronger at 20 °C than at 25 °C or 30 °C. The addition of acetic acid suppressed the yeast cell growth at the tested temperatures. The viability was higher and the reactive oxygen species concentration was lower at 20 °C than at 30 °C; this result indicated that acid stress adaptation protects S. cerevisiae from acetic-acid-mediated programmed cell death. The acetic acid enhanced the thermal death of yeast at high temperatures. The fermentation temperature modified the metabolism of the yeasts and the activity of related enzymes during deacidification, because less acetaldehyde, less glycerol, more ethanol, more succinic acid and more malic acid were produced, with higher level of acetyl–CoA synthetase and isocitrate lyase activity, at 20 °C.
Introduction
Lychee (Litchi chinensis Sonn.) belongs to the Sapindaceae family and is commonly grown in the tropical to semi-tropical regions of the world. The lychee fruit has been gradually accepted by consumers for its rose-floral, citrus-like aroma and palatable sweet taste (sugar content ca.160 g/L).[Citation1] However, the postharvest pericarp browning of lychee fruit causes a rapid loss of shelf life and a reduced commercial value.[Citation2] Therefore, the production of fruit wine from lychee is an effective way to prevent wastage caused by the short shelf life of this fruit and to increase its economic value.[Citation3] The lychee wine industry has rapidly developed in China over the last decade.
Acetic acid is the main component of the volatile acidity of wine. However, excessive amounts of acetic acid affect negatively the quality of wine. Acetic acid can be formed as a bacterial or yeast metabolite at any time during lychee wine fermentation. It can also be produced through bacterial spoilage during Peronoplasmopara sp. and Oospora sp. infection. Similar to the phenomenon observed in grape, the rupture of the lychee pericarp, caused by pathogen infection or natural formation, allows Acetobacter sp. to access the inner portions of the lychee fruit and to use the ethanol produced by wild yeast as their preferred carbon source.[Citation4] As a result, the acetic acid concentration in lychee juice before fermentation can reach 1.0–2.0 g/L. Acetic acid can also be formed via the enzymatic reactions of citrate lyase, aldehyde dehydrogenase or acetyl kinase by yeast during alcoholic fermentation.[Citation5] The concentration of acetic acid produced during alcoholic fermentation may vary with the species and strain of the yeast, the composition of the juice and the physical factors. The acetic acid concentration in lychee wine is approximately 1.2 g/L,[Citation6] which is the current legislation limit. According to Ribéreau-Gayon et al.,[Citation7] when the acetic acid concentration exceeds 0.9 g/L, it can produce a noticeable bitter or sour aftertaste in wine.[Citation8] Thus, the excessive amounts of acetic acid should be removed to control the lychee wine quality.
Temperature plays an important role in wine making, because it affects yeast growth rate, fermentation rate and metabolism.[Citation9] The uptake of acetic acid into yeast cells is obviously important for promoting its degradation. The detailed mechanism of transport and catabolism of acetic acid in yeast with synthetic media has been published in the literature.[Citation10–13] The uptake and catabolism of acetic acid mainly depend on cellular membrane permeability and membrane permeases, which are highly temperature dependent, because changes in temperature can lead to conformational changes of the membrane protein structure.[Citation14]
The removal of excess acetic acid from wine and juice is achieved by the microbial stabilization of acidic wine followed by mixture with freshly crushed grape or must in a proportion of no more than 20%–30% (v/v), or by membrane processing, such as reverse osmosis (RO) and nanofiltration; re-fermentation is an alternative way to remove acetic acid from must and wine.[Citation7,Citation15,Citation16] However, the commercial value is reduced after microbial stabilization, RO and membrane filtration.[Citation17] Re-fermentation is carried out in very stressful conditions imposed by the combination of ethanol, acetic acid and SO2, which may lead to reduced cell growth, [Citation18,Citation19] induced cell death [Citation20] and incomplete fermentation.[Citation21–23]
S. cerevisiae can remove acetic acid and is used to eliminate excessive amounts of it as a practical approach during alcoholic fermentation.[Citation4] Nevertheless, changes in yeast acetic acid metabolism at different temperatures in lychee wine making has not been reported so far. Therefore, this study aimed to assess acetic acid removal by S. cerevisiae in lychee wine fermentation at 20–30 °C.
Materials and methods
Yeast strain
The strain used in this study was S. cerevisiae 2137, obtained from Guangdong Microbiology Culture Center. The yeast culture was stored at −80°C in yeast extract glucose medium (1% (w/v) glucose, 0.5% (w/v) yeast extract) supplemented with glycerol (30% (w/v)).
Preparation of lychee juice
Lychee fruits (L. chinensis Sonn. var. Jingcheng A4) were kindly provided by the Lu Qiao Agriculture Development Ltd., Co. (Hainan, China). Unhealthy fruits were discarded and the remaining fruits were washed with tap water. After treatment with 0.2% pectinase at 45 °C for 2 h, the pulp was manually extracted from the fruits. To reduce the microbial load without affecting the activity of fermentative yeasts and preventing oxidation reactions, 240 mg/L of potassium metabisulphite (K2S2O5) was added to the extracted juice. Food grade 50% (w/v) tartaric acid was added to adjust the pH to 3.5. Then the extracted juice was subjected to centrifugation at 12,000 rpm (13,200 × g; Cence Centrifuge, Xiangyi Instrument Ltd., Changsha, China) for 15 min at ambient temperature. The resulting supernatant was collected and used as fermentation medium with and without the addition of acetic acid. The juice was analysed before acetic acid addition; its composition was: 58.2 g/L glucose;121.3 g/L sucrose; 2.3 g/L fructose; 120 mg/L total SO2; 14 mg/L free SO2. After the medium was pasteurized at 100 °C for 15 min, acetic acid with a final concentration of 1.5 g/L was added to the lychee juice before yeast inoculation. The medium was inoculated at a concentration of 106 colony-forming units (CFU)/mL with a culture previously grown for 24 h at 25 °C in pasteurized lychee juice. The fermentation reactions were conducted from 0 to 240 h at 20, 25 and 30 °C without shaking in 250-mL flasks filled to 90% of their volume and covered with a polytetrafluoroethylene membrane (Shaanxi Tiangong, China). All fermentation reactions were performed in triplicate for each tested temperature; flasks filled with the inoculated medium without the addition of acetic acid were used as controls. Fermentation reactions were considered complete when the weight became constant. The duration of fermentation was recorded (h).
Measurement of viable yeast cells
Cells were harvested at specific time intervals by centrifugation (5000 rpm; 25 min), washed twice with distilled water and suspended in phosphate buffer saline (PBS, pH 7.02). The viable cells (viable cells/mL) were determined with the Muse® Count and Viability Kit and Muse® cell analyser according to the manufacturer's instructions. The time for reaching the maximum population (h) and the maximum population reached (viable cells/mL) were recorded. After centrifugation of each sample, the supernatant was used for metabolite analysis, as described below.
Sulphur dioxide determination
The sulphur dioxide was measured by an enzymatic kit (K-ETSULPH, Megazyme, Wicklow, Ireland).
Metabolite analysis
The glucose, fructose, sucrose, ethanol, acetaldehyde, acetic acid and glycerol concentrations (g/L) were measured by an enzymatic test (R-biopharm AG, D-64297 Darmstadt, Germany). Malic acid and succinic acid were measured by a high-pressure liquid chromatography system containing a diode array detector (Agilent, USA) and ZORBAX SB-Aq column (4.6 mm × 250 mm, 5 μm). The mobile phase was 0.01 mol/L NH4H2PO4 plus methanol (97:3). The operating conditions were 1.0 mL/min flow rate, 30 °C temperature, 210 nm wavelength and 10 μL injection volume. The metabolite product yield coefficients (Yp/s, mg/g) were calculated as follows [Citation24]:(1)
(1)
It is based on the assumption that the substrate denoted by S is consumed with a rate proportional to the rates of increase of the cells (X) and product (P) concentrations (g/L). The constant Yx/s is yield coefficient (g/g) that reflects the ratio of biomass obtained from the substrate consumed for its growth.
The metabolite product specific productivity QP (g/g/h) was calculated as follows:(2)
(2)
The maximum fermentation rate (g/g/h) was calculated as follows:(3)
(3)
Here μ and KS denote the specific biomass growth and substrate constant, respectively.
For the preparation of cell extracts, samples of the cultures in exponential growth phase were harvested by low-speed centrifugation at 2600 × g for 20 min and washed twice with 10 mmol/L potassium phosphate buffer (pH 7.5) containing 2 mmol/L ethylenediaminetetraacetic acid. The extracts were prepared by sonication at 0 °C for 3 s on-time pulse and 2 s off-time intervals with a 300 W sonicator (JYD, Shanghai, China). Before the assay, the samples were suspended in 100 mmol/L potassium phosphate buffer (pH 7.5), containing 2 mmol/L MgCl2 and 1 mmol/L dithiothreitol. Unbroken cells and debris were removed by centrifugation at 13,200 × g for 20 min. The supernatant was used as cell extract for the assays.
Enzyme activity assays
After the preparation of the extracts, according to the method of Postma et al. [Citation25] with minor modification in the buffer solution pH, enzyme activity was immediately assayed. Spectrophotometric assays were performed with an Evolution 300 spectrophotometer (Thermo Fisher, UK) at 340 nm and 25 C. The reaction velocities were proportional to the amount of enzyme added. The assay mixtures for the individual enzymes are described below.
Pyruvate decarboxylase (PDC; EC4.1.1.1) activity was determined from the soluble fraction of the cell lysate combined with 1 mol/L sodium pyruvate, 200 U/L alcohol dehydrogenase and 6.4 mmol/L β-nicotinamide adenine dinucleotide (NADH) in 200 mmol/L Tris-HCl buffer (pH 6.0) by measuring the conversion of NADH to NAD+ at 340 nm and 25 °C. One unit of activity was defined as the amount of activity required for the conversion of 1 μmol of NADH to NAD+ per minute.
Alcohol dehydrogenase (ADH; EC 1.1.1.1) activity was measured with a 3 mL mixture containing 1.5 mL of 0.05 mol/L sodium pyrophosphate buffer (pH 8.8), 0.5 mL of 96% ethanol, 0.1 mL of 0.025 mol/L NAD+ and 0.1 mL of the enzyme solution. The increased absorbance at 340 nm and 37 °C was recorded for 5 min. One unit of enzyme activity was defined as the amount of enzyme that caused a change of 0.001 in the absorbance per minute.
Acetaldehyde dehydrogenase (ALDH; EC 1.2.1.10) activity was assayed in a 3.0 mL reaction mixture with 0.3 mL of 1 mol/L Tris-HCl buffer (pH 8.0), 0.1 mL of 20 mmol/L β-NAD+, 0.05 mL of 100 mol/L acetaldehyde, 0.1 mL of 3 mol/L KCl, 0.03 mL of 1 mol/L dithiothreitol, 0.02 mL of 15 mol/L pyrazole and 0.1 mL of the crude enzyme. The absorbance was measured at 340 nm and at 25 °C. One unit of enzyme activity was defined as the amount of enzyme that caused a change of 0.001 in the absorbance per minute.
Acetyl–CoA synthetase (ACS; EC 6.2.1.1) was assayed according to the methods of Oh et al. [Citation26] and Macro et al. [Citation27] with slight modification. Briefly, the reaction mixture consisted of 0.3 mL of 0.1 mol/L Tris-HCl buffer (pH 7.7), 0.1 mL of 10 mmol/L L-malate (pH 7.0), 0.1 mL of 0.2 mmol/L CoA, 0.1 mL of 8 mmol/L adenosine triphosphate (ATP), 0.2 mL of 10 mmol/L MgCl2, 0.1 mL of malate dehydrogenase (3 U), 0.1 mL of citrate synthase (0.4 U), 0.1 mL of 100 mmol/L potassium acetate, 0.1 mL of 1 mmol/L β-NAD+ and 0.1 mL of the crude enzyme, with a final volume of 3.0 mL. The absorbance was measured at 340 nm and 25 °C.One unit of enzyme activity was defined as the amount of enzyme that caused a change of 0.001 in absorbance per minute.
Isocitrate lyase (ICL; EC 4.1.3.1) was assayed via the method of Dixon and Kornberg [Citation28] with slight modification. Briefly, the assay system included 1 mL of 0.05 mol/L Tris-HCl buffer (pH 7.7), 0.6 mL of 150 μmol/L MgSO4, 0.6 mL of 60 μmol/L cysteine HCl and 0.6 mL of 10 g/L phenylhydrazine-HCl in a final volume of 2.8 mL. The reaction was started by adding 0.2 mL of 7 mmol/L DL-isocitrate. The reaction mixture was incubated for 30 min at 30 °C. The blank tubes did not contain isocitrate. One unit of enzyme activity was defined as the amount of enzyme required to produce 1 μmol of glyoxylate per minute.
Protein content determination
The protein content was determined according to the dye-binding method of Bradford,[Citation29] with bovine serum albumin as the standard.
Determination of intracellular coenzymes contents
The intracellular contents of NADPH and NADP+ were determined enzymatically, as described by Nissen et al.[Citation30] The NADPH/NADP+ ratio was calculated from the measured NADPH and NADP+ content.
Measurement of reactive oxygen species (ROS)
Intracellular reactive oxygen species (ROS) were measured using the OxiSelect in Vitro ROS assay kit (Cell Biolabs Inc., San Diego, CA, USA), according to the manufacturer's instructions. The cells were harvested at exponential phase of fermentation, washed twice with cold PBS and lysed by sonication. Cell lysate (50 μL) was incubated with the non-fluorescent dichlorodihydrofluorescein (DCFH) DiQxyQ probe. ROS reacted with DCFH, which was rapidly oxidized to highly fluorescent 2',7'-dichlorodihydrofluorescein (DCF). DCF fluorescence was measured at an excitation wavelength of 480 nm and an emission wavelength of 530 nm. The ROS content in samples grown at 20 and 30 °C was determined by comparison with the hydrogen peroxide standard curve.
Data analyses
In all experiments, three replicates were obtained for measurements of metabolites and enzyme activity. Data were subject to analysis of variance (ANOVA) with SPSS version 13. Data in figures and tables are presented as mean values ± standard error.
Results and discussion
Effect of temperature on acetic acid removal and alcoholic fermentation
Few studies have analysed the effects of temperature on the acetic acid removal by S. cerevisiae during alcoholic fermentation.[Citation17] The present study found that temperature had a significant influence on acetic acid removal (P < 0.05). When 1.5 g/L of acetic acid was added to lychee juice, the alcoholic fermentation decreased the concentration of acetic acid ( and (a)). The amount of acetic acid eliminated during the alcoholic fermentation monotonically decreased with the increase of the temperature. At lower temperatures, more acetic acid was eliminated. For the sample with acetic acid supplementation and fermentation at 20 °C, the acetic acid concentration slightly changed prior to the middle of the exponential growth phase before it decreased. This decrease was more obvious for fermentation at 20 °C than at 25 or 30 °C. When the temperature was increased to 30 °C, the acetic acid concentration decreased very slowly, and acetic acid elimination during alcoholic fermentation was not sufficient to reach an acceptable level in the resulting lychee wine, according to the local legislation ((a)). The specific consumption rate of acetic acid decreased as the temperature increased; the fermentation rates at 20, 25 and 30 °C were 0.087, 0.071 and 0.062 g/g biomass/h, respectively (data not shown). Alcoholic fermentation was almost complete for each tested temperature, with a final sugar concentration of <4 g/L (), and its duration gradually decreased with the increase of the temperature (). The alcoholic concentration with acetic acid supplementation decreased with the increase of the temperature, which was related to the reduced use of substrates (data not shown).[Citation31] In our experiments, the sugar was almost completely used at high temperatures. The main cause of this reduction was probably the increased amount of products from other metabolic pathways, such as glycerol and lactic acid.[Citation32] An interesting point in the metabolic response of S. cerevisiae to acetic acid was the substantial increase in the final alcoholic concentration of samples supplemented with acetic acid. This result was not consistent with previous reports, which concluded that supplementation with acetic acid had no influence on the alcoholic concentration of fermented grape juice.[Citation4,Citation23] This discrepancy was probably caused by the different yeast strains used. A new possible explanation for this increase is the ability of S. cerevisiae to reduce excess acetate to acetaldehyde, which is converted into alcohol by alcohol dehydrogenases. Indeed, since acetaldehyde yield and ethanol-specific productivity are increased, it can be hypothesized that, following acetic acid addition, more acetaldehyde can be reduced into ethanol via alcohol dehydrogenases, leading to a higher ethanol concentration. Unfortunately, data supporting this hypothesis is not available.
Table 1. Changes in the acetic acid, alcohol and residual sugar levels during alcohol fermentation at different temperatures.
Figure 1. Effect of different fermentation temperatures on acetic acid concentration (a) and number of viable cells (b).
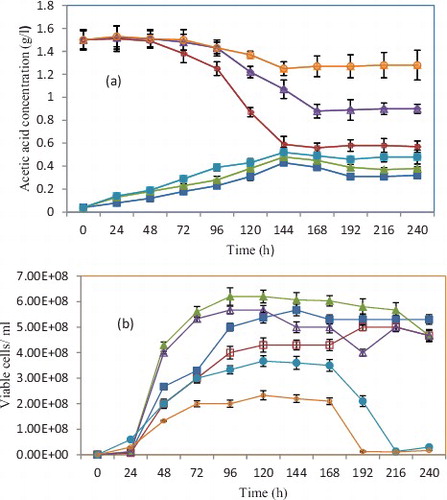
Table 2. Effect of different fermentation temperatures on the number of viable yeast cells, fermentation duration and fermentation rate.
Effect of fermentation temperature on yeast growth during deacidification
The effect of temperature on yeast growth during deacidification is shown in (b) and . Yeast growth was affected by temperature after acetic acid addition. The most obvious effects of fermentation at 20 °C were the increased maximum population reached, the lower maximum fermentation rate and the prolonged duration of fermentation, when compared with fermentation at 30 °C. Yeast quickly grew after 24 h of cultivation at 20 °C, thereby reaching a higher number of maximum viable cells (5.0 × 10⁸) than with fermentation at 30 °C (2.3 × 10⁸) (). At 30 °C, the exponential phase was relatively brief, but the viability began to decrease after entering the stationary phase. In particular, a high amount of yeast died at 30 °C and yeast mortality was even more obvious in the juice supplemented with acetic acid ((b)). These results are in agreement with the literature, which shows that the yeast viability decreases as the temperature and acetic acid concentration increase.[Citation4,Citation33,Citation34] This decrease was related to the increased stress caused by the intracellular accumulated ethanol and acetic acid at higher temperatures. This would lead to cell toxicity,[Citation31] structurally destabilize cytoplasmic, mitochondrial and endoplasmic reticulum membranes and decrease cell functionality.[Citation35] In contrast, the viability of yeast grown at 20 °C was more or less constant until the end of the fermentation. These effects might be related to the different compositions of the cell membrane, which was mainly attributed to the increase in unsaturated fatty acids of yeast cells, which improves ethanol and acid tolerance and increases cell viability.[Citation36] In the late stationary phase, the number of viable cells was slightly increased by supplementation with acetic acid. This result indicated that the yeast cells had adapted to the acetic acid stress at low temperatures.
Effect of fermentation temperature on metabolite production during deacidification
Yeast cells grow by consuming sugars and acetic acid to produce various metabolites. The effect of fermentation temperature on metabolite production during deacidification is shown in . The metabolic production of acetaldehyde, glycerol, succinic acid and malic acid, as well as the intracellular coenzyme ratio, was affected by the fermentation temperature after adding acetic acid. Fermentation at 20 °C with the addition of acetic acid produced more succinic acid, malic acid and coenzymes, and less acetaldehyde and glycerol than fermentation at 25 or 30 °C. The specific sugar uptake rate, as well as the specific production rate of glycerol, ethanol and acetaldehyde, significantly decreased with the decrease of the temperature after acetic acid addition.
Table 3. Metabolite product yield (mg/g hexose), specific productivity (g/g biomass/h) and intracellular coenzyme ratio during the exponential growth phase at different temperatures.
Intermediate metabolites, such as acetaldehyde, glycerol, succinic acid and malic acid, have important effects on the quality of lychee wine. Glycerol and succinic acid are the main secondary products of alcoholic fermentation by S. cerevisiae. The decreased glycerol yield after acetic acid addition could be partially explained by the decreased biomass. This observation was in agreement with the results of Pampulha and Loureiro-Dias, [Citation37] who found that the addition of acetic acid had similar effects on glycerol, in a way that the glycerol yield decreased, as the acetic acid concentration increased. In the present study, the glycerol production was much higher at 30 °C than at 20 °C in the controls and in the samples supplemented with acetic acid, which could be related to heat stress. Succinic acid is mainly formed via the reductive path of the tricarboxylic acid (TCA) cycle; this compound has an unusual salty and bitter taste, which could negatively affect wine quality.[Citation38] A significantly higher amount of succinic acid was produced in the lychee wine supplemented with acetic acid at all tested temperatures, when compared to the controls. Furthermore, lower temperatures produced higher succinic acid yield. The increased succinic acid yield and the higher NADPH/NADP+ ratio after acetic acid addition at low temperatures could be a result of more acetic acid being converted into acetyl–CoA and more citric acid entering the TCA cycle.
Effect of temperature on key enzymes activity during deacidification
Cells harvested from each of the exponential phase cultures were used to determine the activity of key enzymes in the metabolic pathways for acetic acid utilization and alcohol formation during cell growth in lychee juice. The selected enzymes were PDC, ADH, ALDH, ACS and ICL. The effect of different fermentation temperatures on the activity of those enzymes is shown on . The addition of acetic acid enhanced the PDC, ADH, ACS and ICL activity. The PDC and ADH activity first increased with increasing of the temperature and then decreased. ACS and ICL activity monotonically decreased with the increase of the temperature after acetic acid addition and reached the lowest levels of 2.12 and 0.12 U/mg protein, respectively, at 30 °C. The addition of acetic acid significantly suppressed ALDH activity, but the suppression weakened with the increase of the temperature. PDC catalyses the decarboxylation of pyruvate into acetaldehyde and carbon dioxide. Acetaldehyde is reduced to ethanol by ADH. Fermentation at 20 °C after the addition of acetic acid had relatively higher PDC and ADH activity than fermentation at 30 °C. This trend could be attributed to the higher PDC1 and ADH1 expression, which coincides with increased ethanol production. As the second enzyme of the PDH pathway, ALDH oxidizes acetaldehyde into acetic acid. The addition of acetic acid and the high temperature with lower ALDH activity caused more acetaldehyde accumulation. ACS catalyses the formation of acetyl–CoA from acetate. Two structural genes encoding ACS have been described, namely ACS1 and ACS2. Our results found that the ability of ACS to metabolize acetate was positively correlated with its activity. Fermentation at 20 °C had higher ACS activity and higher utilization of acetate than fermentation at 30 °C. This result could be attributed to the higher expression of ACS1, which contributed to the reduced acetate levels during fermentation at 20 °C.[Citation39] ICL catalyses the hydrolysis of isocitric acid into glyoxylic acid and succinic acid. During catalysis, isocitrate is deprotonated and aldol cleavage releases succinate and glyoxylate. Fermentation at 20 °C produced more glyoxylic acid (data not shown) and succinic acid after the addition of acetic acid, compared with fermentation at 30 °C. This difference was probably caused by acetic acid stress, which caused the higher ICL activity at 20 °C.
Table 4. Effect of fermentation temperature on the specific activity of PDC, ADH, ALDH, AC and ICL during the exponential growth phase.
Evolution of ROS
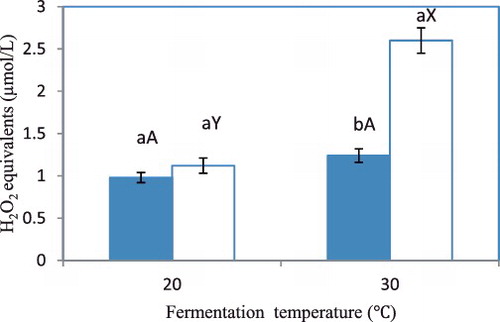
ROS are produced in yeast upon exposure to acetic acid and high temperatures.[Citation40,Citation41] ROS in S. cerevisiae at the exponential phase of fermentation during deacidification are illustrated in . The ROS content of the control cells harvested during exponential growth at 20 °C was not significantly different from that of cells cultivated at 30 °C. No significant differences were also found between the controls and the samples treated with 1.5 g/L acetic acid during fermentation at 20 °C. This result was in agreement with previous studies, which showed that the treatment of yeast cells with acetic acid did not increase the intracellular ROS production at low temperature.[Citation41,Citation42] A possible reason was that the cells had adapted to the acid stress at this temperature. However, the cells supplemented with 1.5 g/L of acetic acid and fermented at 30 °C showed markedly higher H2O2 equivalent concentrations compared with the controls and the cells fermented at 20 °C. This result indicated that ROS were formed under acetic acid stress at a higher rate, or that scavenging was reduced in the exponential phase, at 30 °C. ROS are neutralized in yeast cells by enzymatic and non-enzymatic processes. The non-enzymatic processes use NADPH as a source of reduction equivalents.[Citation43] The higher ROS content was probably caused by the lower NADPH levels for scavenging ROS at high temperatures. The higher ROS level may have ceased cell growth and terminated ethanol production before the amount of fermentative sugar was depleted.[Citation34]
Figure 2. ROS in S. cerevisiae during exponential phase of fermentation at different temperatures.
Acetic acid is a stress- and death-inducing agent, produced during alcoholic fermentation by S. cerevisiae.[Citation13] Previous reports showed that S. cerevisiae can undergo programmed cell death triggered by 20–80 mmol/L acetic acid.[Citation44–47] In the present study, we observed that acetic acid degradation by S. cerevisiae substantially decreased with the increase of the cultivation temperature (). The growth of S. cerevisiae was greatly suppressed by the addition of acetic acid at 30 °C ((b)), which coincided with increased ROS levels in the yeast cells (). Moreover, more cell debris was found, thereby indicating that most of the yeast cells lost their metabolic activity and cell membrane integrity at 30 °C. These results indicated that acetic acid stress enhances the thermal death of S. cerevisiae at high temperatures.
Conclusions
After fermentation at 20 °C, yeast cells exhibited higher acetic acid metabolic activity. At lower fermentation temperatures, the yeast cells had higher viability and produced less ROS, thereby indicating the adaptation to acid and ethanol stress. Acetic acid enhanced the thermal death of yeast at high temperatures. The fermentation temperature modified yeast metabolism and activity of related enzymes during acetic acid removal, because less acetaldehyde and glycerol, but more ethanol, succinic acid and malic acid were produced at lower temperatures. In addition, higher levels of ACS and ICL activity were observed at 20 °C. However, sensorial characterization of the aroma of lychee wine after deacidification requires further study.
Acknowledgments
The authors would like to acknowledge Lu Qiao Agriculture Development Ltd., Co. for generously supplying us with the lychee fruit needed for our experiments.
Disclosure statement
No potential conflict of interest was reported by the authors.
Additional information
Funding
References
- Ong PKC, Acree TE. Similarities in the aroma chemistry of Gewürztraminer variety wines and lychee (Litchi chinesis Sonn.) fruit. J Agric Food Chem. 1999;47:665–670.
- Alves JA, Lima LCD, Dias DR, et al. Effects of spontaneous and inoculated fermentation on the volatile profile of lychee (Litchi chinensis Sonn.) fermented beverages. Int J Food Sci Technol. 2010;45:2358–2365.
- Chen D, Chia JY, Liu SQ. Impact of addition of aromatic amino acids on non-volatile and volatile compounds in lychee wine fermented with Saccharomyces cerevisiae MERIT.ferm. Int J Food Microbiol. 2014;170:12–20.
- Vasserot Y, Mornet F, Jeandet P. Acetic acid removal by Saccharomyces cerevisiae during fermentation in oenological conditions. Metabolic consequences. Food Chem. 2010;119:1220–1223.
- Jost P, Piendl A. Technological influences on the formation of acetate during fermentation. Am Soc Brew Chem. 1975;34:31–37.
- Alves JA, Lima LCD, Nunes CA, et al. Chemical, physical–chemical, and sensory characteristics of lychee (Litchi chinensis Sonn) wines. J Food Sci. 2011;76(5):330–336.
- Ribéreau-Gayon P, Glories Y, Maujean A, et al. Handbook of enology. 2nd ed. Vol. 2, Alcohols and other volatile compounds. The chemistry of winestabilization and treatments. Chichester: Wiley; 2006. p. 51–64.
- Cordente AG, Cordero-Bueso G, Pretorius IS, et al. Novel wine yeast with mutations in YAP1 that produce less acetic acid during fermentation. FEMS Yeast Res. 2013;13(1):62–73.
- Fleet GH, Heard GM. Yeasts-growth during fermentation. In: Fleet GH, editor. Wine microbiology and biotechnology. Chur: Harwood Academic Publishers; 1993. p. 42–43.
- Casal M, Paiva S, Andrade RP, et al. The lactate-proton symport of Saccharomyces cerevisiae is encoded by JEN1. J Bacteriol. 1999;181:2620–2623.
- Mollapour M, Shepherd A, Piper PW. Presence of the Fps1 paquaglyceroporin channel is essential for Hog1p activation, but suppresses Slt2(Mpk1)p activation, with acetic acid stress of yeast. Microbiology. 2009;155:3304–3311.
- Hohmann, S. Control of high osmolarity signalling in the yeast Saccharomyces cerevisiae. FEBS Lett. 2009;583:4025–4029.
- Giannattasio S, Guaragnella N, Ždralević M, et al. Molecular mechanisms of Saccharomyces cerevisiae stress adaptation and programmed cell death in response to acetic acid. Front Microbiol. 2013;4: 33-1--7. doi: 10.3389/fmicb.2013.00033.
- Entian KD, Barnett J. Regulation of sugar utilization by Saccharomyces cerevisiae. Trends Biochem Sci. 1992;17:506–510.
- Fugelsang KC, Edwards CG. Wine microbiology. Practical applications and procedures. 2nd ed. New York: Springer Science Business Media; 2007.
- Vilela-Moura A, Schuller D, Mendes-Faia A, et al. Reduction of volatile acidity of wines by selected yeast strains. Appl Microbiol Biotechnol. 2008;80:881–890.
- Vilela-Moura A, Schuller D, Mendes-Faia A, et al. The impact of acetate metabolism on yeast fermentative performance and wine quality: reduction of volatile acidity of grape musts and wines. Appl Microbiol Biotechnol. 2011;89:271–280.
- Thomas S, Davenport RR. Zygosaccharomyces bailii, a profile of characteristics and spoilage activities. Food Microbiol. 1985;2:157–169.
- Pampulha MA, Loureiro-Dias MC. Combined effect of acetic acid, pH and ethanol on intracellular pH of fermenting yeast. Appl Microbiol Biotechnol. 1989;31:547–550.
- Pinto I, Cardoso H, Leão C, et al. High enthalpy and low enthalpy death in Saccharomyces cerevisiae induced by acetic acid. Biotechnol Bioeng. 1989;33:1350–1352.
- Rasmussen JE, Schultz E, Snyder RE, et al. Acetic acid as a causative agent in producing stuck fermentations. Am J Enol Vitic. 1995;46:278–280.
- Edwards CG, Reynolds AF, Rodriguez AV, et al. Implication of acetic acid in the induction of slow/stuck grape juice fermentations and inhibition of yeast by Lactobacillus sp. Am J Enol Vitic. 1999;50(2):204–210.
- Eglinton JM, Henschke PA. Restarting incomplete fermentations: the effect of high concentrations of acetic acid. Aust J Grape Wine Res. 1999;52:71–78.
- Kostov G, Popova S, Gochev V, et al. Modeling of batch alcohol fermentation with free and immobilized yeasts Saccharomyces cerevisiae 46 EVD. Biotechnol Biotechnol Equip. 2012;26(3):3021–3030.
- Postma E, Verduyn C, Scheffers WA, et al. Enzymic analysis of the Crabtree effect in glucose-limited chemostat cultures of Saccharomyces cerevisiae. Appl Environ Microbiol. 1989;55(2):468–477.
- Oh EJ, Bae YH, Kim, KH, et al. Effects of overexpression of acetaldehyde dehydrogenase6 and acetyl-CoA synthetase1 on xylitol production in recombinant Saccharomyces cerevisiae. Biocatal Agri Biotech. 2012;1:15–19.
- Marco AB, Gubbels PJ, Kortland CJ, et al. The two acetyl-coenzyme a synthetases of Saccharomyces cerevisiae differ with respect to kinetic properties and transcriptional regulation. J Biochem. 1996;271(46):28953–28959.
- Dixon GH, Kornberg HL. Assay methods for key enzymes of the glyoxylate cycle. Biochem J. 1959;72:195–198.
- Bradford MM. A rapid and sensitive method for the quantitation of microgram quantities of protein utilizing the principle of protein-dye binding. Anal Biochem. 1976;72:248–254.
- Nissen TL, Anderlund M, Nielsen J, et al. Expression of a cytoplasmic transhydrogenase in Saccharomyces cerevisiae results in formation of 2-oxoglutarate due to depletion of the NADPH pool. Yeast. 2001;18(1):19–32.
- Casey GP, Ingledew WM. Ethanol tolerance in yeasts. CRC Crit Rev Microb. 1986;13(3):219–280.
- Torija MJ, Rozès N, Poblet M, et al. Effects of fermentation temperature on the strain population of Saccharomyces cerevisiae. Int J Food Microbiol. 2003;80:47–53.
- Nagodawithana TW, Castellano C, Steinkraus KH. Effect of dissolved oxygen, temperature, initial cell count and sugar concentration on the viability of Saccharomyces cerevisiae in rapid fermentations. Appl Microbiol. 1974;28:383–391.
- Woo JM, Yang KM, Kim SU, et al. High temperature stimulates acetic acid accumulation and enhances the growth inhibition and ethanol production by Saccharomyces cerevisiae under fermenting conditions. Appl Microbiol Biotechnol. 2014;98:6085–6094.
- Lucero P, Peñalver E, Moreno E, et al. Internaltrehalose protects endocytosis from inhibition by ethanol in Saccharomyces cerevisiae. Appl Environ Microbiol. 2000;66(10):4456–4461.
- Alexandre H, Rousseaux I, Charpentier C. Ethanol adaptation mechanisms in Saccharomyces cerevisiae. Biotechnol Appl Biochem. 1994;20:173–183.
- Pampulha ME, Loureiro-Dias MC. Energetics of the effect of acetic acid on growth of Saccharomyces cerevisiae. FEMS Microbiol Lett. 2000;184(1):69–72.
- Ugliano M, Henschke P. Yeasts and wine flavor. In: Moreno-Arribas MV, Polo MC, editors. Wine chemistry and biochemistry. New York: Springer; 2009. p. 313–392.
- Remize F, Andriru E, Dequin S. Engineering of the pyruvate dehydrogenase by pass in Saccharomyces cerevisiae: role of the cytosolic Mg2+ and mitochondrial K+ acetaldehyde dehydrogenases Ald6p and Ald4pin acetate formation during alcoholic fermentation. Appl Environ Microbiol. 2000;66(8):3151–3159.
- Morano KA, Grant CM, Moye-Rowley WS. The response to heat shock and oxidative stress in Saccharomyces cerevisiae. Genetics. 2012;190:1157–1195.
- Guaragnella N, Antonacci L, Passarella S, et al. Hydrogen peroxide and superoxide anion production during acetic acid-induced yeast programmed cell death. Folia Microbiol. 2007;7:237–240.
- Giannattasio S, Guaragnella N, Corte-Real M, et al. Acid stress adaptation protects Saccharomyces cerevisiae from acetic acid-induced programmed cell death. Gene. 2005;354:93–99.
- Herrero E, Ros J, Belli G, et al. Redox control and oxidative stress in yeast cells. Biochim Biophys Acta Gen Sub. 2008;1780:1217–1235.
- Madeo F, Frohlich E, Frohlich KU. A yeast mutant showing diagnostic markers of early and late apoptosis. J Cell Biol. 1997;139:729–734.
- Madeo F, Frohlich E, Ligr M, et al. Oxygen stress: a regulator of apoptosis in yeast. J Cell Biol. 1999;145:757–767.
- Ludovico P, Sansonetty F, Silva MT, et al. Acetic acid induces a programmed cell death process in the food spoilage yeast Zygosaccharomyces bailii. FEMS Yeast Res. 2003;3:91–96.
- Ludovico P, Sousa MJ, Silva MT, et al. Saccharomyces cerevisiae commits to a programmed cell death process in response to acetic acid. Microbiology. 2001;147:2409–2415.