
ABSTRACT
Saccharomyces cerevisiae is an interesting micro-organism with good prospects in the future of yeast bioethanol production. In this study, both commercial and genetically modified S. cerevisiae were obtained from the local shops in Jeddah – Saudi Arabia and the Microbial Biotechnology Department – National Research Center (Dokki – Egypt) respectively, and incubated at 25 °C before being acclimatized for the conditions of this research.
In this work, the impact of two different biochemical conditions (fermentation periods and nitrogen source concentration) on the growth, carbohydrates yields, and mainly bioethanol productivity from potato peels wastes (PPW) were studied in both species. PPW were used as a solo carbon source in this study with HCl acidic pre-treatment method. When studying the impact of fermentation periods, the best fermentation periods were found to be between the third and the fourth day. Additionally, the optimal nitrogen source concentration added to the fermentation medium was 2 g/L.
This study concludes with some suggestions for future work in an attempt to reach commercial production of bioethanol at the lowest possible costs.
Introduction
The universal energy demand is contentiously increasing. This increase is one of the results of many critical factors such as the rapid rise in world population and industrialization. The standard sources of this energy are fossil fuels such as petroleum, nuclear, coal, natural gas and hydropower. According to the International Energy Agency, 80% of the world energy utilization is based on oil, coal and natural gas. The world oil demand is proposed to increase by 1.6% each year.[Citation1–3] One of the greatest challenges for society in the twenty-first century is that fossil fuels are depleting day by day and considered as limited and non-renewable energy. In addition, the availability of these non-renewable energy resources will certainly decline as a result of the increase in energy demands and the limitation of energy resources. According to Croockes et al.,[Citation4] the production of oil is expected to decline in the next 10–100 years.
Most studies in renewable energy fields focus on generating electrical power, while the major consumption of energy (about two thirds) comes from liquid form fuels. Amongst these alternatives is the production of biofuel (bioethanol) by fermentation process using renewable plant products.[Citation5]
Bioethanol
One of the biofuel examples is bioethanol which has been known as fuel vehicles since 1925.[Citation6] The most common countries which have the largest bioethanol production for this purpose are Brazil and USA [Citation7,Citation8] and it is expected it to be one of the potential renewable biofuels in the transport sector within next 20 years.[Citation9] Ethanol can be prepared by two major methods. First one is the synthetic process of ethanol production from petroleum. The other one is the microbial fermentation of carbohydrates depending on the existence of fermentable sugars (especially five-carbon and six-carbon sugars). Ethanol production using microbial fermentation consists of three major steps. Making a fermentable sugar solution is the basic step. Fermenting the sugars to form ethanol in the solution is the second step, done under special microbial conditions. Separating and purifying ethanol from the solution is the final step, which is usually achieved by distillation technique.[Citation8,Citation10–Citation15] The general conversion of sugars to ethanol through anaerobic microbial fermentation is shown in the following equation:
Bioethanol is an excellent alternative biofuel to fossil fuels, either as a pure fuel with high efficiency performance, blended with gasoline or as a gasoline additive.[Citation7,Citation11,Citation17]
Substrates for ethanol production
The production of bioethanol is performed on a commercial basis by two technological roadmaps, using directly fermentable sweet feedstocks, such as sugarcane which is produced mainly in Brazil [Citation18,Citation19] and sugar beets, or starchy feedstocks, such as corn which is produced in major proportions in USA and used in flexible-fuel vehicles.[Citation17,Citation20,Citation21] Maize [Citation22] and wheat starch must be converted into sugars before fermentation.[Citation23,Citation24] Additionally, there are other starchy materials that may serve as a source for bioethanol including cassava, rye, barley, tricilate, sorghum and potato.[Citation25–27] A third route, using the lignocellulosic biomasses available in materials such as bagasse and straw [Citation18,Citation28–34] which need hydrolysing the cellulosic chains in order to produce fermentable sugar solutions.
Hydrolysis ways
To convert starch into fermentable sugars, either acid hydrolysis or enzyme addition should be done. Both hydrolysis methods have disadvantages and advantages.[Citation5,Citation7,Citation35]
Micro-organisms can be used for ethanol production
The most frequently used micro-organisms for fermenting ethanol in industrial processes are Saccharomyces cerevisiae, Hanseniaspora uvarum and Starmerella bacillaris.[Citation36] Among the bacteria, Zymomonas mobilis can ferment glucose to ethanol with higher yields, due to the production of less biomass, but is less robust.[Citation37,Citation38] Pichia stipitis [Citation39], Kluyveromyces marxianus (ex fragilis) [Citation40], Aspergillus niger and Mucor mucedo are some of the other examples.[Citation15,Citation41,Citation42]
Potatoes
Currently, potatoes are alternative feedstocks for ethanol production. Minal and Deshpande [Citation43] stated that potatoes are the second most used food in the world. Potatoes are starchy crops, which do not require complex pre-treatments. Although, it is also a high value crop, from 5% to 20% ends as waste potato by-products from potato cultivation and could be utilized for bioethanol production.[Citation44,Citation45] Moreover, during potato processing, particularly in the potato chip industry, approximately 18% of the potatoes are generated as waste. Therefore, the waste from the potato industry can also be utilized as growth media (economical carbon source) for the fermentation processes in ethanol production, as it has high starch content. Potatoes are usually peeled during processing.[Citation5,Citation46,Citation47] Consequently, there is a pungent need to find an alternative productive use of the peels. One area of possibilities is to investigate the potential of potato peels wastes (PPW) for bioethanol production.[Citation48] Chips factories are one of the major examples of an alternative productive use of peels. PPW in term of proportions, they account in the range of 15%–40% from the total amount of potato which implemented depending on the procedure applied, steam, abrasion or lye peeling for instance. Precisely, the produced waste is around 90 kg/Mg which contains up to 50 kg of potato skins, 30 kg of starch and 10 kg of inert materials.[Citation48]
Ethanol production from waste potato is a relatively new topic and limited research has been conducted about the utilization of potato peel waste for ethanol production. This study aimed to explore some of the optimal conditions of biofuel (bioethanol) production by Sacaromices cervesia yeast (baker's yeast) from very cheap carbon source potato peels wastes (PPW). The impacts of fermentation periods and yeast extract concentrations were evaluated.
Materials and methods
Raw material
The potato peels wastes (PPW) were collected from a chips factory for the food industries.
Acid hydrolysis of potato peels wastes (PPW)
PPW were collected from local chips industries in Jeddah city (Saudi Snack Food Company Ltd (Lays)). PPW were dried at 80 ºC and powdered by blender. 0.5% hydrochloric acid HCl was added to the potato powder, the mixtures were then autoclaved at 121 °C, 21 psi for 15 min. Finally, the samples were cooled down and analysed for glucose concentration. The pH value of the clear filtrate was adjusted to approximately 6.0–6.5.
Micro-organisms
S. cerevisiae was obtained from Microbial Biotechnology Department – National Research Center (Dokki – Egypt). The strain was treated by UV to induce tolerance for the phenolic compounds. S. cerevisiae (commercial) was obtained from the public market in Jaddah (Saudi Arabia). Yeast strains were propagated.
Medium for culture and maintenance (g/L) (yeast medium, YM)
Yeast extract, 3; malt extract, 3; peptone, 3; glucose, 10; agar, 20; pH value was set at 6.5.
For purification of the commercial strain from bacterial contamination, antibiotic E-MOX was added and the solution was incubated for 24 hours at 30 °C.
Stock culture of both Saccharomyces cerevisiae strains were maintained on YM medium and stored at 4 °C. The culture was transferred once every 3 weeks to maintain good viability for ethanol production.
Inoculums medium (g/L)
Yeast extract, 5; malt extract, 5; meat extract, 5; NaCl, 1; pH value was set at 6.5.
Active growing cells from a newly prepared slant culture (24 hours, incubation period at 28 °C) were inoculated into 250 mL Erlenmeyer flasks containing 50 mL of the inoculums medium. The flasks were incubated with shaking at 180 r.p.m. for 24 hours at 28 °C in an incubator – shaker (Model: JSSI 200T-JSR).
Ethanol fermentation medium
The suggested protocol of production medium under fed-batch fermentation condition contained (g/L): yeast extracts (under concentrations variation mentioned in this study), K2HPO4, 1; KH2PO4, 1.2; MgSO4.7H2O, 0.5; NaCl, 0.5. Hydrolysed PPW were the principle solution for the medium. The medium was adjusted to pH 7.0 with 1M sodium hydroxide (NaOH). The medium was distributed in screw caps bottles (30 mL), then autoclaved at 121 °C for 15 min.
Effect of yeast extracts concentrations
Different concentration of yeast extracts ranged from (0, 2, 4, 5 and 8 g/L) and hydrolysed PPW were added to the fermentation medium. The fermentation was carried out at 30 °C for five days with 3 mL of inoculums. Ethanol content in fermented samples was estimated every 24 hours and every yeast extract concentration was done in triplicates.
Effect of period time of fermentation
The fermentation was carried out at 30 °C for five days with 3 mL of inoculums. Ethanol content in fermented samples was estimated every 24 hours of incubation for five days and the tests were done in triplicates.
Moisture analysis
To determine moisture in the potato mash, samples were weighed and the drying process was carried out at 105 ºC in an oven for 48 hours until the weight of samples stabilized.
Growth estimation
The growth of cells was estimated by measuring optical densities (ODs) of the yeast by UV-10 Shimadzu spectrophotometer. The absorbance of a mixture of 1 mL of fermentation medium and 1 mL of distilled water was measured at a wavelength of 600 nm. The blank was done by inoculated fermentation medium. The relationship between the optical density (OD) of yeast cells and its dry weight biomass was prepared through diluting a high biomass pellet of each yeast species into six different densities by adding distilled water 1–6 times, respectively. One millilitre of each new density was added into empty weighted Eppendorf tubes, and then the sample was nitrogen dried and weighted again. The differences between these two weights equal the dry mass weight, which were then used to draw the relation between dry biomass weight and the OD of each S. cerevisiae species.
Phenol sulphuric acid method
The phenol sulphuric acid method was used to estimate total carbohydrates.[Citation49]
Reagent
Phenol 5%: phenol (50 g) dissolved in water and diluted to 1 L. Sulphuric acid (96% reagent grade). Standard glucose: stock – 100 mg in 100 mL of water. Working standard – 10 mL of stock diluted to 100 mL with distilled water.[Citation49]
Procedure
One millilitre of sample solution containing 10–70 μg of sugar was pipetted into a colorimetric tube, and 1 mL of 5% phenol was added and mixed. Five millilitres of sulphuric acid was added from a fast flowing dispenser to each tube in order to produce good mixing and even heat. The contents of every tube were mixed and left to stand for 10 min, shaken and then placed in a water bath at 30 °C for 10 min. The absorbance of the golden yellow colour was read at a wavelength of 490 nm.
Dinitrosalicylic acid method
All reagent preparations and procedures were done according to Miller et al.[Citation50]
Reagents
Dinitrosalicylic acid reagent (DNS reagent): dissolved by stirring 40 g dinitrosaliscylic acid, 8 g phenol and 2 g sodium sulphite in 100 mL.
One percent of NaOH and 800 g Rochelle salt in 2 Lof 2% sodium hydroxide and then diluted to 4 L with distilled water.[Citation50]
Procedure
The extract in test tubes was pipetted out from 0.5 to 3 mL and the volume was equalized at 3 mL with water in all the tubes. Three millilitres of DNS reagent was added, and the contents were heated in a boiling water bath for 10 min. Cooling and reading the intensity of colour at 560 nm were done correspondingly. Running a series of standards using glucose (0–500 μg) and plotting a graph was done after that. Calculating the amount of reducing sugars present in the sample was done by using the standard graph.
Ethanol determination by gas chromatography
Ethanol production was estimated according to Doelle and Greenfield [Citation51] by detecting the ethanol concentration in each sample after fermentation under all biochemical conditions with gas chromatography (Agilent model headspace gas chromatography HS-GC-7890A) and Poropack Q as column material, nitrogen as carrier gas (12 mL/min), run time (4 min), 260 °C column temperature, 280 °C detector temperature and 35–250 °C injection port temperature. The theoretical ethanol yield was calculated assuming the conversion of all the hydrolysed sugars at the end of the run to ethanol.
Results and discussion
Estimation of moisture and ash content of PPW
shows the amount of moisture and ash content. The objective of these analyses was to utilize valuable compositions of potato peels wastes (PPW) in their production of ethanol by S. cerevisiae for both commercial and genetically modified species.
Table 1. Moisture content (%) and ash (%) of PPW.
When it comes to the fermentation process yeast is the most widely used organism. Simultaneous saccharification and fermentation process was used. In a single reactor, yeast is added along with the saccharifying enzymes which produce the glucose units and they were immediately converted into ethanol. In this way there were no chances of glucose accumulation and also the produced ethanol prevents microbial contamination.
The yield of ethanol was calculated using the following equation:
 [
[Ethanol was produced by S. cerevisiae from PPW. This study was designed to evaluate waste potatoes peels as a medium for ethanol production, but fermentation parameters were investigated as well. Acidic hydrolysis was used to obtain maximum glucose conversion, whereas nitrogen sources and fermentation periods were evaluated to optimize fermentation of ethanol. Because few studies were conducted on waste potatoes peels, this study provides information about the fermentation conditions of ethanol from waste potatoes peels by S. cerevisiae.
Effect of different fermentation periods and yeast extracts on ethanol production
Ethanol production during different fermentation periods at 0 g/L of yeast extract concentration
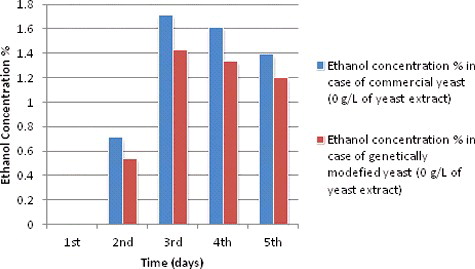
and show the ethanol production curves of both S. cerevisiae species during different fermentation periods starting from one day (24 hours) and ending with five days (120 hours). Ethanol production curves during fermentation period of one day with 0 g/L yeast extract concentrations showed none and weak production compared with other periods of fermentation. Consequently, the production showed a noticeable increase for both species from the second day (48 hours) of fermentation till it reached the highest recorded production in the log phase (the fourth day of fermentation). The reason for the continuous increase of yeast ethanol production is because every day yeast growth gets closer to the stationary phase when a limitation of nitrogen and other nutrients starts to occur. The ethanol production at 0 g/L of yeast extract during different fermentation periods showed a slight increase in the second day, then it continued increasing till the fourth day (96 hours) of fermentation where it start a steady phase for both species before it decreased to 1.39% and 1.2% for both species, respectively, in the last fermentation day at (120 hours) ().
Table 2. Ethanol production during different fermentation periods at 0 g/L of yeast extracts concentration and other experimental conditions and readings.
Figure 1. Ethanol production (%) during different fermentation periods at 0 g/L yeast extract concentration.
Ethanol production during different fermentation periods at 2 g/L of yeast extract concentration
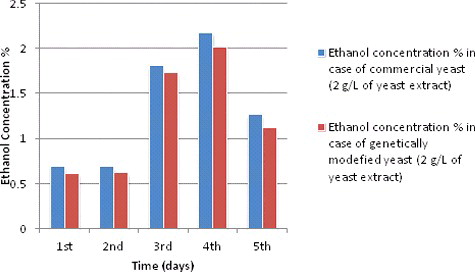
For the ethanol production curves at 2 g/L of yeast extract during different fermentation periods ( and ), ethanol production was in steady state between the first and second day for both species, however, it increased sharply between the third and fourth fermentation day to the highest production point (2.17%) for commercial species and (2.01%) for genetic modified species. Then it decreased to (1.26%) and (1.12%) for both species in the fifth day (120 hours), respectively. At yeast extract concentration of 2 g/L, the ethanol production curve () showed a strong increase to the highest ethanol production under 2 g/L at incubation time of 96 hours. In fact, this could be an interesting point about yeast behaviour under 2 g/L of yeast concentration during the different periods of fermentation; however, this is only one reading, which showed that the highest ethanol production occurred at the 96th hour of the fermentation and this is against suggested protocol of fermentation media content. Therefore, more experiments should be done around this point (between the third and fourth day of fermentation with 2 g/L of yeast extract) to find out if this value of ethanol production at 96 hours is right or not and to clarify the other production values around this point.
Table 3. Ethanol production during different fermentation periods at 2 g/L of yeast extracts concentration and other experimental conditions and readings.
Figure 2. Ethanol production (%) during different fermentation periods at 2 g/L yeast extract concentration.
Ethanol production during different fermentation periods at 4 g/L of yeast extract concentration
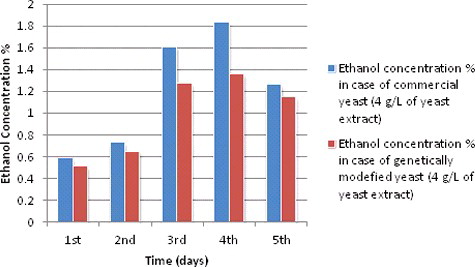
On the other hand, S. cerevisiae ethanol production curves for both species with 4 g/L of yeast extract during different fermentation periods ( and ) did seem to be greatly affected by the change in yeast extract. At 4 g/L yeast extract, ethanol production curves of S. cerevisiae for both species showed a slight decrease during all fermentation periods compared to the previous results. From the first day to the fourth day it increased to 1.83% and 1.36% for both species, respectively. At yeast extract concentration of 2 g/L, S. cerevisiae ethanol curve for both species behaved similar to the curve of 4 g/L, with higher ethanol production values. However, ethanol production under yeast extract of 2 g/L showed a strong behaviour, it increased dramatically to 2.17% and 2.01% for both species, respectively, at time point of 96 hours (fourth day) ().
Table 4. Ethanol production during different fermentation periods at 4 g/L of yeast extracts concentration and other experimental conditions and readings.
Figure 3. Ethanol production (%) during different fermentation periods at 4 g/L yeast extract concentration.
This highest production point can be a noteworthy part of future research. However, because this is against suggested protocol, it is important to find out if the ethanol production value at this point was correct or there was an error somewhere in the sample or data analyses. Studying more sampling points between 48 and 120 hours could give a clear view about this behaviour. Furthermore, this provides further evidence that the optimum fermentation period time for ethanol production of S. cerevisiae for both species is between 72 (third day) and 96 hours ( fourth day) and not 48 hours (second day) as what has been reported by Arapoglou et al.[Citation48]
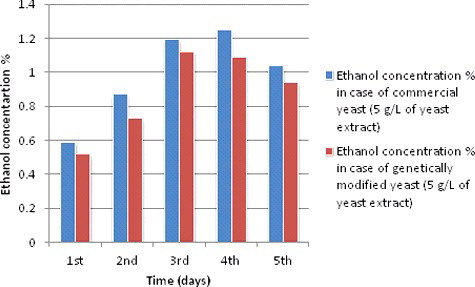
Ethanol production during different fermentation periods at 5 g/L of yeast extract concentration
and show the ethanol production curves of both S. cerevisiae species during different fermentation periods starting from one day (24 hours) and ending with five days (120 hours), but with 5 g/L of yeast extract concentration. Ethanol production curves during fermentation period of 24 hours showed a weak production compared to other periods of fermentation. Consequently, the production showed a noticeable increase for both species from the second day of fermentation till it reached the highest recorded production in the log phase (the fourth day of fermentation). The reason for the continuous increase of yeast ethanol production is because every day yeast growth gets closer to the stationary phase when a limitation of nitrogen and other nutrients start to occur. The ethanol production curves at 5 g/L of yeast extract during different fermentation periods showed a slight increase in the second day then, it continued to increase till the fourth day (96 hours of fermentation) where a steady phase starts for both species before it decreased to 1.39% and 1.2% for both species, respectively, in the final fermentation day – the fifth day (120 hours of fermentation time) ().
Table 5. Ethanol production during different fermentation periods at 5 g/L of yeast extracts concentration and other experimental conditions and readings.
Figure 4. Ethanol production (%) during different fermentation periods at 5 g/L yeast extract concentration.
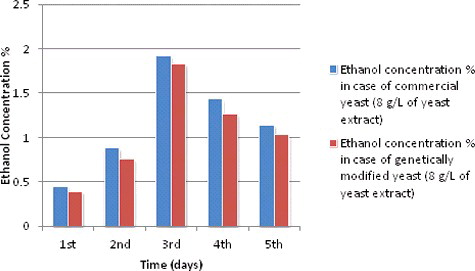
Ethanol production during different fermentation periods at 8 g/L of yeast extract concentration
The same previous patterns of ethanol production during different fermentation periods were shown in and with a slightly less ethanol production. Ethanol production has risen from the first day of fermentation from 0.45% and 0.39% to 0.88% and 0.76% at the second day of fermentation for both species, respectively. This increase continued with 1.92% and 1.83% at the third day for both species, respectively. Then they reached their highest ethanol production at the fourth day of fermentation with 1.44% and 1.26% for both species, respectively. This decrease could be due to a limitation of nitrogen and other nutrients which started to occur.
Table 6. Ethanol production during different fermentation periods at 8 g/L of yeast extracts concentration and other experimental conditions and readings.
Figure 5. Ethanol production (%) during different fermentation periods at 8 g/L yeast extract concentration.
By comparing different yeast extract concentrations on the ethanol production, this study found that S. cerevisiae can produce ethanol effectively with a minimum concentration of yeast extract of about 2 g/L. There are many reports that studied alternatives of this nitrogen source in respect to availability, cost and minimum concentration added to the fermentation medium. Graf-Sirakaya [Citation53] studied the effect of nitrogen sources for ethanol fermentation with S. cerevisiae in a chemically defined media to evaluate seven different animal by-products as a nitrogen source instead of yeast extract. Yeast extract compared with poultry meal, hulls and fines mix, beef stock, blood meal, feather meal, pork stock, meat and bone meal.[Citation53] Five of seven animal by-products could be alternative nitrogen sources for ethanol production instead of yeast extract, although all had lower production rate than the yeast extract which yielded 44.66 g/L ethanol. Among seven nitrogen sources studied: poultry meal, feather meal, pork stock, meat and bone meal, and hulls and fine mix, the yields were: 40.88, 42.16, 43.26, 43.06 and 37.14 g/L ethanol, respectively. Additionally, to evaluate the effect of the various nitrogen sources on ethanol fermentation using carob (a Mediterranean fruit) extract by S. cerevisiae was performed by Turhan.[Citation54] It was reported that meat and bone meal, feather meal, poultry meal, and hulls and fines mix were investigated as an alternative to yeast extract. Although, maximum production was determined with yeast extract addition (42.9 g/L), the other four nitrogen sources were still capable to be alternatives to yeast extract and yielded ethanol in a range of 39.88–41.90 g/L.[Citation54] Furthermore, Tropea [Citation55] studied the ethanol production by two S. cerevisiae strains with three different nitrogen sources cheaper than yeast extract. The study showed that the ethanol production elevated to 2.29% and 2.34% for both S. cerevisiae strains.
These previous records agreed with the current study in that using minimum nitrogen concentration in fermentation medium is more sufficient economically and in terms of availability. Moreover, ethanol production can be achieved with minimum nitrogen source concentrations either by using cheap sources or available expensive sources.
Conclusion
Most of the research objectives have been achieved successfully and the impacts of the other environmental conditions will be published later. However, there are some results that need to be retested and to be verified, and others to be completed.
It is recommended to have more sampling points in the fermentation periods from 48 to 96 hours at some experimental conditions for measuring S. cerevisiae ethanol productivity to verify the optimum fermentation period time.
This work showed that both commercial and genetically modified S. cerevisiae species investigated have a similar ability to produce bioethanol under all experimental conditions mentioned.
The major findings are related to the suitable environmental conditions for biofuel (bioethanol) production by S. cerevisiae yeast (baker's yeast) from very cheap carbon source – potato peels wastes (PPW) and could be reviewed as the following.
The possible best fermentation period was between 72 and 96 hours for both species under approximately all different yeast extract concentrations with the highest bioethanol production of around 2.17% and 2.01% for both commercial and genetically modified S. cerevisiae species, respectively.
The suitable yeast extracts were 2 g/L as the best minimum prepared concentration added to the fermentation medium. Consequently, the bioethanol production elevated to 2.83% and 2.64% for both commercial and genetically modified S. cerevisiae species, respectively.
Acknowledgments
The authors acknowledge the support of Biochemistry Department of the King Abdulaziz University in this research.
Disclosure statement
No potential conflict of interest was reported by the authors.
References
- International Energy Agency. Oil market report. 2003 [Retrieved 2013 Feb 21]. Available from: http://omrpublic.iea.org/omrarchive/13nov03full.pdf
- International Energy Agency. World energy outlook. 2011 [Retrieved 2013 Nov 8]. Available from: http://www.iea.org/publications/freepublications/publication/WEO2011_WEB.pdf
- International Energy Agency. Oil market report. 2012 [Retrieved 2013 Feb 21]. Available from: http://omrpublic.iea.org/omrarchive/13nov12full.pdf
- Croockes RJ. Comparative biofuel performance in internal combustion engines. Biomass Bioenergy. 2006;30:461–468.
- Hashem M, Darwish SMI. Production of bioethanol and associated by-products from potato starch residue stream by Saccharomyces cerevisiae. Biomass Bioenergy. 2010;34:953–959.
- Solomon BD, Krishna K. The coming sustainable energy transition: history, strategies and outlook. Energy Policy. 2011;39:7422–7431.
- Demirbas A. Biofuels sources, biofuel policy, biofuel economy and global biofuel projections. Energy Convers Manage. 2008;49:2106–2116.
- Demirbas A. Political, economical and environmental impacts of biofuels: a review. Appl Energy. 2009;86:108–117.
- Hahn-Hägerdal B, Galbe M, Gorwa-Grauslund MF, et al. Bio-ethanol – the fuel of tomorrow from the residues of today. Trends Biotechnol. 2006;24(12):549–556.
- Alonso-Pippo W, Luengo CA, Alberteris LAM, et al. Practical implementation of liquid biofuels: the transferability of the Brazilian experiences. Energy Policy. 2013;60:70–80.
- Demirbas A. Importance of biomass energy in Turkey. Energy Policy. 2008b;36:834–842.
- Demirbas A. Competitive liquid biofuels from biomass. Appl Energy. 2011;88:17–28.
- Demirbas A. Waste management, waste resource facilities and waste conversion processes. Energy Convers Manage. 2011;52:1280–1287.
- Hanh-hägerdal B, Gorwa-Grauslund F. Yeast optimization for fermenting C5 and C6 sugars. J Biotechnol. 2010;150(1):10–10.
- Sadeghinezhad E, Kazi SN, Sadeghinejad F, et al. A comprehensive literature review of bio-fuel performance in internal combustion engine and relevant costs involvement. Renew Sustain Energy Rev. 2014;30:29–44.
- Kun LY, editor. Microbial biotechnology: principles and application. Singapore: World Scientific Publishing Co. Pte. Ltd; 2003.
- Licht FO. The impact of biofuels on global feedstock markets. World Grain Mark Rep. 2008;4(8).
- Petrova P, Ivanova V. Perspectives for the production of bioethanol from lignocellulosic materials. Biotechnol Bioeng. 2010;24:529–546.
- Wheals AE, Basso LC, Alves DMG, et al. Fuel ethanol after 25 years. Tibtech. 1999;17:482–487.
- Licht FO. World ethanol & biofuels report. Kent: Agra Informa Ltd; 2008. Available from: http://www.agra-net.com/portal/
- Nalley L, Hudson D. The potential viability of biomass ethanol as a renewable fuel source: a discussion. Starkville, MS: Mississipi State University; 2003.(Staff Report, 003).
- Bothast RJ, Schlicher MA. Biotechnological processes for conversion of corn into ethanol. Appl Microbiol Biotechnol. 2005;67:19–25.
- Barber AR, Henningson M, Pamment NB. Acceleration of high gravity yeast fermentation by acetaldehyde addition. Biotechnol Lett. 2002;24:891–895.
- Wang S, Ingledew W, Thomas K, et al. Optimization of fermentation temperature and mash specific gravity for fuel alcohol production. Cereal Chem. 1999;76(1):82–86.
- Jansson C, Westerbergh A, Zhang J, et al. Cassava, a potential crop in (the) People's of Republic of China. Appl Energy. 2009;86:S95–S99.
- Lantero OJ, Main L, Shetty JK. Genencor International, Inc., assignee. Process for conversion of granular starch to ethanol. United States patent US 7,968,318B2. 2011 Jun 28.
- Zhan X, Wang D, Tuinstra MR, et al. Ethanol and lactic acid production as affected by sorghum genotype and location. Ind Crops Prod. 2003;18:245–255.
- Amrita R, Tanabe T, Watanabe T, et al. Methane fermentation of Japanese ceder wood pretreated with a white rot fungus, Ceriporiopsis subvermispora. J Biotechnol. 2006;123:71–77.
- Jørgensen H, Kristensen JB, Felby C. Enzymatic conversion of lignocelluloses into fermentable sugars: challenges and opportunities. Biofuel Bioprod Bior. 2007;1(2):119–134.
- Swain MR, Kar S, Sahoo AK, et al. Ethanol fermentation of mahula (Madhuca latifolia L.) flowers using free and immobilized yeast Saccharomyces cerevisiae. Microbiol Res. 2007;162:93–98.
- Thomsen AB, Thygesen A, Bohn V, et al. Effect of chemical-physical pre-treatment processes on hemp fibers for reinforcement of composites and for textiles. Ind Crops Prod. 2006;24:113–118.
- Wen-Hang C, Ting-Shiang L, Gia-Luen G, et al. Ethanol production from rice straw hydrolysates by Pichia stipitis. Energy Procedia. 2012;14:1261–1266.
- Wyman CE, Dale BE, Elander RT, et al. Coordinated development of leading biomass pretreatment technologies. Bioresour Technol. 2005;96:1959–1966.
- Cardona CA, Quintero JA, Paz IC. Production of bioethanol from sugarcane bagasse: status and perspectives. Bioresour Technol. 2010;101:4754–4766.
- Tasic MB, Konstantinovic BV, Lazic ML, et al. The acid hydrolysis of potato tuber mash in bioethanol production. Biochem Eng J. 2009;43: 208–211.
- Wang C, Esteve-Zarzoso B, Mas A. Monitoring of Saccharomyces cerevisiae, Hanseniaspora uvarum, and Starmerella bacillaris (synonym Candida zemplinina) populations during alcoholic fermentation by fluorescence in situ hybridization. J Food Microbiol. 2014;191:1–9.
- Galbe M, Zacchi G. A review of the production of ethanol from softwood. Appl Microbiol Biotechnol. 2002;59:618–628.
- Galbe M, Zacchi G. Pretreatment of lignocellulosic materials for efficient bioethanol production. Adv Biochem Eng Biotechnol. 2007;108:41–65.
- Kötter P, Ciriacy M. Xylose fermentation by Saccharomyces cerevisiae. Appl Microbiol Biotechnol. 1993;38:776–783.
- González Siso MI. The biotechnological utilization of cheese whey: a review. Bioresour Technol. 1996;57:1–11.
- Li H, Chai X, Deng Y, et al. Rapid determination of ethanol in fermentation liquor by full evaporation headspace gas chromatography. J Chromatogr A. 2009;1216:169–172.
- Oyeleke SB, Okansanmi TA. Isolation and characterization of cellulose hydrolysing microorganisms from the rumen of ruminants. Afr J Biotechnol. 2008;7(9):125–131.
- Minal D, Deshpande RS. Bio-fuel from cellulosic agricultural waste. Int J Chem Eng Res. 2010;2(2):197–217.
- Adarsha R, Asha DL, Balaji RR. Production of bio-ethanol from Pectobacterium carotovorum induced soft rotten potatoes. Afr J Microbiol Res. 2010;4(12):1340–1342.
- Liimatainen H, Koukkanen T, Kaariainen J. Development of bio-ethanol production from waste potatoes. Oulu: Oulu University Press; 2004. p. 123–129.
- Yamada S, Shinomiya N, Ohba K, et al. Enzymatic hydrolysis and ethanol fermentation of by-products from potato processing plant. Food Sci Technol Res. 2009;15(6):653–658.
- Hermiati E, Mangunwidjaja D, Sunarti T, et al. Potential utilization of cassava pulp for ethanol production in Indonesia. Sci Res Essays. 2012;7:100–106.
- Arapoglou D, Varzakas Th, Vlyssides A, et al. Ethanol production from potato peel waste (PPW). Waste Manage. 2010;30:1898–1902.
- Dubois M, Gilles KA, Hamilton JK, et al. Colorimetric method for determination of sugars and related substances. Anal Chem. 1956;28:350–356.
- Miller GL, Slater R, Birzgalis R, et al. Applications of different colorimetric tests to cellodextrins. Anal Biochem. 1961;2:521–528.
- Doelle H, Greenfield PF. The production of ethanol from sucrose using Zymomonas mobilis. Appl Microbiol Biotechnol. 1985;22:405–410.
- Meenakshi A, Kumaresan R. Ethanol production from corn, potato peel waste and its process development. J Chem Tech Res. 2014;6:2843–2853.
- Graf-Sirakaya B, Demirci A. Industrial grade media evaluation for ethanol fermentation with Saccharomyces cerevisiae. Paper presented at: Proceedings of The Huck Institutes of Life Sciences. Crossover Symposium on Bioenergy; 2004 Sep 4–5; PA, USA: Pennsylvania State University, University Park.
- Turhan I, Bialka KL, Demirci A, Karhan M. Ethanol production from carob extract by using Saccharomyces cerevisiae. Bioresour Technol. 2010;101(14):5290–5296.
- Tropea A, Wilson D, Cicero N, et al. Development of minimal fermentation media supplement for ethanol production using two Saccharomyces cerevisiae strains. Nat Prod Res. 2015;30(9):1009–1016.