
ABSTRACT
DNA sequence analysis of the nuclear ribosomal internal transcribed spacer (ITS) region was exploited for its applications in the authentication of Sauropus androgynus (L.) Merr. as raw-material herbal medicine and supplement. Leaf samples from 12 different geographic locations in Indonesia were collected. Twelve DNA sequences from the samples were analysed. The sequences were trimmed before sequence alignment. The sequences ranged from 626 to 664 bp in length after trimming. Based on the multiple sequence alignment, a phylogenetic tree was generated using the MrBayes program. It consisted of two groups: one group comprised sequences from Trawas and the other one comprised sequences from Batu, Trawas and Surabaya. These results strongly suggest that ITS sequence analysis is a valuable tool for distinguishing intraspecific differences among S. androgynus cultivars from Indonesia.
Introduction
Sauropus androgynus (L.) Merr., originally described as Clutia androgyna Linnaeus [Citation1], is a South-East Asian indigenous plant belonging to the Euphorbiaceae family, widely cultivated for traditional medicinal purposes [Citation2]. Indonesian people traditionally use S. androgynus (commonly known as ‘katuk’, ‘sweet shoot leaves’ and ‘star gooseberry’) for increasing human breast milk production. The dark green leaves have various nutritive values and are commonly used for human consumption in South-East Asia. The leaves of S. androgynus are effective as an antioxidant [Citation3–5]. Several studies report positive antioxidant activity of S. androgynus. For example, Andarwulan et al. [Citation5] found that it has the highest flavonoid content among 11 vegetables of Indonesian origin. Rahmat et al. [Citation3] showed that the antioxidant activity of fresh and boiled shoot samples of S. androgynus was higher than that of alpha-tocopherol. S. androgynus has also been reported to have significant antimicrobial activity against Klebsiella pneumoniae and Staphylococcus aureus [Citation6]. Yu et al. [Citation7] showed that an isolated compound from S. androgynus extract has a potential to become an antiobesity agent by reducing the body weight of Wistar male rats.
Accurate identification of herbal medicine species is a prerequisite for chemical and pharmacological investigation. At present, S. androgynus is identified using morphological characters or based on its phytochemical content, such as rutin. However, these approaches are inappropriate because the morphological characters of this plant are not specific and rutin concentration largely varies in many other plant species. Given the difficulties in distinguishing this plant, there is a need to establish a reliable method for its authentication of the plant as a raw material. One of the most reliable methods for identification of herbal medicine materials is DNA analysis based on three types of techniques: polymerase chain reaction (PCR), hybridization and sequencing [Citation8,Citation9].
The sequences of the internal transcribed spacer (ITS) regions of nuclear ribosomal DNA are frequently used for molecular identification of crude herbs. Nuclear ribosomal genes in plant genomes are constituted of individual 18S − 5.8S − 26S tandem repeats, which make this region easy to amplify. The ITS regions in angiosperms vary within approximately 500–700 bp in length [Citation10].
Phylogenetic studies have shown the close relationship between Phyllanthus niruri and S. androgynus based on several DNA regions such as ITS, matK, PHYC, accD-psal, trnS-trnG [Citation11–15]. S. androgynus ITS (ITS1 + 5.8S + ITS2) ranges from 557 to 599 bp, whereas the ITS region DNA sequence alignment is reported to be 708 bp long [Citation14].
In this study, we investigated the intraspecific differences among S. androgynus accessions from Indonesia revealed based on the variability of the ITS region. To the best of our knowledge, this is the first report showing sequence analysis of the ITS region of S. androgynus cultivars from different geographic locations in Indonesia.
Materials and methods
Plant materials
Fresh leaves of S. androgynus were used as materials. The accessions and locations are listed in . All the samples were authenticated by the Center of Information and Development of Traditional Medicine (PIPOT), Faculty of Pharmacy, University of Surabaya, East Java, Indonesia. Young green leaves of S. androgynus were collected, washed, mopped dry and quickly stored at −80 °C until use.
Table 1. Samples of Sauropus androgynus used in DNA sequence analysis.
DNA sequencing and analysis
Total DNA was isolated from leaf samples of S. androgynus using NucleoSpin® Plant II, according to the manufacturer's instructions. The ITS regions were amplified by using primers of ITS-5 (5′-TAGAGGAAG GAGAAGTCGTAACAA-3′) and ITS-4 (5′-CCCGCCTGACCTGGGGTCGC-3′). In the PCR, the DNA was pre-denatured at 95 ºC for 2 min, cycled 35 times at 95 °C for 30 s, 57 °C for 1 min and 71 °C for 2 min in a T100 PCR thermal cycler (BioRad, Hercules, CA, USA). The final extension cycle allowed an additional incubation for 5 min at 71 °C. The PCR products were visualized by 2% agarose gel electrophoresis under ultraviolet (UV) light to check the presence of amplified bands using gel documentation system Universal Hood II (BioRad). The ITS region of each sample was sequenced in a DNA sequencer (Applied Biosystems 3730XL, Foster City, CA, USA). Purification and sequencing of ITS rDNA was conducted by Macrogen (Seoul, Korea). ITS sequences of S. androgynus were retrieved from GenBank and analysed together with the sequences acquired in the present study. The ClustalW method was used to align the DNA sequences after generation of the .ab1 files. The sequences had been checked and trimmed before being aligned. Chromatograms were analysed with FinchTV. Analysis of nucleotide sequences was done using BLAST (Basic Local Alignment Search Tool, http://ncbi.nlm.nih.gov/blast) to search for highly similar sequences in the National Center for Biotechnology Information (NCBI) database.
Phylogenetic analysis
Phylogenetic analysis and phylogenetic tree construction were done using the MrBayes 3.2 program based on Bayesian inference using the Markov Chain Monte Carlo (MCMC) method. Bayesian inference and MCMC used for phylogenetic construction were considered computationally more efficient than the standard maximum likelihood method [Citation16].
Results and discussion
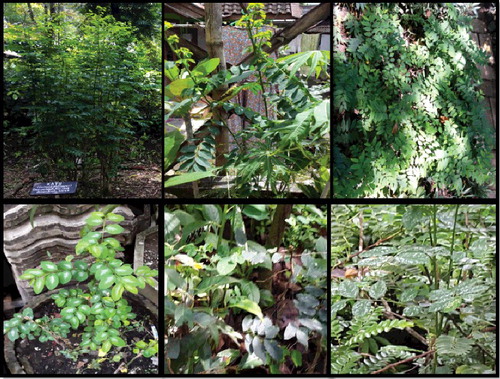
The studied samples were collected from various locations with different geographic conditions, including lowland (Surabaya), midland (Trawas) and highland (Batu) areas (, ). All samples were similar based on their morphological characters.
Figure 1. Sauropus androgynus from several locations in East Java, Indonesia.
In this study, PCR and DNA-sequencing methods were used to obtain the ITS sequences of S. androgynus accessions from several different geographic locations in East Java, Indonesia, and these sequences were compared to GQ503380.1, and annotated in NCBI as a reference sequence. The ITS region is characterized by moderate variability, which is why it is mainly used for the identification of species and varieties. To perform a comparative analysis of the ITS nucleotide sequences of all samples, BLAST analysis was performed. The electrophoresis patterns of the ITS fragments amplified using the ITS-4 and ITS-5 primers showed that these primers could clearly amplify particular DNA fragments. PCR amplification using these primers specifically recognized the ITS region, as demonstrated by the agarose gel electrophoresis results. shows that a single clearly amplified band of ∼700 bp was generated from all samples.
Figure 2. PCR amplification products of ITS of S. androgynus from 12 locations. Lane 1, U1-B; Lane 2, U1-C; Lane 3, U2; Lane 4, U3; Lane 5, U1-A; Lane 6, P1; Lane 7, DNA marker 100 bp ladder (Promega, Madison, WI, USA); Lane 8, K; Lane 9, SB; Lane 10, ST; Lane 11, B1; Lane 12, B2; Lane 13, B3.
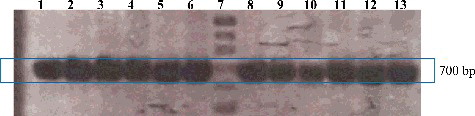
The ITS regions of the 12 samples were shown to range from 626 to 664 bp in size. The average length of the sequences obtained using the ITS-4 and ITS-5 primers was 655.8 and 655.1 bp, respectively. The sequences of all samples showed high-quality chromatograms.
Nucleotide sequence analysis of the ITS region of the studied S. androgynus samples was done with known DNA sequences in the NCBI databases. When the homologous nucleotide sequences of each sample were analysed using BLAST (), the results showed that all sequences from the samples of S. androgynus had 94%–99% similarity with the S. androgynus voucher Telford & Brubl 13056 (GQ503380.1), with the only exception of the sequence from Surabaya Timur (ST). There was no significantly similar sequence for ST because it did not meet the default threshold of NCBI's BLAST algorithm, but there were some similar sequences which gave 76% similarity with the S. androgynus 18S ribosomal RNA gene (EU623563.1).
Table 2. Homology search of S. androgynus accessions in the NCBI database.
shows multiple sequence alignments of the ITS regions from the 12 samples of S. androgynus by the ClustalW method. The results showed that S. androgynus from ST had a unique base-pair variation which could distinguish it from the other 11 samples despite the fact that they share many morphological similarities.
Figure 3. Multiple sequence alignment of ITS regions from 12 samples of S. androgynus (ClustalW).
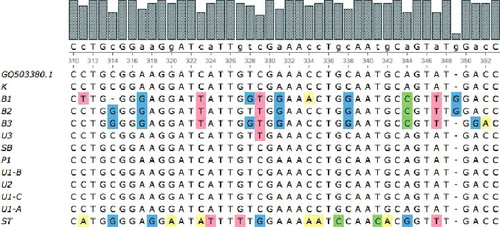
The multiple sequence alignment was done by comparison to a chosen reference sequence, GQ503380.1, which has the topmost identity values based on the NCBI's BLAST searches of the 12 ITS-4 primer samples. The multiple sequence alignment of the fragments amplified using the ITS-5 primer was also compared to this reference sequence. All ITS-4 primer samples showed good matches with GQ503380.1. The multiple sequence alignment of the ITS-5-generated fragments gave several gaps, some from the insertion of samples from U3 and U1-C. The conserved regions in the ITS-5-based multiple sequence alignment were less than those based on the ITS-4-based multiple sequence alignment.
For construction of a phylogenetic tree guided by parsimony values, the MrBayes method was used in a number of recent studies [Citation17,Citation18]. For building the phylogenetic tree, only the sequences generated using the ITS-4 primer were used because the multiple sequence alignment showed that all sequences obtained with this primer were more conserved than those amplified with the ITS-5 primer.
The dendrogram presented in shows that the samples from the 12 different geographic locations were divided into two groups reflecting the relationships between the genetic characteristics and geographical distribution. The samples from the highland region (Batu), B1, B2 and B3, were shown to be related to each other. They formed the first group, with U3 from Trawas and SB from Surabaya. The second group included the samples P1, U1-B, U2, U1-C and U1-A, which are from the same region, midland (Trawas). Interestingly, one sample from Trawas (U3) showed close relationship with the samples from Batu and was away from its original group of midland regions. These sequence variations might be due to intraspecies polymorphism; however, more detailed investigations are needed to explain the reasons behind this polymorphism.
Figure 4. Phylogenetic tree of 12 samples of S. androgynus based on the nucleotide sequence of the ITS locus.
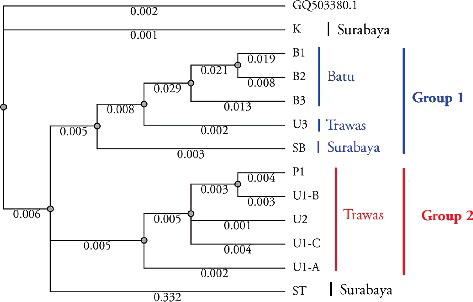
The samples from Surabaya (ST, SB, K) did not show close relationship. This observation is in accordance with the study of Yunita and Sulisetiorini [Citation19], who reported the same results based on random amplified polymorphic DNA analysis of the ITS region of S. androgynus leaves from Surabaya. Asmarayani and Pancoro [Citation20] revealed that the process of wide domestication could cause high variation in ITS sequences because human interference in plant domestication could result in botanical evolution diversity. Genetic variation can be indirectly caused by dispersal by humans, while these variations may occur due to the ability of plants to survive by adapting to their environment, breeding and passing their genes onto the next generation. The similar morphological characters of the studied S. androgynus samples demonstrated that some alteration in the DNA nucleotide bases may not directly change the morphological characters of the plants. Thus, the use of ITS region sequences would be able to better distinguish any intraspecific differences among S. androgynus cultivars. The results from this study showed that ITS sequence analysis could be developed as a reliable method for authentication of S. androgynus as a raw material in the herbal medicine industry.
Conclusions
To the best of our knowledge, this is the first report showing sequence analysis of the ITS region of S. androgynus cultivars from different geographic locations in Indonesia. The obtained results showed that the ITS sequence provides a good and reliable indicator for geographical origin. This strongly suggests that ITS sequence analysis is a valuable tool for distinguishing the genetic relationship among the cultivars of S. androgynus.
Additional information
Funding
References
- Bingtao L , Gilbert MG . Sauropus. In: Bingtao L , Huaxing Q , Jinshuang M et al. , editors. Euphorbiaceae. Flora of China. Vol. 11. St. Louis ( MI ): Missouri Botanical Garden Press; 2008. p. 202.
- Bunawan H , Bunawan SN , Baharum SN , et al. Sauropus androgynus (L.) Merr. induced bronchiolitis obliterans: from botanical studies to toxicology. Evid Based Complement Alternat Med [Internet]. 2015 [cited 2016 Feb 15];2015:714158. Available from: http://www.hindawi.com/journals/ecam/2015/714158/
- Rahmat A , Kumar V , Fong LM , et al. Determination of total antioxidant activity in three types of local vegetable shoots and the cytotoxic effect of their ethanolic extracts against different cancer cell lines. Asia Pac J Clin Nutr. 2003;12:292–295.
- Benjapak N , Swatsitang P , Tanpanich S . Determination of antioxidant capacity and nutritive values of Pak-Wanban (Sauropus androgynus L. Merr.). KKU Sci J. 2008;36:279–289.
- Andarwulan N , Batari R , Sandrasari DA , et al. Flavonoid content and antioxidant activity of vegetables from Indonesia. Food Chem. 2010;121:1231–1235.4
- Paul M , Anto KB . Antibacterial activity of Sauropus androgynus (L.) Merr. Int J Plant Sci. 2011;6(1):189–192.
- Yu SF , Shun CT , Chen TM , et al. 3-O-β-D-glucosyl-(1→6)-β-D-glucosyl kaempferol isolated from Sauropus androgynus reduces body weight gain in Wistar rats. Biol Pharm Bull. 2006;29:2510–2513.
- Yip PY , Chau CF , Mak CY , et al. DNA methods for identification of Chinese medicinal materials. Chin Med [Internet]. 2007 [cited 2016 Feb 15];2:9. Available from: http://cmjournal.biomedcentral.com/articles/10.1186/1749-8546-2-9
- Joshi K , Chavan P , Warude D , et al. Molecular markers in herbal drug technology. Curr Sci. 2004;87(2):159–165.
- Alvarez I , Wendel JF . Ribosomal ITS sequences and plant phylogenetic inference. Mol Phylogenet Evol. 2003;29:417–434.
- Samuel R , Kathriarachchi H , Hoffman P , et al. Molecular phylogenetics of Phyllanthaceae: evidence from plastid matK and nuclear PHYC sequences. Am J Bot. 2005;92(1):132–141.
- Kathriarachchi H , Samuel R , Hoffmann P , et al. Phylogenetics of tribe Phyllantheae (Phyllanthaceae; Euphorbiaceae Sensu Lato) based on nrITS and plastid matK DNA sequence data. Am J Bot. 2006;93(4):637–655.
- Hidayat T , Kusumawaty D , Kusdianti , et al. Analisis Filogenetik Molekuler pada Phyllanthus niruri L. (Euphorbiaceae) Menggunakan Urutan Basa Daerah internal transcribed spacer (ITS) [Molecular phylogenetic analysis of niruri Phyllanthus L. (Euphorbiaceae) using internal transcribed spacer (ITS) region DNA sequence]. Jurnal Matematika dan Sains. 2008;13(1):16–21. Indonesian.
- Pruesapan K , Telford IRH , Bruhl JJ , et al. Delimitation of Sauropus (Phyllanthaceae) based on plastid matK and nuclear ribosomal ITS DNA sequence data. Ann Bot. 2008;102:1007–1018.
- Pruesapan K , Telford IRH , Bruhl JJ , et al. Phylogeny and proposed circumscription of Breynia, Sauropus and Synostemon (Phyllanthaceae), based on chloroplast and nuclear DNA sequences. Aust Syst Bot. 2012;25:313–330.
- Ronquist F , Huelsenbeck JP . MrBayes 3: Bayesian phylogenetic inference under mixed models. Bioinformatics. 2003;19(12):1572–1574.
- Ronquist F , Teslenko M , van der Mark P , et al. MrBayes 3.2: efficient Bayesian phylogenetic inference and model choice across a large model space. Syst Biol. 2012;61:539–542.
- Tong YG , Shi WF , Liu D , et al. Genetic diversity and evolutionary dynamics of Ebola virus in Sierra Leone. Nature. 2015;524:93–96.
- Yunita O , Sulisetiorini . DNA fingerprinting on ITS region of Sauropus androgynus ’ nrDNA from East Java, by random amplified polymorphic DNA method. In: Scheer H , Pradhan B , Brotosudarmo THP , editors. International Conference on Natural Sciences. Proceedings; 2011 July 9–11; Batu. Aachen : Shaker Verlag; 2013. p. 251–257.
- Asmarayani R , Pancoro A . Phylogenetic study of Piper L. (Piperaceae) based on ITS regions of nrDNA. Floribunda. 2005;2(8):202–208.