
ABSTRACT
To evaluate the phylogenetic relationships among subtribe Pyrinae of Rosaceae, 50 different genotypes and cultivars of pome fruit trees were collected from various locations in Iran, and analysed using random amplified polymorphic DNA (RAPD) markers. Altogether, 85 polymorphic fragments were produced by 11 random 10-mer primers. The number of produced bands varied from 4 to 12 for each primer, 7.72 on average. The lowest Jaccard's genetic similarity coefficient was scored between apple cv. ‘Akan’ and a wild Pyrus syriaca pear (0.04), and the highest similarity was observed between two genotypes of P. syriaca (0.97). Cluster analysis using the unweighted pair group method with arithmetic mean (UPGMA) properly separated the accessions and divided them into three major groups, including Malus, Pyrus, Mespilus and Crataegus. Members of Mespilus and Crataegus were further separated and formed two subgroups. Analysis of the genetic structure, using STRUCTURE and phylogenetic relationship using TreeView software confirmed the results of the UPGMA dendrogram and properly distinguished different genera. Among different genera studied in our experiment, Malus was the most distinct one and showed high genetic distance from other genera. Generally, the results from the present study provide valuable information about the genetic relationship among important pome fruit trees in Iran and indicate that, although Mespilus is genetically close to the Crataegus genus, it has relatively high similarity with Pyrus and Malus. Moreover, outcomes of this research confirmed that RAPD molecular markers are an appropriate means for evaluation of the genetic relationship among various genera of pome fruit trees.
Introduction
Rosaceae is one of the diversified and big families of plants that include many important plant species such as some economically important fruit trees. This family comprises over 100 genera and 3000 species and is the third most economically important plant family in temperate regions [Citation1–3]. In the past, four main subfamilies in the Rosaceae family used to be considered: Rosoideae, Prunoideae, Spiraeoideae and Maloideae [Citation4]. However, recent molecular studies have suggested three subfamilies in this family, which include Dryadoideae, Rosoideae and Spiraeoideae [Citation5]. In the new classification, pome fruit trees including Malus spp., Prunus spp. and Crataegus spp. are placed in the subfamily Spiraeoideae, tribe Pyreae and subtribe Pyrinae [Citation6]. Pome fruit trees have complex taxonomy and phylogeny owing to the sexual compatibility between different genera, the high mutation frequency, the wide distribution and the long history of cultivation. In addition to being part of the genesis of the Pyreae, hybridization is unusually common among genera of Pyrinae [Citation6]. Inter-generic hybridization of Pyrinae has been reported [Citation7]. It is also reported that some of these hybrids are highly fertile and appear frequently in nature [Citation8].
Polymerase chain reaction (PCR)-based DNA markers are versatile tools in different aspects of genomic studies. By using DNA molecular markers, it is possible to analyse closely related genera in order to evaluate their phylogenic relationships. Random amplified polymorphic DNA (RAPD) enables a survey of different loci simultaneously [Citation9]. RAPD markers have been extensively used to analyse different aspects of plant genomes, including evaluation of genetic diversity [Citation10], construction of genetic maps [Citation11], marker-assisted selection [Citation12], identification of progenies of cross pollination [Citation13], population structure [Citation14] and also phylogeny studies of different related species and genera [Citation15]. These multilocus markers are not only simple, fast and sensitive, but also universal, which makes them useful for comparing different related genera and species at DNA level. They require no prior knowledge of DNA sequence and can amplify a large number of DNA fragments in each reaction. RAPD markers have been successfully used to evaluate relationships at or above the section level in several genera, including Oryza [Citation16], Medicago [Citation17], Rosa [Citation18], Lycopersicon [Citation19], Beta [Citation20], Barbus [Citation21], Citrus [Citation22–24], Allium [Citation25], Phyllanthus [Citation26], Asparagus [Citation27], Melon [Citation28] and Amaranth [Citation29]. In each case, the RAPD-derived phylogenies have been found to be in good agreement with those produced using other methods, and most of these reports suggest that RAPD markers are reliable tools for assessment of genetic diversity, analysis of parentage and revealing phylogenetic relationships among various species.
Iran is one of the seven centres of plant origin and diversity in the world and is considerably rich in plant genetic resources. Iran is close to the diversity centre of pome fruits and is considered as home to one of the important genetic resources for these fruit trees in the world [Citation30]; meanwhile, there is no accurate information about genetic relationships across different wild and cultivated accessions of different pome fruit trees in this country. Iran has a rich germplasm of pome fruit trees such as apple (Malus spp.), pear (Pyrus spp.), hawthorn (Crataegus spp.) and medlar (Mespilus germanica L.), which include native genotypes and cultivars, introduced cultivars as well as wild forms that might be obtained naturally through seed propagation or hybridization. Obtaining sufficient information in this area can increase our knowledge of the relationships as well as geographical origin of these fruit trees and might be useful for germplasm conservation and utilization in the breeding programmes.
The aim of the present study was to investigate at the molecular level some of the cultivars and genotypes of pome fruit trees representing different genera and species to obtain more information about the genetic relationships of different pome fruit trees.
Materials and methods
Plant materials
Fifty cultivars, genotypes and wild types of fruit species in the subtribe Pyrinae were selected from different parts of Iran. These plants include European pear (Pyrus communis), Asian pear (P. serotina), wild pear (P. glabra, P. syriaca), apple (Malus pumila), hawthorn (Crataegus pontica, C. monogyna and C. pentagyna) and common medlar (M. germanica) ().
Table 1. Studied genotypes and cultivars with their collection area.
Genomic DNA extraction
Genomic DNA was extracted from young leaves based on the modified cetyltrimethylammonium bromide buffer [Citation31]. DNA quantity and quality was determined using spectrophotometer (Perkin Elmer, Lambda EZ201, Texas City, Texas, USA) at 260 and 280 nm, and confirmed by comparative analysis with the intensity of standard DNA after electrophoresis in ethidium bromide stained 1% agarose gel. After pre-screening of random primers, eleven 10-mer primers were used in this study (). The reaction solution consisted of 3 μL (10 ng/μL) template DNA, 2 μL (10 pmol/μL) of 10-mer random primer, 7 μL PCR master mix of Cinagen, Tehran, Iran (containing 3 mmol/L MgCl2, 1.6 mmol/L deoxyribonucleoside triphosphates, 0.2 U/μL Taq DNA polymerase) and 3 μL ddH2O, making a total volume of 15 μL. Amplification reactions were carried out in a thermocycler (iCycler, Bio Rad, Hercules, CA, USA) as follows: initial pre-denaturation step at 94 °C for 5 min, followed by 35 cycles of 1 min at 94 °C, 1 min at 37 °C and 1 min at 72 °C, and a final extension at 72 °C for 7 min. After amplification, 5 μL of loading buffer was added to each PCR product and finally 12 μL of this mixture was separated by gel electrophoresis in 1.5% agarose, stained by ethidium bromide and visualized under ultraviolet light (Gel document, UviTec, Warwickshire, United Kingdom).
Table 2. Sequence of RAPD primers and calculated genetic indices based on information obtained from studied samples.
Data analysis
Only distinct, reproducible and well-resolved amplified fragments were scored as RAPD markers. The presence (1) and absence (0) of each polymorphic band with similar size were scored for data analysis. The sizes of produced fragments were defined by comparing to a molecular size marker (Gene Ruler 1 kb DNA ladder, SM0318, Fermentas Co., Hanover, New Hampshire, USA). The ability of the primers to differentiate among accessions was assessed using the resolving power coefficient (RP) [Citation32], which has been described to strongly correlate with the ability of loci to distinguish between accessions.
NTSYS software (version 2.02) was used to estimate genetic similarities using Jaccard's similarity coefficient [Citation33] and to construct the dendrogram on pair-wised genetic similarity of genotypes using the unweighted pair group method with arithmetic mean (UPGMA). The cophenetic correlation coefficient was calculated to check the goodness of fit between cophenetic matrix and original similarity matrix on which it was based.
As a data reduction, and to obtain a better understanding of the genotypes relationship, principal component analysis (PCA) was conducted by NTSYS software (version 2.02). TreeView software was used to infer relationship among different accessions and to construct the phylogenetic tree using 1000 bootstrap replicates [Citation34].
Bayesian assignment was used to determine the genetic structure of all samples, using STRUCTURE 2.3.4 [Citation35]. An admixture model was used to cluster the samples (K) based on allele frequencies [Citation36]. Under this model, an individual's probability of assignment to each cluster (Q) can be interpreted as the proportion of that individual's genome that originated in each cluster [Citation35]. The numbers of burn-in and Markov chain Monte Carlo runs were 10,000 and 100,000, respectively. Ten replications (runs) were performed for each possible value of K (K = 1 to K = 10). The results from STRUCTURE were processed with the software STRUCTURE HARVESTER v.0.6.1 [Citation37] to obtain the most likely K value.
Results and discussion
Genetic analysis of samples using RAPD primers
Eleven RAPD primers were used to analyse 50 samples of apple, pear, hawthorn and medlar. All of the primers were highly polymorphic and produced 85 clear and reproducible fragments (7.72 bands per primer) (). The number of amplified fragments ranged from 4 to 12 and the sizes were 115 to 2800 bp. This value is higher than previous reports on genetic diversity studies using RAPD markers in pome fruit trees [Citation38–41]. It is not surprising because previous studies focused on samples belonging to a specific genus, while we used different genera in our experiment.
Customprimer produced the highest number of polymorphic fragments (12 bands), whereas the OPB-143 primer gave the lowest one (four bands). The number of effective fragments ranged from 2.66 (OPB-143) to 9.03 (Customprimer) with a mean of 5.9. The average value of RP was 0.45 across all loci and this index varied from 0.24 (OPA-05) to 0.60 (OPA-16). The polymorphic information content (PIC) value ranged from 0.44 (OPB-143) to 0.80 (Customprimer) with a median of 0.67.
A similarity matrix was calculated according to the Jaccard's coefficient. The average genetic similarity among the studied samples was 0.46, with values ranging from 0.04 to 0.97. Two wild pear samples (both from P. syriaca species) collected from Halilan (No. 13 and No. 14) showed the highest degree of similarity (0.97), while apples cv. ‘Akan’ (No. 1) had the lowest similarity with a wild pear (No. 14) at the studied loci.
The dendrogram constructed using the UPGMA method is shown in . The cophenetic correlation coefficient between the original similarity matrix and the dendrogram cophenetic matrix was found to be significantly high (r = 0.99, P < 0.01), indicating that the cluster analysis strongly represents the similarity matrix.
Figure 1. Dendrogram obtained from cluster analysis of samples from Rosaceae family based on Jaccard's similarity coefficient and UPGMA method.
According to the derived UPGMA dendrogram (), the 50 studied accessions were clearly separated based on their phylogenetic similarities. As it is obvious from the dendrogram, all samples were divided into two main groups at the highest distance (0.04). Samples belonging to the Malus genus were deposited in the first group, which indicates that members of this genus have lower genetic similarity with other studied pome fruits. Morphological and biochemical evidence also reflects the fact that the Malus genus has somewhat lower similarities with other pome fruit trees analysed in this work. For instance, the grafting compatibility between Pyrus spp. and Crataegus spp. is higher than that between Pyrus spp. and Malus spp. In this group, the apple cv. ‘Fuji’ had the largest difference from other apple cultivars and was separated from the rest. The second main group included samples from the Pyrus, Mespilus and Crataegus genera. At a genetic distance of 0.14, all of the species from the Pyrus genus were separated from those of the Mespilus and Crataegus genera and formed a distinct subgroup. In this subgroup, wild forms were clearly separated from the European and Asian pears. In the Pyrus subgroup, four Asian pears as well as ‘Sebri’ cultivar were grouped together. All of these samples have obvious differences in the fruit and leaf attributes compared to the wild forms of P. communis and were separated from other members of this genus. In comparison to other species analysed in this study, the cultivars belonging to P. serotina were completely different and had larger leaves with deep serrated edges. Two wild species of Pyrus, P. glabra and P. syriaca were also separated from P. communis and were deposited in a different branch. Thorny branches, small fruits as well as leaves are the prominent traits of these species. Samples from Mespilus and Crataegus were also separated at a distance of 0.47. These observations suggest that Mespilus and Crataegus have the highest genetic similarity among the studied samples and these two genera have higher similarity to members of Pyrus compared to the Malus genus. Our results are in agreement with the results from the molecular analysis by Lo and Donoghue [Citation3], who observed that genus Pyrus had higher similarity to Cotoneaster and Sorbos and these three genera were separated from genus Malus. In their study, Crataegus also showed high similarity to Mespilus and both were completely separated from the Pyrus and Malus genera [Citation3]. Preliminary biochemical analysis of leaf phenolic compounds in combination with isoenzymes and botanical studies suggests that pome fruit trees have an alloploid origin [Citation41]. This theory suggests that this amphidiploid subfamily is a combination of two Rosaceae subfamilies, including Prunoideae having eight chromosomes and Spiraeoideae with nine chromosomes, which successfully fertilized each other [Citation41]. Most species in this subfamily are diploid (2n = 2x = 34) and a few are polyploid [Citation41,Citation42].
High level of heterozygosity among cultivars, climate variety and hybridization are the main factors that diversify genotypes and species [Citation43]. Three species of hawthorn were analysed in our study: C. pentagyna, C. monogyna and C. pontica. As seen from the dendrogram, the members of the Crataegus genus were divided into two subgroups at a distance of 0.76 and samples of C. pentagyna were separated from C. monogyna and C. pontica.
PCA analysis
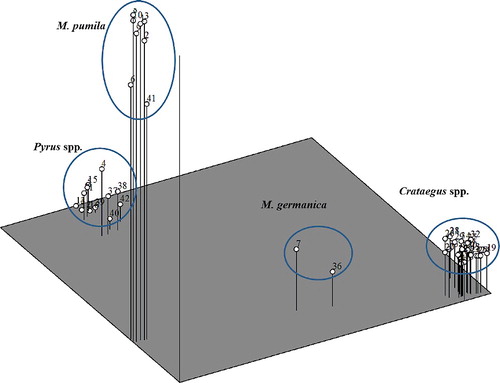
PCA analysis revealed that about 69.46 of the genotypic variance could be captured with three eigenvectors (). The first component captured most of the variance (46.82%), while the second and the third components accounted for 13.13% and 9.50% of the variation, respectively. A three-dimensional plot of the first three eigenvectors divided the samples into three main groups (). These results are in accordance with the UPGMA clustering and four distinct genera were separated. The largest group included samples from the Crataegus genus. Two Mespilus accessions (No. 7 and No. 36) were separated and formed a distinct group. All Pyrus samples were clearly separated from other genera. Malus accessions formed a distinct group and members of this genus were also separated from other samples based on the third eigenvector. According to Sneath and Sokal [Citation44], PCA cannot properly differentiate closely related genotypes, but in our study, since the studied samples belonged to different species and genera, PCA truly separated the accessions according to their botanical similarities and showed its usefulness for discrimination among different genera. With regard to the fact that the studied samples were collected from different regions, genera and species, the geographical locations did not affect the clustering.
Table 3. Eigen values, variance and cumulative variance obtained from seven main factors in diversity analysis in Rosaceae family.
Figure 2. TriPlot obtained from PCA analysis of all samples showing genetic differences of different genera of pome fruit trees from Iran.
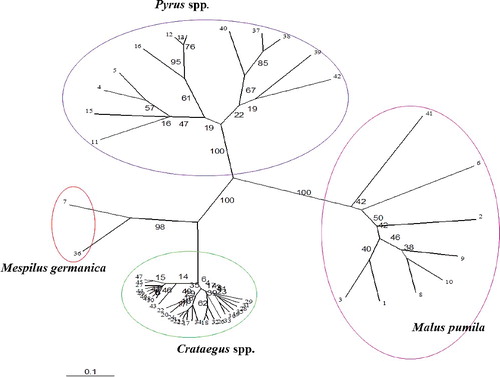
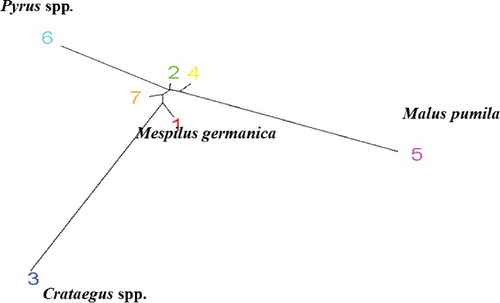
The phylogenetic cluster of different pome fruit trees using TreeView software completely separated different genera (). According to this cluster, Mespilus and Crataegus had the highest similarity, and different species from Crataegus were clearly separated and grouped together. In addition, the Pyrus group was subdivided into three clear subgroups including European pear, Asian pear and wild forms. Surprisingly, the ‘Sebri’ cultivar from Iran clustered with the Asian pear subgroup. ‘Sebri’ is one of the most important pear cultivars in Iran, and based on the results of some morphological studies, it is very likely that this cultivar belongs to the Asian pears of P. serotina [Citation45]. Using morphological and microsatellite molecular markers, Erfani et al. [Citation46] reported that this cultivar is probably a hybrid between P. pyrifolia and Iranian cultivars of P. communis. According to their results, this cultivar showed 41%–51% similarity to different accessions of P. pyrifolia. Moreover, Chamberlain and Hubert [Citation47] reported that phenotypical differences might be determined by relatively few genes which could not be reflected in the molecular results.
Figure 3. Phylogenetic tree of different genera based on banding pattern from random primers using TreeView software.
Population genetic structure
Clustering of samples using STRUCTURE software was conducted without considering primary information about genera and species as well as sampling sites. In this analysis, each individual is shown by a vertical line that is assigned to different coloured segments according to its estimated membership probabilities (Q). In fact, we conducted this analysis to estimate the per cent of membership of each accession in different genera. According to the statistical model described by Evanno et al. [Citation36], a clear peak (ΔK = 49.62) was obtained at the value K = 2, while the second peak was obtained at K = 7 (ΔK = 11.58). The estimated subpopulations for the 50 samples are shown in (a). Of the 50 pome fruit tree samples, 48 shared over 90% membership with one of the two main clusters and were classified as members of that cluster. The lowest Q value was observed for samples No. 7 (0.56) and No. 36 (60.37) both from the Mespilus genus, which showed admixture of two main subclusters. The first cluster consisted of all samples from the Malus and Pyrus genera. All Crataegus samples were classified as cluster 2.
Figure 4. Grouping of samples using STRUCTURE software based on K = 2 (A); based on K = 7 (B).
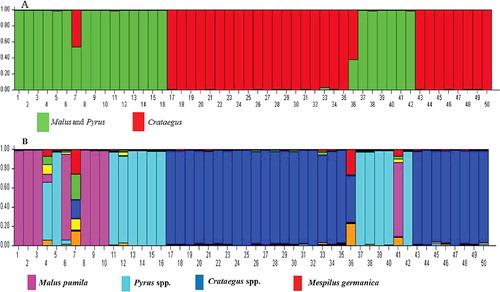
Although the highest ΔK was obtained at K = 2, there were important substructures within the two main groups and also STRUCTURE HARVESTER showed the second clear peak at K = 7 ((b)). It is reported that the statistical approach of Evanno et al. [Citation36] may be problematic, as in most cases it represents K = 2 as the most likely number of clusters [Citation48]. Therefore, the data were also analysed based on the formation of seven subgroups ((b)). According to the seven-substructure analysis, the samples from different genera were completely separated. Out of the 50 studied samples, four accessions (two from Mespilus and two from Pyrus) had a Q value below 90% and were admixtures. The largest group in this cluster included different species of the Crataegus genus. These analyses indicated that, although Mespilus showed the highest genetic similarity to Cratageus, this genus has some common genetic background with three other genera in this study and might be the branching point for development of different pome fruit trees. Moreover, in this analysis, pear cv. ‘Duchesse’ and apple cv. ‘Fuji’ showed a high level of admixture and had large differences from other members of their species. It is reported that the pedigree of ‘Duchesse’ pear is not clear [Citation49]. In addition, the pattern of phylogenetic distribution of different genera in this investigation based on RAPD markers clearly revealed the differences between the studied genera (). In this cluster, samples from the Malus and Pyrus genera were placed at opposite ends of an axis that reflects the differences between them. Samples from Crataegus were also positioned at the end of an axis perpendicular to the main axis and made the third angle of a triangle. Mespilus samples were placed at the intersection of the three aforementioned genera but oriented to the Crataegus genus, which reflects its higher similarity to this genus compared to the other studied genera. All of the species belonging to a genus are able to cross-pollinate, because there is no great barrier for their crossing. Hybridization between different species and gene introduction from one species to another may affect the evolution of species [Citation50]. The relationships within Pyrinae, however, are uncertain, possibly because the evolution of this group may have involved processes that can confound phylogenetic inference [Citation6]. Four processes that could have occurred in the Pyrinae are inter-generic hybridization, rapid and ancient radiation, slow divergence and gene duplication followed by paralog extinction [Citation6]. Our results indicated that RAPD markers can be successfully used to study the molecular relatedness among pome fruit tree species, supporting previous reports on the successful applications of RAPD markers for evaluation of inter-species and genera relationships, such as Citrus [Citation23,Citation24], Rosa [Citation18], Melon [Citation28] and Amaranth [Citation29].
Figure 5. Similarity between different genera studied in this experiment based on banding pattern from random primers using STRUCTURE software.
Conclusions
According to the results from this study, RAPD molecular markers proved a suitable tool for evaluation of the genetic relationships among pome fruit trees belonging to related species and genera. Overall, the genetic diversity among different genotypes and cultivars of pome fruit trees was high. Of the studied primers, Customprimer and OPA-16 showed the highest PIC and resolving power, respectively, and are recommended for evaluation of genetic relationships in pome fruit trees. The evaluation of the genetic relationships among the studied samples revealed that hawthorn and medlar have the highest similarity at the DNA level and hence are closely related. The Pyrus genus was more similar to these two genera and Malus had high genetic differentiation with Crataegus and Mespilus genera. Also, Mespilus was shown to have relatively high similarity with Pyrus and Malus and may be an intermediate genus between the studied genera. Altogether, the obtained results provide valuable information about the genetic relationships among important pome fruit trees of Iran. Iran has a rich germplasm of pome fruit trees; therefore, it is recommended to carefully consider the existing accessions in order to select the valuable genotypes and establish fruit tree collections.
Disclosure statement
No potential conflict of interest was reported by the authors.
Additional information
Funding
Related Research Data
References
- Dirlewanger E, Cosson P, Tavaud M, et al. Development of microsatellite markers in peach [Prunus persica (L.) Batsch] and their use in genetic diversity analysis in peach and sweet cherry (Prunus avium L.). Theor Appl Genet. 2002;105:127–138.
- Shulaev V, Korban SS, Sosinski, B, et al. Multiple models for Rosaceae genomics. Plant Physiol. 2008;147:985–1003.
- Lo EYY, Donoghue MJ. Expanded phylogenetic and dating analyses of the apples and their relatives (Pyreae, Rosaceae). Mol Phylogen Evol. 2012;63:230–243.
- Potter D, Gao F, Bortiri PE, et al. Phylogenetic relationships in Rosaceae inferred from chloroplast matK and trnLtrnF nucleotide sequence data. Plant Syst Evol. 2002;231:77–89.
- Potter D, Eriksson T, Evans RC, et al. Phylogeny and classification of Rosaceae. Plant Syst Evol. 2007;266:5–43.
- Campbell CS, Evans RC, Morgan DR, et al. Phylogeny of subtribe Pyrinae (formerly the Maloideae, Rosaceae): limited resolution of a complex evolutionary history. Plant Syst Evol. 2007;266:119–145.
- Robertson KR, Phipps JB, Rohrer JR, et al. A synopsis of genera of the Maloideae (Rosaceae). Syst Bot. 1991;16:376–394.
- Nelson-Jones EB, Briggs D, Smith AG. The origin of inter mediate species of the genus Sorbus. Theor Appl Genet. 2002;105:953–963.
- Williams JG, Kubelik AR, Livak KJ, et al. DNA polymorphisms amplified by arbitrary primers are useful as genetic markers. Nucleic Acids Res. 1990;18:6531–6535.
- Zarei A, Zamani Z, Fatahi Moghadam MR. Evaluation of genetic relationships among some Persian cultivated and a wild pomegranate accessions using RAPDs and SSRs molecular markers. Hortic Environ Biotechnol. 2009;50:224–232.
- Liebhard R, Koller B, Gianfranceschi L, et al. Creating a saturated reference map for the apple (Malus × domestica Borkh.) genome. Theor Appl Genet. 2003;106:1497–1508.
- Zhang XJ, Wang LX, Chen XX, et al. A and MdMYB1 allele-specific markers controlling apple (Malus × domestica Borkh.) skin color and suitability for marker-assisted selection. Gen Mol Res. 2014;13:9103–9114.
- Zamani Z, Zarei A, Fatahi R. Characterization of progenies derived from pollination of pomegranate cv. Malase-Torsh-Saveh using fruit traits and RAPD molecular marker. Sci Hortic. 2010;124:67–73.
- Walisch TJ, Matthies D, Hermant S, et al. Genetic structure of Saxifragarosacea subsp. sponhemica, a rare endemic rock plant of Central Europe. Plant Syst Evol. 2015;301:251–263.
- Patwardhan A, Ray S, Roy A. Molecular markers in phylogenetic studies – a review. J Phylogen Evolution Biol. 2014;2:131. doi:10.4172/2329-9002.1000131
- Martin C, Juliano A, Newbury HJ, et al. The use of RAPD markers to facilitate the identification of Oryza species within a germplasm collection. Genet Res Crop Evol. 1997;44:175–183.
- Brummer EC, Bouton JH, Kochert G. Analysis of annual Medicago species using RAPD markers. Genome. 1995;38:362–367.
- Millan T, Osuna F, Cobos S, et al. Using RAPDs to study phylogenetic relationships in Rosa. Theor Appl Genet. 1996;92:273–277.
- Miller JC, Tamksleu SD. RFLP analysis of phylogenetic relationships and genetic variation in the genus Lycopersicon. Theor Appl Genet. 1990;80:437–448.
- Shen Y, Ford-Lloyd B, Newbury HJ. Genetic relationships within genus Beta determined using both PCR-based marker and DNA sequencing techniques. Heredity. 1998;80:624–632.
- Callejas C, Ochando MD. Phylogenetic relationships among Spanish Barbus species (Pisces, Cyprinidae) shown by RAPD markers. Heredity. 2002;89:36–43.
- Federici CT, Fang DQ, Scora RW, et al. Phylogenetic relationships within the genus Citrus (Rutaceae) and related genera as revealed by RFLP and RAPD analysis. Theor Appl Genet. 1998;96:812–822.
- Nicolosi E, Deng ZN, Gentile A, et al. Citrus phylogeny and genetic origin of important species as investigated by molecular markers. Theor Appl Genet. 2000;100:1155–1166.
- Abedinpour H, Babaeian Jelodar NA, Ranjbar GA, et al. Study of genetic diversities and relatedness of Iranian citrus genotypes using morphological and molecular markers. J Plant Mol Breed. 2015;3:35–49.
- Mukherjee A, Sikdar B, Ghosh B, et al. RAPD and ISSR analysis of some economically important species, varieties, and cultivars of the genus Allium (Alliaceae). Turk J Bot. 2013;37:605–618.
- Rout GR, Aparajita S. Phylogenic study of twelve species of Phyllanthus originated from India through molecular markers for conservation. Am J Plant Sci. 2010;1:32–37.
- Ray S, Mukhopadhyay MJ, Mukhopadhyay S. Phylogenetic relationship among six economically important species of Asparagus utilizing RAPD, ISSR and isozyme polymorphism. Biores Bull. 2010;3:157–164.
- Oshingboye AD, Adeyemi TO, Ogundipe OT. Phylogenetic and genetic relationships among melon populations based on RAPD. Int J Bot. 2013;9:91–95.
- Fatinah AA, Arumingtyas EL, Mastuti R. Genetic diversity study among six genera of amaranth family found in Malang based on RAPD marker. J Tropical Life Sci. 2012;2:81–86.
- Gharaghani A, Solhjoo S, Oraguzie N. A review of genetic resources of pome fruits in Iran. Genet Resour Crop Evol. 2016;63:151–172.
- Doyle JJ, Doyle JL. A rapid DNA isolation procedure for small quantities of fresh leaf tissue. Phytochem Bull. 1987;19:11–15.
- Prevost A, Wilkinson MJ. A new system of comparing PCR primers applied to ISSR fingerprinting of potato cultivars. Theor Appl Genet. 1999;98:107–112.
- Rohlf FJ. NTSYS-pc numerical taxonomy and multivariate analysis system. Version 2. 1. Setauket (NY): Exeter Software; 2000.
- Page RDM. TREEVIEW: An application to display phylogenetic trees on personal computers. Comput Appl Biosci. 1996;12:357–358.
- Pritchard JK, Stepheens M, Donnelly P. Interference of population structure using multilocus genotype data. Genetics. 2000;155:945–959.
- Evanno G, Regnaut S, Goudet J. Detecting the number of clusters of individuals using the software STRUCTURE: a simulation study. Mol Ecol. 2005;14:2611–2620.
- Earl DA, Von Holdt BM. STRUCTURE HARVESTER: A website and program for visualizing STRUCTURE output and implementing the Evanno method. Conserv Genet Resour. 2012;4:359–361.
- Serçe S, Şimşek O, Toplu C, et al. Relationships among Crataegus accessions sampled from Hatay, Turkey, as assessed by fruit characteristics and RAPD. Genet Resour Crop Evol. 2011;58:933–942.
- Kian Amiri SH, Hasani ME. Evaluation of genetic diversity in some apple dwarf rootstocks (Malusspp.) using RAPD molecular markers. Iran J Hortic Sci. 2012;43:43–52. Persian.
- Erfani-Moghadam J, Mozafari M, Fazeli A. Genetic variation of some hawthorn species based on phenotypic characteristics and RAPD marker. Biotechnol Biotechnol Equip. 2016;30:247–253.
- Itai A. Pear. In: Kole K, editor. Genome mapping & molecular breeding in plants, fruits and nuts. Heidelberg: Springer; 2007. p. 157–170.
- Hancock JF, Lobos GA. Pears. In: Hancock JF, editors. Temperate fruit crop breeding. Heidelberg: Springer; 2008. p. 299–335.
- Katayama H, Uematsu C. Pear (Pyrus species) genetic resources in Iwate, Japan. Gen Resour Crop Evol. 2006;53:483–498.
- Sneath PR, Sokal RR. Numerical taxonomy-the principles and practices of numerical classification. San Francisco (CA): Freeman; 1973.
- Maniei A. Pear and quince and their culture. Tehran: Iranian Technical Publication; 1995.
- Erfani J, Ebadi A, Abdollahi H, et al. Genetic diversity of some pear cultivars and genotypes using simple sequence repeat (SSR) markers. Plant Mol Biol Report. 2012;30:1065–1072.
- Chamberlain JR, Hubert JD. Calliandra calothyrsus: an agro-forestry tree for the humid tropics. In: Chamberlain JR, editor. Molecular analysis of genetic variation. Vol. 40, Tropical forestry papers. Oxford (UK): Oxford Forestry Research Institute; 1998. pp. 67–76.
- Pollegioni P, Woeste KE, Chiocchini F, et al. Landscape genetics of Persian walnut (Juglans regia L.) across its Asian range. Tree Genet Genomes. 2014;10:1027–1043.
- Urbanovich O, Kozlovskaia ZA, Iakimovich OA, et al. Polymorphism of SSR alleles in pear cultivars grown in Belarus. Genetika. 2011;47:349–358.
- Bell RL, Houghm LF. Interspecific and intergeneric hybridization of Pyrus. Hortic Sci. 1986;21:62–64.