
ABSTRACT
Protein phosphorylation is central to most cellular processes. Despite the importance and widespread occurrence of this modification, phosphoproteome analysis of complex biological samples still remains a challenge. The present study has been undertaken to compare iron affinity immobilized metal ion affinity chromatography (Phos-Select™ IMAC) and Gallium immobilized metal ion affinity chromatography (Ga-IMAC) to enrich and characterize phosphopeptides from the whole-cell lysate of Jurkat cells. Our results indicated that enrichment was dependent on the isoelectric point (pI) and molecular mass of the proteins and it was found to be better in case of PHOS-Select IMAC (51.2%) as compared to Ga-IMAC (28.8%). This study compared and analysed phosphopeptide profile of Jurkat cells by two different IMAC techniques and provides advancement in phosphopeptide enrichment methods.
KEYWORDS:
Introduction
Reversible protein phosphorylation, principally on serine, threonine or tyrosine residues, is one of the most important and well-studied post-translational modifications. It has been estimated that one-third of mammalian proteins may be phosphorylated [Citation1,Citation2]. Many disease pathologies, such as Alzheimer's disease, are characterized by changes in phosphorylation levels of various proteins [Citation3,Citation4]. Despite the importance and widespread occurrence of protein phosphorylation in cellular system, identification of phosphopeptides and the site of protein phosphorylation still remains a big challenge. Phosphopeptides have been isolated earlier from complex protein mixtures by mass spectrometry (MS) method [Citation5,Citation6] and two-dimensional (2D) phosphopeptide mapping method, which was commonly used for analysing protein phosphorylation [Citation7]. In recent times, most phosphoproteomic studies are conducted by immobilized metal ion affinity chromatography (IMAC) followed by MS. IMAC was a widely used affinity medium for phosphopeptide enrichment [Citation8,Citation9] and was introduced by Porath in 1975 [Citation10,Citation11]. IMAC, usually Fe3+-IMAC, and metal oxide affinity chromatography, mainly titanium dioxide (TiO2) chromatography, are the most frequently used enrichment techniques for S/T-phosphorylated peptides [Citation12]. The principle of IMAC is based on the affinity of transition metal ions to histidine and cystine in aqueous solution [Citation13]. The ions commonly used are of borderline or soft metals, such as Cu2+, Ni2+, Co2+ and Zn2+. Protein retention in IMAC depends on the number and type of pendant groups that can interact with the metal [Citation14]. Interaction between ions and protein is dependent on variables such as pH, temperature, solvent, nature of immobilized metal and chelate, ligand density and protein size. Proteins are usually eluted by a decreasing pH gradient or by an increasing gradient of a competitive agent, such as imidazole, in a buffer [Citation14]. Elucidation of phosphopeptides from complex biological samples requires isolation and sequencing of phosphopeptides derived from protein digests. Identification of specific phosphorylated residues and actual site(s) of phosphorylation in proteins still remains a labour-intensive, time-consuming challenge and is a very complicated process [Citation15,Citation16]. Moreover, phosphoproteins are post-translationally modified proteins and are present in low abundance, which tend to coexist with their unphosphorylated isoform within the cell. Hence, enrichment protocols are required for identification of particular peptides. The enrichment strategies are generally based on chemical modifications, affinity chromatography or immunoprecipitation by phospho-specific antibodies [Citation17] and most frequently affinity chromatography is used using immobilized antibodies to phosphorylated amino acids [Citation18,Citation19]. Currently, IMAC is the most widely used technique for the enrichment of phosphopeptides [Citation20], and is based on the electrostatic interactions between the negatively charged phosphate groups and positively charged metal ions like Ga(III), Fe(III), Zn(II), Al(III), etc. Earlier, Ga-IMAC method was compared with Fe(III)-, Zn(II)- and Al(III)-based IMAC methods to probe their ability to trap phosphopeptides [Citation15,Citation21] and it is reported that Ga-IMAC has better enrichment affinity than the other available IMACs [Citation21]. Report shows that the selectivity of monophosphorylated peptides are better with Fe3+-loaded agarose when compared with Ga3+-loaded agarose [Citation22]. Methodologies are also reported to enrich heterogeneous types of phosphopeptides using distinct binding affinities column of Ga3+ and Fe3+ column [Citation23]. Also multidimensional fractionation strategies were used in earlier studies to analyse phosphopeptides that resulted in high performance both in terms of separation peak capacity and the number of unique phosphopeptide sequences [Citation24]. Likewise, for the separation and enrichment of phosphoproteins and phosphopeptides, Zn(II)-IMAC with a novel phosphate capture bead, Phos-tag Toyopearl was also used [Citation25]. There are other reports like enrichment of phosphopeptides by Zr4+ IMAC that provides a large-scale phosphoproteome analysis [Citation26]. Further improvement can be achieved by changing the key variable that mostly influences the enrichment [Citation4]. Thus, though IMAC had shown great promise for large-scale studies on phosphoproteins, it still has a poor reputation with regard to specificity [Citation27]. There is still limited data on phosphoproteome analysis in various disease conditions, though several strategies for affinity enrichment of phosphorylated peptides have been employed. Therefore, it is imperative to develop better techniques, which can enrich phosphopeptides in complex protein mixtures in order to elucidate the role of phosphorylation, to analyse activities of kinases and phosphatases and to elucidate interactions among proteins in a biological system, especially in different pathological conditions [Citation25]. Therefore, in this study, we aimed to identify better affinity support columns for phosphopeptide enrichment and compared two widely used IMACs, i.e. Ga-IMAC and PHOS-Select IMAC using best methodology of enrichment for phosphopeptides. In this approach, we have analysed the MS/MS data carefully because analysis of such vast data is very crucial in the enrichment result for phosphopeptide and thus phosphoprotein. To overcome such low specificity, combination of enhanced methodology and analysis shows remarkable improvements in phosphopeptide enrichment.
Material and methods
Chemicals
Jurkat human T-lymphoma cell line Acc-282 (German Collection), Fetal Bovine Serum (Gibco® Roswell Park Memorial Institute (RPMI)-1640), streptomycin, trypan blue, 4-2-hydroxyethyl-1-piperazineethanesulfonic acid (HEPES), Sodium chloride (NaCl), Ethylenediaminetetraacetic acid (EDTA), Sodium fluoride (NaF), phenylmethanesulphonylfluoride (Na2VO7), 1,4-dithiothreitol (DTT), dodecyl β–D maltoside, Phosphatase inhibitor 3, acetonitrile (ACN), trifluoroacetic acid (TFA), methyl alcohol (MeOH), acetic Acid, phosphate buffer (pH 7), formic acid and Phosphatase inhibitor 1 were purchased from Sigma-Aldrich, USA. Complete Mini protease cocktail (Roche, Germany), trypsin (Promega, USA), iTRAQ (Applied Biosystems, USA). Ziptips (Millipore, USA), PHOS-Select beads (Sigma-Aldrich, USA), Ga-loaded IMAC beads (GE Healthcare), MobiCol (Merck, USA), reverse phase RP18 column (Merck, USA). Proteome Discoverer version 1.3 (Thermo Scientific), Purified water (Millipore, USA).
Apparatus
UltiMate 3000 Nano LC (Dionex, Germany), LT-Orbitrap XL (Thermo Fisher Scientific, Germany), Linear Ion Trap Mass Spectrometer (LTQ)-Orbitrap mass spectrometer (Thermo Finnigan, San Jose, CA, USA), speed vacuum concentrator (Thermo Fisher Scientific, Germany), Ultra centrifuge (Beckman Coulter, USA), ultra sonicator (Thermo Fisher Scientific Germany), centrifuge (Thermo Fisher Scientific Germany).
Cell culture and preparation of cell lysate
The Jurkat cells were cultured at 37 °C in RPMI-1640 medium containing 10% (v/v) foetal bovine serum and streptomycin [Citation15], cells were lysed in buffer (50 mmol/L HEPES pH 7.56, 100 mmol/L NaCl, 1 mmol/L EDTA, 10 mmol/L NaF, 1 mmol/L Na2VO7, 10 mmol/L DTT, 1% (v/v) dodecyl β–D maltoside, 1% (v/v) Phosphatase inhibitor 3, 1% (v/v) Phosphatase inhibitor 1 and 1% (v/v) Complete Mini protease cocktail), sonicated for 1 min, centrifuged for 20 min at 4 °C and protein concentration was determined using the Bio-Rad protein assay.
Trypsin digestion and sample preparation
Protein (5 mg) precipitated using Wessel Flugge method, digested with trypsin (Promega, USA) (20 µg) overnight at 37 °C and purified using Ziptips [Citation20] was used. The Ziptips were equilibrated with 60% ACN and 0.2% TFA and bound with peptides. Peptides were eluted in 12 µL of 60% ACN and 0.2% TFA, concentrated, ultracentrifuged at 50,000 rpm at 4 °C, analysed by liquid chromatography–mass spectrometry (LC-MS/MS). More samples were purified by reverse phase RP18 column.
Phosphopeptide enrichment
PHOS-Select bead (0.2 mL) was equilibrated with 25 mmol/L formic acid + 40% (v/v) ACN (Buffer A) and Ga-loaded columns were equilibrated with 30% (v/v) MeOH, 30% (v/v) ACN and 10% (v/v) acetic acid (Buffer B). Dried peptides were loaded on PHOS-Select and Ga columns. Peptides of PHOS-Select columns were eluted in 500 mmol/L phosphate buffer (pH 7) and peptides of Ga columns were eluted in 200 mmol/L phosphate buffer (pH 7). Peptides were concentrated and analysed by LC-MS/MS.
Peptide analysis by LC-MS/MS
LC-MS/MS was performed on a Dionex Ultimate 3000 RSLCnano system (Dionex, Germering, Germany) connected to an LTQ Orbitrap Velos (Thermo Fisher Scientific, Bremen, Germany) mass spectrometer [Citation28,Citation29]. Peptides were flushed onto a C18 precolumn (Acclaim PepMap 100, 75 μm × 2 cm, Dionex) with a flow rate of 15 μL/min and washed at constant flow for 3 min. The LTQ-Orbitrap was used to acquire MS/MS spectra having 2 m/z isolation width, 35% collision energy, 5000 automatic gain control target and 150 ms maximum ion injection time. Purified phosphopeptides were loaded onto a strong cation exchange (Mono-S, GE) column using an auto sampler. Peptides were then separated on an analytical column (Acclaim PepMap RSLC, 75 μm × 25 cm, Dionex) with Ultra Performance Liquid Chromatography (UPLC) buffer A (0.1% formic acid in water) and UPLC buffer B (0.1% formic acid in ACN) via linear B gradients from 0% to 25% over 60 min followed by a linear gradient from 25% to 50% over 30 min at a flow rate of 300 nL/min. Doubly and triply charged peptide ions were automatically selected and fragmented with m/z dependent collision energy settings. The collected fractions were then dried using vacuum concentrator (Thermo Fisher Scientific, Germany). The enriched peptides were suspended in 15 µL of 0.2% TFA, and ultracentrifuged at 50,000 rpm for 20 min at 4 °C.
To the protein (2.5 mg) mixture, 1 mL dissolution buffer (tri ethylene ammonium bicarbonate) and 10 µL protease inhibitor (Sigma) were added and vortexed for 2 min in a thermocycler (Thermo Scientific) at 37 °C, 800 rpm. To this, 100 µL of 5 m mmol/L tris carboxyl ethyl phosphine hydrochloride was added and reduction reaction was carried out by incubating it for 1 h at 60 °C followed by alkylation by adding 50 µL of methyl methanethiosulfonate (10 m mmol/L) and incubating it for 10 min at room temperature (RT). Trypsin (Promega, 20 µg) was then added and incubated overnight at 37 °C. Peptides were purified by 300 mg reverse phase (RP18) column and eluted using 0.2% TFA and 60% ACN. The peptides were than concentrated by speed vac (Thermo scientific) spiked with 20 µL of 0.5 pmole/µL standard phosphopeptide mix. The peptides were then divided into two equal portions consisting of 70 µg peptides (2 mL) each and labelled with 8plex iTRAQ (Applied Biosystems, USA). One part was labelled with 5 µL of iTRAQ reagent 113 and the other part was labelled with 5 µL of iTRAQ reagent 115 and passed through PHOS-Select column (100 µL beads) and Ga column (100 µL beads), respectively. The labelling was then stopped by incubating it with 5 µL lysine (20 mmol/L) for 2 h at RT. The peptides were then purified by passing through RP C18 column as before and concentrated by speed vac.
Peptide filtering and protein identification
The raw data files were processed using the Mascot Deamon (V2.32). Database searches were carried out with a local Mascot server (V2.2) in a PA01 database national center for biotechnology information (NCBI). Scaffold (version Scaffold_3.3, Proteome Software Inc.) was used to analyse the data from Mascot Search. Searching parameters included: product ion tolerance of 10 ppm, partially tryptic restriction, parent ion mass tolerance (±10 ppm), MS/MS tolerance, 0.4 Da, fixed modification on iTRAQ 8plex (k), iTRAQ 8plex (N terminal), Methylthio (C) and dynamic modifications for phospho (S/T), phospho (Y) (+79.96 Da) and oxidized Met (M) (+15.9949 Da). The maximal number of modification sites per peptide was set as 3 and the maximum missed cleavage parameter was set to be 2. Only b and y ions were considered during the database match search (not match). To remove false positive matches, assigned peptides were grouped by a combination of tryptic state (fully and partial) and precursor ion-charge state (2+, 3+ and 4+). Each group was filtered by mass accuracy (10 ppm for high-resolution MS). All accepted proteins sharing peptides were grouped together, in which only the top proteins with highest spectral counts were selected to represent the group. Phosphorylated Ser and Thr spectra without signature phosphate neutral losses were removed.
Analysis of Magellan storage file
The ‘Magellan storage file’ obtained from the LC-MS/MS were analysed using ‘proteome discoverer 1.3’ (Thermo Scientific, Germany). Analyses include MS–MS searching with Sequest, Mascot and ZCore and comparison of data with FASTA database. We have carried out mainly two types of analyses, namely ‘protein view’ and ‘peptide view.’ The peptide view showed peptides with their sequence and accession number, a phosphoRS score, phosphorylation site, pRS site probability and sequence coverage. The phosphorylation site probability was further confirmed by the spectra of the peptide indicating the truly phosphorylated site. The protein view revealed proteins with their accession number, sequence, isoelectric point (pI) value, molecular weight, score value, peptide and unique peptides.
Results and discussion
In the present study, phosphopeptides from Jurkat cells were identified and analysed by SEQUEST algorithm of Proteome Discoverer version 1.3 (Table S1, PHOS-Select and Table S2, Ga-IMAC in supporting information). Comparison of IMAC method was carried out on the basis of identified phosphopeptides, unique peptides, total peptides, total protein enrichment, pI and molecular mass of proteins. Generally, phosphorylation analysis involves proteolytic digestion of the sample yielding peptide mixtures containing both phosphorylated and unphosphorylated peptides. Here, we used iTRAQ method, a non-gel based technique, for the quantification and labelling of all peptides using 8plex reagent [Citation29,Citation30]. The fragmentation of the attached tag generates low molecular mass reporter ions that can be used to relatively quantify the peptides and proteins with a high degree of sensitivity [Citation9].
By applying this technique, total peptides (includes phosphorylated and unphosphorylated peptides) generated by PHOS-Select IMAC were found to be 796, 1.3-fold higher than Ga-IMAC (581), ((a)), while the phosphopeptide score revealed more than 3-fold (408) phosphopeptides in PHOS-Select IMAC ((b)) compared to Ga-IMAC (131), unlike the earlier finding where Ga-IMAC was found to have the best phosphoprotein enrichment capacity [Citation27]. Further, we compared the number of phosphorylation sites and found that PHOS-Select IMAC detected threefold higher phosphopeptides (360) having at least one phosphorylation site and 3.5-fold more phosphopeptides (46) having at least two phosphorylation sites than Ga-IMAC (). This finding is supported by the pRS site probability graph, in which PHOS-Select IMAC showed fivefold higher phosphopeptides (338) (Table S3) having ≥80% pRS site probability than Ga-IMAC (64) (Table S4, ). In our study, PHOS-Select IMAC uniquely recovered 325 phosphopeptides as compared to only 48 phosphopeptides in Ga-IMAC, showing identification of nearly sixfold more phosphopeptides in PHOS-Select IMAC than Ga-IMAC. Additionally, 83 common phosphopeptides were recovered by both the methods ((a)). It was also observed that four peptides that were identified as phosphopeptides in PHOS-Select IMAC were seen to be unphosphorylated in Ga-IMAC ((b)). Furthermore, the ‘Magellan storage file’ obtained from the MS analysis showed that the total number of unique peptides were 714 and 699, whilst significant unique peptides (≥2 significant unique signature peptides) were 480 and 430 in PHOS-Select IMAC and Ga-IMAC, respectively (), indicating that PHOS-Select IMAC has better binding capacity of phosphopeptides than Ga-IMAC. The enrichment of phosphopeptides, thus, greatly varies with the methodology of enrichment. Earlier, multidimensional fractionation strategies were used to analyse phosphopeptides that resulted in high performance both in terms of separation peak capacity and the number of unique phosphopeptide sequences [Citation31].
Figure 1. (a) Total number of peptides identified from jurkat cell line using PHOS-Select IMAC and Ga- IMAC columns. phos-select imac identified 796 peptides and ga-imac identified 581 peptides. y-axis depicts the number of peptides. (b) Total number of phosphopeptides identified from jurkat cells using PHOS-Select IMAC and Ga-IMAC. PHOS-Select IMAC identified 408 phosphopeptides and Ga-IMAC identified 131 phosphopeptides. The number of phosphopeptides is displayed on y-axis.
Figure 2. Comparative analysis of phosphopeptide recovery in PHOS-Select IMAC (a) and Ga-IMAC (b) having at least two phosphorylated sites. PHOS-Select IMAC recovered 46 double charge phosphopeptides whereas Ga-IMAC identified 13 double charge phosphopeptides.
Figure 3. Phosphopeptides identified on the basis of pRS site probability in PHOS-Select (a) and Ga-IMAC (b). PHOS-Select IMAC showed 338 phosphopeptides having more than 80% pRS site probability while Ga-IMAC shows only 64 phosphopeptides.
Figure 4. (a) Distribution of phosphopeptides between PHOS-Select IMAC and Ga-IMAC. The larger circle represents the phos-select imac analysis that uniquely identified 325 phosphopeptides and smaller circle represents the Ga-IMAC analysis that uniquely identified 48 phosphopeptides, while the middle area represents 83 phosphopeptides that were commonly identified by both PHOS-Select IMAC and Ga-IMAC. (b) Comparative analysis of peptide sequences and their spectra. A, B, C and D spectra were identified as phosphopeptides by PHOS-Select IMAC, while the same peptide spectra was identified as unphosphorylated by Ga-IMAC represented by a, b, c and d.
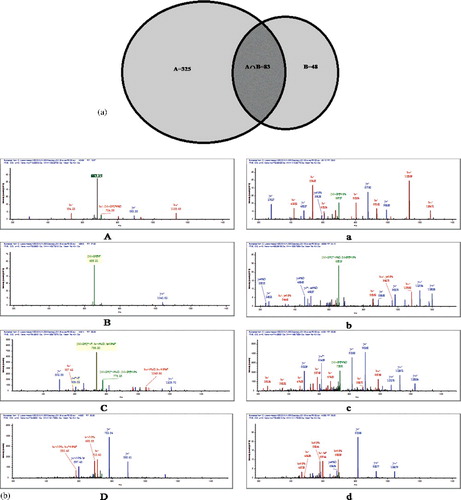
Figure 5. Total number of proteins identified from Jurkat cells using PHOS-Select IMAC (a) and Ga-IMAC (b).
In another study, a comparison was made between Poros-Fe3+ IMAC column and metal oxide affinity chromatography with TiO2 (titanium dioxide)-based methods using simple and complex mixture of peptides where they observed that although usage of low pH loading buffer can increase enrichment selectivity, but it also results in low recovery of phosphopeptides [Citation32,Citation33]. The technique was used to separate and enrich phosphoproteins from an epidermal growth factor-stimulated human epidermoid carcinoma A431 cell lysate [Citation31]. We therefore carried out ‘protein view’ analysis where the number of total protein groups identified in PHOS-Select IMAC and Ga-IMAC was found to be 418 and 329, respectively. These protein groups were analysed on the basis of pI value and molecular weight of the proteins. On the basis of pI value, number of proteins identified in the pI range of 3–4, 4–5, 5–6, 6–7, 7–8, 8–9, 9–10,10–11 and 11–12 were 35,108, 67, 46, 61, 44, 39 and 15 in PHOS-Select IMAC and 30, 76, 54, 38, 53, 39, 28 and 9 in Ga-IMAC, respectively (). Thus, we observed that the PHOS-Select IMAC has greater affinity for proteins in all pI ranges as compared to Ga-IMAC. In both the methods, the maximum number of identified proteins was found to fall in 4–5 pI range (acidic range) and minimum number of proteins were observed in 11–12 pI range (basic range). For categorization on the basis of molecular mass, the identified proteins were grouped in seven different molecular mass ranges (1–50, 50–100, 100–150, 150–200, 200–250, 250–300 and greater than 300 kDa). The number of proteins identified in these ranges is 198, 131, 50, 15, 10, 5, 7 and 183, 97, 26, 09, 5, 5 and 3 in PHOS-Select IMAC and Ga-IMAC, respectively. Also, the maximum number of proteins identified by both the methods fall in the low molecular weight range (1–50 kDa) (), although, PHOS-Select IMAC identified more in number (198) as compared to Ga-IMAC (183). This suggests that the enrichment strategy in both the IMAC methods results in loss of proteins at high molecular weight and extreme pI ranges. Similarly, it was also observed that the protein affinity gradually decreases as the size of the protein increases, in both the IMAC methods. So, this study clearly reveals that the proteins with low to medium molecular mass and pI range of ‘4–6’ can be enriched effectively by both PHOS-Select and Ga-IMAC methods but PHOS-Select IMAC gives more phosphopeptides than Ga-IMAC.
Figure 6. Graph representing the distribution of enriched proteins obtained from PHOS-Select IMAC (solid line) and Ga-IMAC (dotted line) on the basis of pI range. The number of proteins and pI ranges is shown on y-axis and x-axis, respectively.
Figure 7. Graph representing the distribution of enriched proteins obtained from PHOS-Select IMAC (solid line) and Ga-IMAC (dotted line) on the basis of molecular weight. The number of proteins and molecular weight (kDa) is taken on y-axis and x-axis, respectively.
Conclusion
Enrichment of phosphopeptides was carried out using two different IMAC-based methods and the efficiency of their binding capacity was compared. PHOS-Select IMAC was found to be more efficient than Ga-IMAC. Our study gave a comprehensive view on the enriched phosphoprotein and phosphopeptide which is useful for the selection of IMAC for enrichment of known target phosphoprotein. Enrichment can be enhanced by selecting IMAC according to the molecular mass, pI of the protein and number of phosphorylated sites. This enrichment method can be used for the identification and characterization of phosphoprotein profile of cellular systems in various diseased conditions where changes in the phosphorylation sites occur thus give comparative view on disease.
Supplementary_Data.docx
Download MS Word (59.9 KB)Acknowledgment
We thank Prof. Gursharan S. Chhatwal for providing Helmholtz fellowship to Dr Sagarika Biswas to carry out the research in the Department of Cellular Proteomics, Helmholtz Centre for Infection Research, Germany. We also acknowledge Prof. Lothar Jansch and Dr Josef Wissing, Department of Cellular Proteomics, Helmholtz Centre for Infection Research, Germany as potential collaborative partners and for providing first hand training in phosphoproteomics. We thank Prof. Atul K. Johari, School of Life Sciences, Jawaharlal Nehru University, India and Ankita Sharma, CSIR-IGIB, Delhi India for their valuable suggestions in manuscript writing.
Disclosure statement
No potential conflict of interest was reported by the authors.
Related Research Data
References
- Reinders J, Sickmann A. State-of-the-art in phosphoproteomics. Proteomics. 2005;5:4052–4061.
- Hubbard MJ, Cohen P. On target with a new mechanism for the regulation of protein phosphorylation. Trends Biochem Sci. 1993;18:172–177.
- Lu KP, Zhou XZ. The prolyl isomerase PIN1: a pivotal new twist in phosphorylation signalling and disease. Nat Rev Mol Cell Biol. 2007;8:904–916.
- Kumar S, Walter J. Phosphorylation of amyloid beta (Aβ) peptides – a trigger for formation of toxic aggregates in Alzheimer's disease. Aging (Albany NY). 2011;3:803–812.
- Ficarro SB, McCleland ML, Stukenberg PT et al., Phosphoproteome analysis by mass spectrometry and its application to Saccharomyces cerevisiae. Nat Biotechnol. 2002;20:301–305.
- Aebersold R, Mann M. Mass spectrometry-based proteomics. Nature. 2003;422:198–207.
- Boyle WJ, Van Der Geer P, Hunter T. In protein phosphorylation. Methods in enzymology 201. San Diego (NY): Academic Press; 1991. p. 110–149.
- Muszyńska G, Dobrowolska G, Medin A et al., Model studies on iron(III) ion affinity chromatography. II. Interaction of immobilized iron(III) ions with phosphorylated amino acids, peptides and proteins. J Chromatogr. 1992;604:19–28.
- Watts JD, Affolter M, Krebs DL et al., Identification by electrospray ionization mass spectrometry of the sites of tyrosine phosphorylation induced in activated Jurkat T cells on the protein tyrosine kinase ZAP-70. J Biol Chem. 1994;269:29520–29529.
- Porath J, Carlsson J, Olsson I et al., Metal chelate affinity chromatography, a new approach to protein fractionation. Nature. 1975;258:598–599.
- Andersson L, Porath J. Isolation of phosphoproteins by immobilized metal (Fe3+) affinity chromatography. Anal Biochem. 1986;154:250–254.
- von Stechow L, Francavilla C, Olsen JV. Recent findings and technological advances in phosphoproteomics for cells and tissues. Expert Rev Proteomics. 2015;12:469–487.
- Hearon J. The configuration of oxy-bis(cobaltodihistidine). J Natl Cancer Inst. 1948;9:1–11.
- Jon WW, Robert L, Albright & Nien-Hwa LW. Immobilized metal ion affinity chromatography (IMAC) chemistry and bioseparation applications. Separ purif method. 2006;49–106.
- Nuhse TS, Stensballe A, Jensen O et al., Phosphoproteomics of the Arabidopsis plasma membrane and a new phosphorylation site database. Plant Cell. 2004;16:2394–2405.
- Annan RS, Huddleston MJ, Verma R et al., A multidimensional electrospray MS-based approach to phosphopeptide mapping. Anal Chem. 2001;73:393–404.
- Fíla J, Honys D. Enrichment techniques employed in phosphoproteomics. Amino Acids. 2012;43:1025–1047.
- Pandey A, Podtelejnikov AV, Blagoev B et al., Analysis of receptor signaling pathways by mass spectrometry: identification of Vav-2 as a substrate of the epidermal and platelet-derived growth factor receptors. Proc Natl Acad Sci USA. 2000;97:179–184.
- Matsumoto M, Oyamada K, Takahashi H et al., Large-scale proteomic analysis of tyrosine-phosphorylation induced by T-cell receptor or B-cell receptor activation reveals new signaling pathways. Proteomics. 2009;9:3549–3563.
- McLachlin DT, Chait BT. Analysis of phosphorylated proteins and peptides by mass spectrometry. Curr Opin Chem Biol. 2001;5:591–602.
- Larsen MR, Sorensen GL, Fey SJ et al., Phospho-proteomics: evaluation of the use of enzymatic de-phosphorylation and differential mass spectrometric peptide mass mapping for site specific phosphorylation assignment in proteins separated by gel electrophoresis. Proteomics. 2001;1:223–238.
- Zhou W, Merrick BA, Khaledi MG et al., Detection and sequencing of phosphopeptides affinity bound to immobilized metal ion beads by matrix-assisted laser desorption/ionization mass spectrometry. J Am Soc Mass Spectrom. 2000;4:273–282.
- Lai AC, Tsai CF, Hsu CC et al., Complementary Fe(3+)- and Ti(4+)-immobilized metal ion affinity chromatography for purification of acidic and basic phosphopeptides. Rapid Commun Mass Spectrom. 2012;26:2186–2194.
- Morandell S, Stasyk T, Grosstessner-Hain K et al., Phosphoproteomics strategies for the functional analysis of signal transduction. Proteomics. 2006;6:4047–4056.
- Emiko KK, Atsushi Y, Chika I et al., A novel phosphate-affinity bead with immobilized Phos-tag for separation and enrichment of phosphopeptides and phosphoproteins. JIOMICS; 2011. p. 157–169.
- Nühse TS, Stensballe A, Jensen ON et al., Large-scale analysis of in vivo phosphorylated membrane proteins by immobilized metal ion affinity chromatography and mass spectrometry. Mol Cell Proteomics. 2003;2:1234–1243.
- Thomas S, Allan S, Ole N et al., Large-scale analysis of in-vivo phosphorylated membrane proteins by immobilized metal Ion affinity chromatography and mass spectrometry. Mol Cell Proteomics. 2003;2:1234–1243.
- Wissing J, Jansch L, Nimtz M et al., Proteomics analysis of protein kinases by target class-selective prefractionation and tandem mass spectrometry. Mol Cell Proteomics. 2007;6:537–547.
- Wiese S, Reidegeld KA, Meyer HE et al., Protein labeling by iTRAQ: a new tool for quantitative mass spectrometry in proteome research. Proteomics. 2007;7:340–350.
- Zhou H, Yan H, Yan W et al., Quantitative proteomics analysis with iTRAQ in human lenses with nuclear cataracts of different axial lengths. Mol Vis. 2016;22:933–343.
- Kinoshita-Kikuta E, Kinoshita E, Yamada A et al., Enrichment of phosphorylated proteins from cell lysate using a novel phosphate-affinity chromatography at physiological pH. Proteomics. 2006;6:5088–5095.
- Grønborg M, Kristiansen TZ, Stensballe A et al., A mass spectrometry-based proteomic approach for identification of serine/threonine-phosphorylated proteins by enrichment with phospho-specific antibodies: identification of a novel protein, Frigg, as a protein kinase A substrate. Mol Cell Proteomics. 2002;1:517–527.
- Novotna L, Hruby M, Benes MJ et al., Study of pepsin phosphorylation using immobilized metal affinity chromatography. J Sep Sci. 2008;31:1662–1668.