
ABSTRACT
The Apiaceae family includes a few agronomic and medicinal species, one of which is Scaligeria lazica Boiss. In this study, the genetic diversity of S. lazica was analyzed based on novel simple sequence repeat (SSR) markers using next-generation sequencing (NGS). A total of 15.17G clean Illumina data set was obtained and dinucleotide repeats were the most abundant repeats in S. lazica. Of the tested 150 SSR primer pairs, 139 ones produced amplification and 84 ones were polymorphic. Forty polymorphic SSR loci were used in genetic diversity analysis of 40 S. lazica accessions from four locations. A total of 264 alleles were amplified with an average of 6.6 alleles per locus. The polymorphism information content (PIC) was 0.60, while the observed homozygosity (Ho) and expected heterozygosity (He) values were 0.47 and 0.66, respectively. According to cluster and structure analysis, all accessions were grouped into four different clusters according to their collection sites. The SSR markers developed in this study can be tested for other Scaligeria species due to their high transferability and can be used for genetic studies in genus Scaligeria DC.
Introduction
There is an overwhelming plant biodiversity on earth and efforts have been made to categorize plants based on their size, forms, habitat, structure, anatomy, biochemical and molecular features to interpret the relationships among them [Citation1–4].
Apiaceae Lindl. (Umbelliferae) includes 300–455 genera with 3000–3750 species and is one of the best known families of flowering plants. Members of this family are of great economic significance due to their culinary use (vegetables, condiments) and for their application in medicine [Citation5,Citation6]. The genus Scaligeria DC. belongs to Apiaceae and is represented by seven species, of which two are endemic in Turkey [Citation7,Citation8]. The naturally growing Scaligeria species in Turkey are as follows: S. napiformis (Willd.ex Spreng) Grande, S. tripartita (Kalen.) Schischkin, S. lazica Boiss. (endemic), S. meifolia (Fenzl) Boiss., S. glaucescens (DC.) Boiss., S. hermonis Post and S. capillifolia Post. (endemic). S. lazica has a strong characteristic smell of anise due to the presence of trans-anethol (1-methoxy-4-(1-propenyl)benzene) in its oil, which is known as ‘laz anasonu’ in the Black Sea Region of Turkey [Citation8,Citation9]. The economically important trans-anethole-containing oils are used widely in the food and liquor industries [Citation10]. trans-Anethole originates from anise in raki and is also used for flavour in many alcoholic drinks such as Middle Eastern arak, Colombian aguardiente, French spirits absinthe, anisette and pastis, Greek ouzo, mastika in Bulgaria and the former Yugoslav Republic of Macedonia. [Citation11]. In addition, anethole shows estrogenic effects and is useful in providing relief from rheumatism and lower back pain [Citation12,Citation13]. Interestingly, some phytochemical markers of Pimpinella spp. are also detected in S. tripartita and S. lazica species [Citation9,Citation14–16]. Studies on Scaligeria spp. are still very limited in the literature to clarify the taxonomy of the genus. A promising approach to resolving these problems in the taxonomy of Scaligeria species are molecular studies.
Simple sequence repeats (SSRs) are a very powerful technique due to their high rate of polymorphism and repeatability. The potential use of SSR molecular markers in the family Apiaceae has been demonstrated by different studies. Novel SSR markers were developed in Apiaceae and they have been used to study the genetic diversity, phylogenetic relationships and germplasm characteristics. The potential use of SSRs in Apiaceae has been demonstrated by different studies [Citation17–21].
Next-generation sequencing is a very advantageous technology as regards the millions of sequences that can be generated at once with a lower unit cost. It is possible to have thousands of microsatellite loci sequenced very rapidly and cost-effectively in plants [Citation22,Citation23]. SSR markers in plants are used as a prominent genomic resource in the botanical sciences. SSRs are highly repeatable and transferable across closely related species [Citation24–27]. An important feature of SSR markers is that multiple alleles per locus can be amplified, e.g. 10 alleles in a population. This variability makes SSR markers highly polymorphic and useful for genetic diversity analysis [Citation27,Citation28].
To date, there are no reports on SSR development and genetic diversity studies in Scaligeria lazica. Therefore, in this study, we aimed to develop novel SSR markers by next-generation sequencing and to study the population structure in S. lazica. Due to their high transferability, the markers from this study can also be useful as molecular tools for other species in genus Scaligeria.
Materials and methods
Plant materials and DNA extraction
Stems of Scaligeria lazica [Citation7] were collected from four locations: Camlihemsin (RCH) and Cayeli (RCE) from Rize province and Altindere (TAD) and Sumela (TSM) from Trabzon province of Turkey. Ten accessions were collected from each location. and represent the ‘Rize–Camlihemsin’, ‘Rize–Cayeli’, ‘Trabzon–Altindere’ and ‘Trabzon–Sumela’ sites with the latitude (N)/longitude (W) zones of each sampling location.
Figure 1. Sampling sites of S. lazica accessions from four different locations in Turkey.
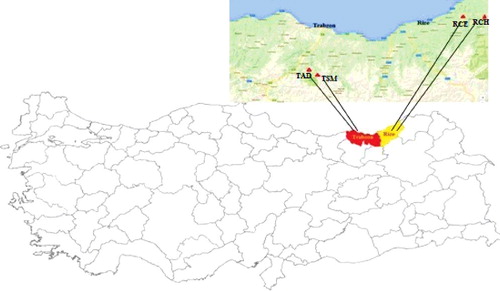
Table 1. S. lazica sampling locations in this study.
DNA extraction was carried out by using the DNeasy mericon® 96 QIAcube HT Kit (QIAGEN Ltd., Manchester, UK) according to the manufacturer's protocol. DNA concentration was measured using a Qubit Fluorometer (Invitrogen, Massachusetts, USA) or estimated by comparing the band intensity with λ DNA of known concentrations after separation by 0.8% agarose gel electrophoresis and ethidium bromide staining. The DNA samples were then diluted with elution buffer (EB) to a concentration of 10 ng/µL for SSR–PCR (polymerase chain reactions) reactions.
SSR loci development by illumina sequencing and primer design
A DNA sample of one S. lazica accession (RCH-5) from the Rize–Camlihemsin location was used for next-generation sequencing using the Illumina Hi–Seq™ 2500 platform. The library construction and sequencing were performed at the Beijing Genomic Institute, China. About 15.17G clean data were generated after removing adapter and low quality (quality value ≤ 5 (E) sequences. SOAPdenovo2 [Citation29] was used for assembly and SSR loci were searched using SSRIT [Citation30] software. The search parameters were set for detection of di-, tri-, tetra-, penta- and hexanucleotide SSR motifs with a minimum of 11, 8, 6, 5 and 4 repeats, respectively. The SSR loci were subjected to primer design using Primer 3 web-based software [Citation31] with the standard parameters, following settings; the primer length was between 18 and 23 nucleotides, with an optimum size of 20 nucleotides. The melting temperatures ranged from 50 to 70 °C, with an optimum temperature of 55 °C. The optimum GC content was set to 50%, with a minimum of 30% and a maximum of 70%. The predicted PCR products ranged from 100 to 350 bp. In this study, 1982 SSR primer pairs were successfully designed and 150 SSR primer pairs were randomly selected and synthesized.
For the successful amplification of the SSR loci, their optimum annealing temperatures were determined by gradient PCR. Two accessions were used in the gradient PCR reactions. The gradient PCR products were run on 3% agarose gels and visualized after ethidium bromide staining. If a primer pair had amplification, then PCR and capillary electrophoresis were performed to determine its allelic profiles by using eight accessions (two from each location). The sequences of amplified SSR loci were deposited into the National Center for Biotechnology Information (NCBI) database (GenBank accession numbers KX234451–KX234589).
PCR reactions and electrophoresis
SSR–PCR was carried out using a three-primer strategy according to Schuelke [Citation32] with some modifications [Citation33]. PCR reactions were performed in a total volume of 12.5 µL containing 20 ng DNA, 75 mmol/L Tris–HCl (pH: 8.8), 20 mmol/L (NH4)2SO4, 2.0 mmol/L MgCl2, 0.01% Tween 20, 200 µmol/L of each deoxyribonucleoside triphosphate (dNTP), 10 nmol/L M13 tailed forward primer at the 5′ end, 200 nmol/L reverse primer, 200 nmol/L universal M13 tail primer (5′-TGTAAAACGACGGCCAGT-3′) labelled with one of the FAM, VIC, NED or PET dyes, and 0.6 U of Hot Start Taq DNA polymerase.
Amplification was performed in a Veriti thermal cycler (Applied Biosystems, Massachusetts, USA) in two steps as follows: initial denaturation at 94 °C for 3 min, followed by 10 cycles at 94 °C for 30 s, 56–60 °C for 45 s and 72 °C for 60 s. Then, a second step included 30 cycles at 94 °C for 30 s, 58 °C for 45 s and 72 °C for 60 s. A final extension at 72 °C for 10 min was included in the program. When the PCRs were completed, the reactions were subjected to denaturation for capillary electrophoresis in ABI 3130xl genetic analyzer [Applied Biosystems Inc., Foster City, CA, USA (ABI)] using 36 cm capillary array with POP7 as the matrix (ABI). Denaturation of the samples was completed by mixing 0.5 μL of the amplified product, 0.2 μL of the size standard and 9.8 μL of formamide. The fragments were resolved using ABI data collection software 3.0. and SSR fragment analysis was performed with GeneScan Analysis Software 4.0 (ABI).
Data analysis
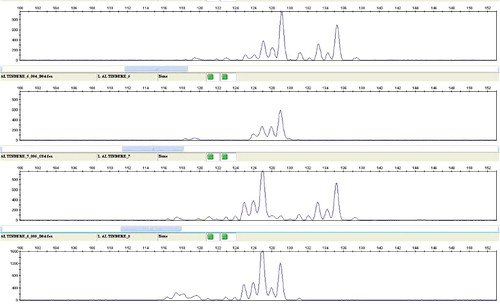
After determining the alleles of each SSR locus by capillary electrophoresis (), the number of alleles (Na), the number of effective alleles (Ne), observed (Ho), expected (He) heterozygosity and the number of private alleles were calculated using GenAlEx V6.5 software [Citation34]. The polymorphism information content (PIC) was also calculated using PowerMarker ver 3.25 software [Citation35]. A dendrogram was obtained using Jaccard coefficient in NTSYSpc v2.21c [Citation36] software by unweighted pair-group method with arithmetic averages (UPGMA).
Figure 2. Electropherogram of SclgSSR1762 SSR locus in four S. lazica.
Population structure and identification of admixed individuals was performed using the model-based software program, STRUCTURE 2.3.4 [Citation37]. In this model, a number of populations (K) are assumed to be present, each of which is characterized by a set of allele frequencies at each locus. Individuals in the sample are assigned to populations (clusters), or jointly to more populations if their genotypes indicate that they are admixed. The posterior probabilities were estimated using the Markov Chain Monte Carlo (MCMC) method. The MCMC chains were run with a 50,000 burn-in period, followed by 500,000 iterations, using a model allowing for admixture and correlated allele frequencies. Run of STRUCTURE was performed by setting K from 1 to 5.
Results and discussion
Development of novel SSR loci and genetic diversity analysis in S. lazica
A total of 15.17G clean Illumina data were generated to search SSR loci and 1982 SSR primer pairs were successfully designed. A total of 1982 SSRs dinucleotide repeats were the most abundant (70.63%), followed by trinucleotide (11.5%) and hexanucleotide repeats (11.3%), while tetranucleotide (4.3%) and pentanucleotide (2.1%) repeats were the least frequent (). The most abundant dinucleotide and trinucleotide repeat motif types were TC/GA and TTC/GAA, respectively.
Figure 3. Number of different repeat motifs in S. lazica.
Of the tested 150 SSR primer pairs by gradient PCR analysis, 139 primer pairs produced successful amplification. Fifty-five of 139 primer pairs were monomorphic in the screening of the SSRs in the eight accessions. Eighty-four SSR loci (60.4%) generated polymorphic fragments (Table S1 in the Online Supplement) and 40 were used for further analysis to fingerprint 40 Scaligeria accessions. The Genebank accession numbers, the sequences of forward and reverse primers, repeat motifs, annealing temperatures, product sizes, Na, Ne, Ho, He and PIC values of the 40 SSR loci are presented in .
Table 2. Repeat motifs, product sizes, number of alleles (Na), number of effective alleles (Ne), observed homozygosity (Ho), expected heterozygosity (He) and polymorphism information content (PIC) values based on 40 SSR loci developed from S. lazica.
Forty microsatellite loci were used to fingerprint 40 S. lazica accessions belonging to four populations and a total of 264 alleles were obtained, ranging from 2 to 13 per locus (). The loci SclgSSR1636 (13), SclgSSR285 (12), SclgSSR762 (12), SclgSSR1614 (11) and SclgSSR2725 (11) produced the highest number of alleles. The effective number of alleles ranged from 1.35 (SclgSSR323) to 7.04 (SclgSSR285). The Ho was between 0.10 (SclgSSR179) and 1.00 (SclgSSR1645 and SclgSSR1544). The He values changed from 0.25 (SclgSSR323) to 0.86 (SclgSSR285) with an average of 0.66. The PIC values ranged from 0.24 to 0.84 with an average of 0.60. The locus SclgSSR285 had the highest PIC value ().
The average values of population genetic parameters in this study are summarized in . The highest degree of genetic diversity values occurred in the RCE location, while the TSM location had the lowest values and RCH and TAD locations had similar degrees of genetic diversity. The number of private alleles in the RCH location was quite higher than that in the other three locations. For example, it was four times more than in TAD and 16 times more than in TSM. The polymorphism rate of 264 alleles was the highest (97.3%) in the RCE location, whereas the TSM (91.3%) and RCH (92.4%) locations had the lowest polymorphisms.
Table 3. Mean of population genetic parameters in this study.
Genetic relationships and population structure
The genetic relationships among S. lazica accessions are provided in . The clustering of the 40 S. lazica accessions was largely based on the place of collection and geographic origin. The UPGMA dendrogram grouped all accessions into two major clusters: the first cluster contained accessions from the RCH population, whereas the other three populations were in the second cluster. The second cluster had two main subclusters: one subcluster contained all accessions from the RCE location, whereas the second subcluster contained all accessions from Trabzon province (TAD and TSM).
Figure 4. An UPGMA dendrogram of 40 S. lazica accessions from four locations obtained by analyzing 40 SSR loci.
The genetic structure of the Scaligeria accessions used in this study is shown in . A model-based clustering method was performed for all 40 accessions using 40 SSR loci. The most probable number of clusters was identified by calculating the Delta K (ΔK), which is based on the rate of change in the log probability of data between successive K values (K = 1 to K = 5). The peak of the ΔK graph corresponds to the most probable number of populations in the data set, as previously discussed in Motalebipour et al. [Citation38]. The highest value of ΔK was found at K = 2 (), where all 44 genotypes were divided into two main groups: the RCH accessions and the other (RCE, TSM, TAD) accessions, which is similar to the UPGMA dendrogram (). As the value of K increased to 3, the genotypes in group 2 were divided into two subgroups: the first subgroup contained accessions of RCE and the second subgroup consisted of the other accessions. When K = 4, all accessions were classified into four different clusters according to their collection sites and geographical distance which was supported by another high ΔK found at K = 4. As the value for K increased to 5, the accessions were again divided into four groups and additionally provided grouping of RCE accessions based on their genetic diversity ( and ).
Figure 5. Population structure of 40 accessions estimated from 40 SSRs using STRUCTURE program. K = 2 to K = 5 represent the sub-population of the 40 accessions originating from different places of Turkey.
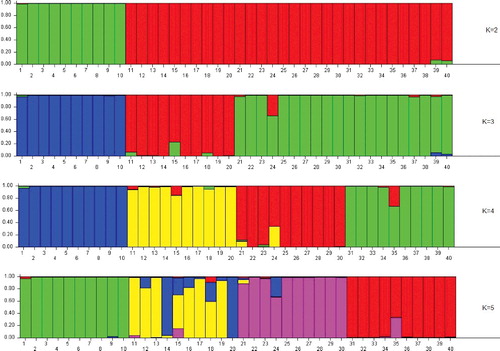
Figure 6. Values of ΔK, with its modal value detecting a most probable K of two subgroups (K = 2), including a small peak at four subgroups (K = 4).
Novel SSR markers and genetic diversity in S. lazica
Due to the codominant nature and high polymorphism, SSR markers are reliable tools for genetic diversity and population structure analysis as well as genetic mapping, fingerprinting and parental identification in plants. However, sequence information is needed for primer development for each species; therefore, the development process is expensive and time-consuming. Next-generation sequencing technology provides an opportunity to generate thousands of SSR loci in a very short time at a lower cost than Sanger sequencing. However, testing the loci for polymorphism in the lab is still expensive and time-consuming. However, it is a very powerful technique, once the SSR loci have been developed.
The Apiaceae family includes several agronomic and medicinal vegetable species, one of which is S. lazica in the genus Scaligeria. There are a limited number of SSR markers in the literature for Apiaceae family [Citation21,Citation39,Citation40]. Till now, to the best of our knowledge, there is no study on development of SSR markers in Scaligeria in the literature. Thus, this is the first report that presents polymorphic SSR loci for Scaligeria.
In this study, from 15.17G clean Illumina data, 1982 SSR primer pairs were successfully designed and the most frequent repeats were identified to be dinucleotides (70.63%), in agreement with previous reports. In Apiaceae family, Rijal et al. [Citation21] and Cavagnaro et al. [Citation17] reported polymorphic microsatellite markers in Heracleum persicum Desf. ex Fisch and Daucus carota L., respectively, and they found that the most frequent repeats are dinucleotides, as in our study. The most abundant dinucleotide motif in Scaligeria was TC/GA. The GA motif is generally one of the most abundant di-nucleotide repeats in plants [Citation41–43]. There are several reports on SSR development in Apiaceae: Michalczyk et al. [Citation39] generated 12 SSR loci from Cnidium dubium (Schkuhr) Thell. and obtained an average of 8.3 alleles per locus by characterizing 40 individuals. The authors calculated the Ho and He values as 0.62 and 0.63, respectively. Tew et al. [Citation40] reported eight polymorphic SSR loci from Lilaeopsis schaffneriana subsp. recurva (A.W.Hill) Affolter by fingerprinting 48 individuals from two natural populations and obtained 4.4 alleles per locus. Maksylewicz and Baranski [Citation44] developed 27 polymorphic SSR loci from carrot (D. carota L. ssp. sativus) and tested in two F1 hybrids, ten open pollinated cultivars and six landraces, obtaining an average of 9.4 alleles. The PIC, Ho and He values were reported as 0.56, 0.39 and 0.61, respectively. Rijal et al. [Citation21] generated 25 polymorphic microsatellite markers in H. persicum by characterizing eight geographically distant samples of H. persicum and obtained Na of 2.3 alleles per locus. The average values of Ho and He for the 25 polymorphic SSR loci were 0.57 and 0.42, respectively. In this study, 84 polymorphic SSR loci were developed and 40 were used in genetic diversity analysis of S. lazica. The selected 40 SSR loci produced 264 polymorphic alleles. The number of generated and characterized polymorphic SSR loci was higher than those in the above-mentioned studies for Apiaceae family [Citation21,Citation40–44]. The mean PIC value obtained in this study was higher (PIC = 0.60) than those in the previous reports discussed above. The average Ho value for the 40 polymorphic loci in this study was 0.47, which was higher than that for L. schaffneriana subsp. recurva and D. carota L. ssp. sativus [Citation40,Citation44], while lower than that for C. dubium and H. persicum [Citation21,Citation39]. The average He for the 40 polymorphic loci in this study was 0.66, which was higher than the values reported in the previous studies in Apiaceae.
Among the populations, the Cayeli location in Rize province (RCE) had the highest genetic diversity values and polymorphism rate, while the Sumela location in Trabzon province (TSM) had the lowest levels of genetic diversity (). The lowest level of polymorphism and number of private alleles were also in TSM location. The marginal distribution would reduce the opportunity to communicate with other populations and may lead to a low level of genetic diversity.
Cluster analysis and genetic structure of S. lazica
To identify the true optimal number of subsets (K) in STRUCTURE, LnP(D) and ΔK were chosen, as described in Ren et al. [Citation45]. The K value that provides the maximum likelihood, called LnP(D) in STRUCTURE, is generally considered as the optimal number of subdivisions [Citation37]. Our results from two main genetic sites can be summarized with the maximum of ad hoc measure ΔK at K = 2 (). All the accessions separated and consistently grouped well in both cluster and structure analysis. The dendrogram and structure analysis at K = 2 divided Scaligeria accessions into two main clusters: the first cluster included all RCH accessions, whereas the second cluster contained the accessions from the other collection sites. The second cluster divided into two subclusters: the first subcluster contained RCE with 10 accessions, whereas the second subcluster contained TSM and TAD which included 10 accessions in each group.
According to both cluster and structure analyses, the accessions from RCH and TAD locations were the most distant group, whereas the closest groups were TSM and TAD. These two locations were also geographically the closest ( and ). The high number of private alleles separated the RCH location from the others, which was also supported by cluster and structure analyses at K = 2 ( and ). In the structure analysis at K = 4, all accessions were classified into four different clusters according to their collection sites. The structure analysis demonstrated that the accessions in RCE location were the most diverse ones, which was supported by structure analysis at K = 5. The results presented in this study, therefore, provide information about the genetic diversity levels of S. lazica from different locations in Turkey. Similar diversity can also be observed in the production of trans-anethol by the accessions, which is the most important product of Scaligeria species.
Conclusions
Here we present novel SSR markers for the first time in S. lazica by next-generation sequencing. Dinucleotide repeats were most abundant (70.63%), followed by trinucleotide (11.5%) and hexanucleotide repeats (11.3%) in S. lazica. SSRs are a co-dominant marker system and can be applied not only as a useful molecular tool for the analysis of genetic variation, population structure and phylogenetic relationships of S. lazica accessions collected from different locations, but also may contribute to development of DNA markers linked to the agronomic and medicinal characters in S. lazica. Furthermore, novel SSR markers developed from this study can be also analyzed to test their transferability to other Scaligeria species.
Supplementary_Data.pdf
Download PDF (160.4 KB)Disclosure statement
No potential conflict of interest was reported by the authors.
Additional information
Funding
Related Research Data
References
- Mishra PK, Ram RB, Kumar N. Genetic variability, heritability and genetic advance in strawberry (Fragaria × ananassa Duch.). Turk J Agric For. 2015;39:451–458.
- Nemli S, Kianoosh T, Tanyolac MB. Genetic diversity and population structure of common bean (Phaseolus vulgari s L.) accessions through retrotransposon-based interprimer binding sites (iPBSs) markers. Turk J Agric For. 2015;39:940–948.
- Ipek A, Yilmaz K, Sıkıcı P , et al. SNP discovery by GBS in olive and the construction of a high-density genetic linkage map. Biochem Genet. 2016;54:313–325.
- Tsou C, Li L, Vijayan K. The intra-familial relationships of Pentaphylacaceae as revealed by DNA sequence analysis. Biochem Genet. 2016;54:270–282.
- Downie SR, Katz-Downie DS, Spalic KA. A phylogeny of Apiaceae tribe Scandiceae: evidence from nuclear ribosomal DNA internal transcribed spacer sequences. Am J Bot. 2000;87:76–95.
- Downie SR, Katz-Downie DS. A phylogeny of the flowering plant family Apiaceae based on chloroplast DNA RPL16 and RPOC1 intron sequence: Towards a suprageneric classification of subfamily Apioideae. Am J Bot. 2000;87:273–292.
- Stevens PF. Scaligeria DC. In: Davis PH, editor. Flora of Turkey and the East Aegean Islands. Edinburgh: Edinburgh University; 1972.
- Güner A, Akyıldırım B, Alkayış MF , et al. In: Güner A Aslan S Ekim T Vural M Babaç MT, editors. A checklist of the flora of Turkey (vascular plants). Istanbul: Nezahat Gökyiğit Botanic Garden, ANG Foundation and Flora Research Society; 2012.
- Başer KHC, Özek T, Kürkçüoğlu M. Composition of the essential oil from fruits of Scaligeria lazica Boiss. J Essent Oil Res. 1995;7:557–558.
- Castro HT, Martinez JR, Stashenko E. Anethole isomerization and dimerization induced by acid sites or UV irradiation. Molecules. 2010;15:5012–5030.
- Akçan R, Lale A. Trans-anethole concentrations in bogma raki. Hum Exp Toxicol. 2017;36(2):203–204.
- Tabanca N, Khan SI, Bedir E , et al. Estrogenic activity of isolated compounds and essential oils of Pimpinella species from Turkey, evaluated using a recombinant yeast screen. Planta Med. 2004;70:728–735.
- Peng W, Lin Z, Wang L et al., Molecular characteristics of Illicium verum extractives to activate acquired immune response. Saudi J Biol Sci. 2016;23:348–352.
- Tabanca N, Demirci B, Baser KHC , et al. Characterization of volatile constituents of Scaligeria tripartita and studies on the antifungal activity against phytopathogenic fungi. J Chromatogr Sci B. 2007;850(1):221–229.
- Tabanca N, Demirci B, Ozek T , et al. Gas chromatographic–mass spectrometric analysis of essential oils from Pimpinella species gathered from Central and Northern Turkey. J Chromatogr A. 2006;1117:194–205.
- Başer KHC, Özek T, Kürkçüoğlu M. The essential oil of Scaligeria lazica Boiss. J Essent Oil Res. 1993;5:463–464.
- Cavagnaro PF, Chunh SM, Manin S , et al. Microsatellite isolation and marker development in carrot - genomic distribution, linkage mapping, genetic diversity analysis and marker transferability across Apiaceae. BMC Genomics. 2011;12:2–20.
- Rakotondralambo SOR, Lussert A, Rivallan R , et al., Microsatellite markers isolated from the wild medicinal plant Centella asiatica (Apiaceae) from an enriched genomic library. Am J Bot. 2012;99:e176–e178.
- Fu N, Wang PY, Liu XD , et al. EST-SSR Markers for evaluating genetic diversity and fingerprinting Celery (Apium graveolens L.) cultivars. Molecules. 2014;19:1939–1955.
- Sahu J, Das Talukdar A, Devi K , et al. E-microsatellite markers for Centella asiatica (Gotu Kola) genome: validation and cross-transferability in Apiaceae family for plant omics research and development. Omics. 2015;19:52–65.
- Rijal DP, Falahati-Anbaran M, Alm T , et al. Microsatellite markers for Heracleum persicum (Apiaceae) and allied taxa: application of next-generation sequencing to develop genetic resources for invasive species management. Plant Mol Biol Rep. 2015;33:1381–1390.
- Shendure J, Ji H. Next-generation DNA sequencing. Nat Bioechnol. 2008;26:1135–1145.
- Ekblom R, Galindo J. Applications of next generation sequencing in molecular ecology of non-model organisms. Heredity. 2011;107:1–15.
- Jewell MC, Frere CH, Prentis PJ , et al. Characterization and multiplexing of EST-SSR primers in Cynodon (Poaceae) species. Am J Bot. 2010;97:e99–e101.
- Jones BL, Waycott M, Robson HLA , et al. Isolation and chaaracterization of microsatellite loci in Santalum lanceolatum and Santalum leptocladum (Santalaceae). Am J Bot. 2010;97:e97–e98.
- Moe AM, Weiblen GD. Development and characterization of microsatellite loci in dioecious figs (Ficus, Moraceae). Am J Bot. 2011;98:e25–e27.
- Zalapa JE, Cuevas H, Zhu H , et al. Using next-generation sequencing approaches to isolate simple sequence repeat (SSR) loci in the plant sciences. Am J Bot. 2012;99:1–16.
- Hamblin MT, Warburton ML, Buckler ES. Empirical comparison of simple sequence repeats and single nucleotide polymorphisms in assessment of maize diversity and relatedness. Plos One. 2007;2:e11367.
- Luo R, Liu B, Xie Y , et al. SOAPdenovo2: an empirically improved memory-efficient short-read de novo assembler. Gigascience. 2012;1:18.
- Temnykh S, DeClerck G, Lukashova A , et al. Computational and experimental analysis of microsatellites in rice (Oryza sativa L.): frequency, length variation, transposon associations and genetic marker potential. Genome Res. 2001;11:1441–1452.
- Rozen S, Skaletsky H. Primer3 on the WWW for general users and for biologist programmers. Methods Mol Biol. 2000;132:365–386.
- Schuelke M. An economic method for the fluorescent labelling of PCR fragments. Nat Biotechnol. 2000;18:233–234.
- Topcu H, Ikhsan AS, Sutyemez M , et al. Development of 185 polymorphic simple sequence repeat (SSR) markers from walnut (Juglans regia L.). Sci Hortic. 2015;194:160–167.
- Peakall ROD, Smouse PE. GENALEX 6: genetic analysis in Excel. Population genetic software for teaching and research. Mol Ecol Notes. 2006;6:288–295.
- Liu K, Muse SV. Powermarker: an integrated analysis environment for genetic marker analysis. Bioinformatics. 2005;21:2128–2129.
- Rohlf FJ. NTSYSpc: numerical taxonomy system, ver. 2.21c. Setauket (NY): Exeter Publishing; 2009.
- Pritchard JK, Stephens M, Donnelly P. Inference of population structure using multilocus genotype data. Genetics. 2000;155:945–959.
- Motalebipour EZ, Kafkas S, Khodaeiaminjan M , et al. Genome survey of pistachio (Pistacia vera L.) by next generation sequencing: development of novel SSR markers and genetic diversity in Pistacia species. BMC Genomics. 2016;17:998. doi:10.1186/s12864-016-3359-x
- Michalczyk IM, Schumacher C, Mengel C , et al. Identification and characterization of 12 microsatellite loci in Cnidium dubium (Apiaceae) using next-generation sequencing. Am J Bot. 2011;98:e127–e129.
- Tew JM, Lance SL, Jones KL , et al. Microsatellite development for an endangered riparian inhabitant, Lilaeopsis schaffneriana subsp. recurva (Apiaceae). Am J Bot. 2012;99:e164–e166.
- Cardle L, Ramsay L, Milbourne D , et al. Computational and experimental characterization of physically clustered simple sequence repeats in plants. Genetics. 2000;156:847–854.
- Bassil NV, Botta R, Mehlenbacher SA. Microsatellite markers in hazelnut: isolation, characterization and cross-species amplification. J Am Soc Hortic Sci. 2005;130:543–549.
- Zaloğlu S, Kafkas S, Doğan Y , et al. Development and characterization of SSR markers from pistachio (Pistacia ve ra L.) and their transferability to eight Pistacia species. Sci Hortic. 2015;189:94–103.
- Maksylewicz A, Baranski R. Intra-population genetic diversity of cultivated carrot (Daucus carot a L.) assessed by analysis of microsatellite markers. Acta Biochim Pol. 2013;60:753–760.
- Ren X, Jiang H, Yan Z , et al. Genetic diversity and population structure of the major peanut (Arachis hypogaea L.) cultivars grown in China by SSR markers. PloS One. 2014;9(2):e88091.