
ABSTRACT
Chickpea suffers from different biotic and abiotic stresses, which has led to considerable decreases in seed yield. Since the economic value of a cultivar is determined by its phenotypic characteristics, good knowledge of the genetic structure and identification of genomic loci associated with desired traits will facilitate crop breeding. Amplified fragment length polymorphism (AFLP) markers associated with different agro-morphological characteristics, cold and drought tolerance as well as Ascochyta blight resistance were identified in chickpea by using 44 genotypes comprising cultigens, landraces, internationally developed improved lines and wild relatives, evaluated in a randomized complete block design with three replications at the Urmia rainfed research station. Using six AFLP primer combinations, 64 clear and reproducible markers were developed. The polymorphism information content values calculated for each primer pair ranged from 0.155 (EcoR1-ACC/Mse1-CAG) to 0.270 (EcoR1-ACC/ Mse1-CTG) with an average of 0.237. Analysis of molecular variance (AMOVA) revealed that 90% of the total variance was due to differences within populations and 10% due to differences among populations. Using a general linear model and applying multiple testing corrections, 24 AFLP markers associated with genes controlling the studied traits were identified. Some identified markers were associated with more than one trait. The identified markers could be of interest in marker-assisted selection in chickpea breeding programmes.
Introduction
Chickpea (Cicer arietinum L.) as a third major cool-season grain legume in the world is grown in 13.9 million hectares with 13.7 million ton production as of 2014 (http://faostat.fao.org). Stresses caused by high or low temperatures lead to crop yield losses due to damage to reproductive organs [Citation1], floral bud development [Citation2], pollen viability and fertilization [Citation1], pod production, seeds per plant, seed yield [Citation3], seed filling [Citation4] and seed composition [Citation5]. Chickpea may be exposed to low temperatures and excess water early in the growing season (especially if it is planted in the fall) or high temperatures and inadequate water at the end of the growing season [Citation6]. Tolerance to low temperatures in chickpea primarily depends on the weather conditions and the sowing date. High levels of cold tolerance are known in local cultivars and related species such as Cicer bijugum, Cicer reticulatum, Cicer echinospermum, Cicer pinnatifidum and Cicer judaicum [Citation7]. Wery [Citation8], by evaluating 29 chickpea genotypes for frost resistance in Montpellier, France, identified three frost-resistant genotypes, FLIP 81-293C, FLIP 82-127C and FLIP 82-128C. A key recurring problem in the screening for abiotic stress tolerance is environmental heterogeneity [Citation6].
Drought, as another major abiotic stress in many parts of the world [Citation9], causes heavy production losses, 30%–100% [Citation10] in cool-season food legumes [Citation6,Citation11]. Stoddard et al. [Citation6] reviewed the screening techniques in cool-season food legumes and listed 25 drought-resistant chickpea genotypes. Nevertheless, these genotypes are far from possessing the desirable characteristics to grow in farmer fields due to being small seeded and susceptibile to Ascochyta blight [Citation12]. The quantitative inheritance of drought tolerance and its interaction with the environment are the major challenges that exist in identifying drought tolerance genotypes in chickpea [Citation13].
Ascochyta blight (causal agent Ascochyta rabiei) is considered to be a major constraint for chickpea production in cool and wet regions of the world [Citation14]. About 50% yield reduction has been reported to have occurred due to Ascochyta blight epidemics in 1979–1982 [Citation15]. Most of the cultivated chickpea varieties are only partially resistant to this pathogen [Citation16]. Pyramiding quantitative trait loci (QTLs) using marker-assisted selection (MAS) is generally considered an appropriate strategy for improving the tolerance levels of chickpea in breeding programmes. Comparing to other crop species, such as cereals, the advances in the development of genomic resources in the leading legume crops of the semi-arid tropics, especially chickpea (Cicer arietinum), have been very slow [Citation17]. However, these programmes have significantly gained by integrating MAS within empirical selection [Citation18].
Association analysis has been used for identification of markers associated with important traits in several plants species including wheat [Citation19], maize [Citation20], sunflower [Citation21,Citation22] and rice [Citation23]. Darvishzadeh [Citation22] by using 106 dispersed oily sunflower lines genotyped with 30 simple sequence repeat (SSR) and 28 inter-retrotransposon amplified polymorphism (IRAP) and retrotransposon microsatellite amplified polymorphism (REMAP) markers identified the genomic regions associated with agro-morphological traits in sunflower. Sukumaran et al. [Citation24] identified single nucleotid polymorphism (SNP) in chromosome 5A and 6A of spring wheat that were significantly associated with yield and yield components. Chickpea is well suited to association analysis for its self-pollination mating system [Citation25]. Association analysis has been performed in chickpea [Citation26–31] and QTLs controlling different traits, such as flowering time [Citation32], branch number [Citation33], pod and branch number/plant and plant hairiness [Citation34], 100-seed weight and seed coat colour [Citation35,Citation36], seed protein content [Citation37], resistance to Fusarium wilt and Ascochyta blight [Citation38], as well as drought tolerance [Citation26], have been identified.
The power of association analysis to identify and characterize loci/genes associated with different complex traits is highly affected by admixtures of populations [Citation39]. It is generally considered that good understanding of the population structure in an association panel is necessary to avoid identifying false positive correlations between markers and traits [Citation40]. The objectives of the present study were to characterize the population structure within chickpea genotypes and to identify AFLP markers associated with different agro-morphological characteristics, cold and drought tolerance as well as Ascochyta blight resistance in chickpea using association analysis.
Materials and methods
Plant materials
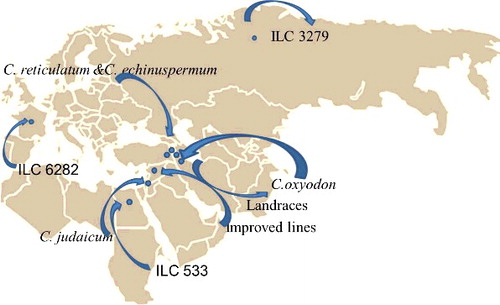
A population of 44 chickpea genotypes comprising cultigens, landraces, internationally developed improved lines and wild relatives was used for association analysis (). The genotypes of the association panel were prepared from six geographically diverse regions including International Center for Agricultural Research in the Dry Areas (ICARDA) (28 genotypes), Turkey (five genotypes), Iran (eight genotypes), USSR (one genotype), Egypt (one genotype) and Spain (one genotype) with Latitude of 5°30 W, 40°02 N to 45°09 E, 37°12 N ().
Table 1. Code and characteristics of 44 chickpea lines used in the present study.
Figure 1. Geographical distribution and origin map of 44 chickpea genotypes.
Phenotypic data evaluations
The selected set was planted in a randomized complete block design with three replications at the Urmia rainfed research station. The traits, including number of stems (NS), plant height (PH), days from the first effective raining after sowing to 50% flowering (DF), days from the first raining after sowing to 90% maturity (DM), 100-seed weight (100SW) and seed yield (YLD) as well as susceptibility to Ascochyta blight (TAB), and cold (CT) and drought tolerance (DT), were recorded (see the Online Supplemental Data). For the visual screening of cold tolerance, we used a scale of 1–9, where 1 denotes resistant, with no visible symptoms of damage; 2, highly tolerant, with slight foliar damage (1%–10% of leaflets show withering) and up to 10% of branches showing withering and drying; 3, tolerant, with slight foliar damage (11%–20% of leaflets show withering) and up to 20% of branches show withering and drying, no plant killing; 4, relatively tolerant, with foliar damage (21%–30% of leaflets show withering) and up to 30% of branches showing withering and drying, no plant killing; 5, intermediate, 41%–60% of leaflets and 21%–40% of branches show withering and drying, up to 5% plant killing; 6, relatively susceptible; 61%–79% of leaflets and 41–60% of branches show withering and drying, 6%–25% plant killing; 7, susceptible, with 81%–99% of leaflets and 61%–90% of branches showing withering and drying, 26%–50% plant killing; 8, highly susceptible, with 81%–99% of leaflets and 91%–99% of branches showing withering and drying, 51%–75% plant killing; and 9, strongly susceptible, with 100% plant killing [Citation41]. For drought tolerance evaluation, also on the basis of ICARDA recommendation, we used the drought tolerance score, where 1 indicated free, early flowering, good early plant vigour, 100% pod setting; 2, highly tolerant, early flowering, good early plant vigour, 96%–99% pod setting; 3, tolerant, early flowering, good early plant vigour, 86%–95% pod setting; 4, moderately tolerant, early flowering, moderate early plant vigour, 76%–85% pod setting; 5, intermediate, medium flowering, poor early plant vigour, 51%–75% pod setting; 6, moderately susceptible, medium flowering, lack of early plant vigour, 26%–50% pod setting; 7, susceptible, late flowering, lack of early plant vigour, 11%–25% pod setting; 8, highly susceptible, late flowering, lack of early plant vigour, 1%–10% pod setting; 9, 100% plants killed, lack of early plant vigour, no flowering, no pod setting [Citation42]. The blight severity was recorded on a 1–9 scale as suggested by Singh and Reddy [Citation43], taking into consideration the extent of damage to foliage, including leaves, petioles and stems.
Genomic DNA isolation, PCR conditions and electrophoresis
Young leaf tissues of two-week-old seedlings were cut and were subjected to vacuum freeze-drying for dehydration. Genomic DNA was extracted from leaf tissues using the modified method described by Dellaporta et al. [Citation44]. An association panel was fingerprinted with six AFLP primer combinations (). To identify the most informative AFLP primer combination, the means of the polymorphism information content value, the effective multiplex ratio and the resolving power of markers (Rp) were considered [Citation45]. The DNA concentration in each sample was adjusted to 50 ng μL−1. To 6.0 μL of diluted DNA in suitable 1.5-mL tubes, 0.25 μL EcoRI, 0.25 μL MseI, 4.0 μL 10X buffer and 9.5 μL ddH2O were added. The tubes were incubated at 37 °C overnight to digest. The DNA digestion step was confirmed by running the products in a 1% agarose gel. In the next step, to 20 μL of digested DNA, 0.5 μL EcoRI adapter, 0.50 μL MseI adapter, 0.50 μL adenosine-5'-triphosphate (ATP) (10 mmol L−1), 1.0 μL T4 DNA ligase, 2.0 μL T4 buffer and 0.5 μL distilled water were added. All tubes were incubated at 37 °C for 3 h. Selective amplification was performed according to the manufacturer's instructions with unlabelled EcoRI and MseI (Generay Biotech, Shanghai, China) primers. For 3.0 μL of pre-amplified products, 3.0 μL EcoRI, 3.0 μL MseI, 1.5 μL 10X buffer, 2.5 μL deoxyribonucleoside triphosphate mixture (dNTPs) (2 mmol L−1), 0.2 μL Tag DNA polymerase (5U μL−1) and 4.5μl H2O were added. Touchdown polymerase chain reaction (PCR) was used for amplification (Eppendorf 5331 Gradient MasterCycler, Hamburg, Germany) as follows: 94 °C for 4 min, 1 cycle of 94 °C for 30 s, 65 °C for 30 s, 72 °C for 1 min and was followed by 10 cycles with a decrease of annealing temperature at 1 °C per cycle. This was followed by 23 cycles of 94 °C for 30 s, 56 °C for 30 s and 72 °C for 1 min.
Table 2. Description of the primers used for amplified fragment length polymorphism analysis.
Four microliters of reaction products were mixed with 1 µL of formamide dye (98% formamide, 10 mmol L−1 ethylenediaminetetraacetic acid (EDTA), 0.25% v/v bromophenol blue and 0.25% v/v xylene cyanol FF) and denatured at 95 °C for 4 min and quenched on ice. The products were resolved in a 1.2% (w/v) metaphor agarose gel (Sigma–Aldrich, St. Louis, MO) in 0.5X Tris-Borate-EDTA (TBE) buffer, stained with ethidium bromide (1.0 μg mL−1) and photographed under ultraviolet (UV) light using a Gel-Doc image analysis system (Gel Logic 212 PRO, Woodbridg, NJ). The standard 50–900 bp AFLP DNA ladder (Fermentas, Carlsbad, CA) was used in the flanking lanes. Compared to polyacrylamide-gel electrophoresis, or automated analysis, agarose-gel electrophoresis is the most-appropriate and safe technology for routine analyses of these types of markers.
Population structure and association analysis
The AFLP data were scored as dominant markers for each locus. Population structure was analysed using a model-based Bayesian approach in the software package Structure 2.3.4 [Citation46]. Five independent runs were performed, setting the number of sub-populations (K) from 1 to 10, the burn in time and MCMC (Markov Chain Monte Carlo) replication number both to 100,000, and a model for admixture and correlated allele frequencies. The K value was determined by the log likelihood for each K; Ln P (D) = L (K), and an ad hoc statistic ΔK based on the second-order rate of change in the likelihood (ΔK) [Citation47]. The appropriate value of K was selected when the estimate of Ln P (D) reached a minimum stable value. Inferred ancestry estimates of individuals (Q-matrix) were derived for the selected sub-population [Citation46]. Association analysis was performed to analyse marker–trait association by the structured association approach using ancestry coefficient (Q-values) estimates as covariate in a general linear model (GLM) function using TASSEL 2.1. Multiple testing corrections were performed by adjusting maker probability values for multiple test runs by a permutation test in the TASSEL 2.1 software.
Results and discussion
Morphological diversity
Analysis of variance revealed significant differences among the studied genotypes for most of the studied traits (). The experimental coefficient of variation (CV) ranged from 2.22 to 89.13. However, for the majority of traits, the values were less than 20%. The number of stems per plant ranged from 1 (C. oxyodon) to 7 (ILWC139); the days from the first effective raining after sowing to 50% flowering, from 168 (Sel95TH1) to 188 days (Flip99-34C and Flip03-46C); the plant height, from 16 (ILWC235) to 78 cm (C. oxyodon); the 100-seed weight, from 12 (Kaka) to 35.6 g (Flip03-46); the seed yield; from 31.8 (ILWC181) to 4190.4 kg ha−1 (ILC8262); the resistance to Ascochyta blight disease, from 2 (wild types, FLIPs and Sel95THs genotypes) to 8 (Sel95THs genotypes); the cold tolerance, from 2 (wild types, FLIPs and Sel95THs genotypes) to 9 (ILC533). Of the studied genotypes, 42.8% were tolerant to drought stress. Most of the studied genotypes showed resistance to Ascochyta blight disease. The majority of chickpea landraces (83.3% and 50%) were susceptible to drought and cold stress, respectively. On the other hand, 78.6%, 50%, 12.1% and 50% of the genotypes from Sel95THs, ILCs and FLIPs groups, respectively, were tolerant to cold stress, whereas 71.4% and 37.5% of the genotypes from Sel95THs and ILCs groups, respectively, were tolerant to drought stress. Most of the FLIPs and ILC genotypes were resistant to Ascochyta blight disease but the majority of the Sel95THs genotypes (85.7%) were susceptible. The studied wild genotypes were tolerant to cold and Ascochyta blight disease. Comparing the studied chickpea types, 80.8% of desi type were cold tolerant, whereas just 16.7% of kabuli types were tolerant. Regarding the tolerance to Ascochyta blight disease, 50% and 83.3% of desi and kabuli types were tolerant, respectively. In terms of drought stress tolerance, 53.8% and 33.3% of the two types were tolerant, respectively (Online Supplemental Data).
Table 3. Mean of square and some statistical parameters for 44 genotypes of chickpea comprising cultigen, landraces, internationally developed improved lines and wild relatives.
The potential seed yield of chickpea, about 6 t ha−1, is far below the world average yield (0.98 t ha−1) [Citation48]. This is due to several complex field environmental factors such as the global climate change [Citation49], rainfed sowing, and poor farm management, lack of well adapted cultivars with low levels of tolerance to different biotic and abiotic stresses. High genetic variability was observed among the chickpea genotypes for the studied agro-morphological traits as well as resistance to biotic and abiotic stresses. Our findings showed that considerable part of genotypes involved in the current minicore germplasm were drought tolerant. Toker et al. [Citation50] reported that, under drought stress conditions, all accessions of perennial wild Cicer species were significantly superior to the annual wild and cultivated chickpeas, including the best tolerant chickpea, ICC4958. The results showed that the chickpea sowing time in dry lands is a major parameter in drought tolerance by accelerating the plant life cycle before dramatic water deprivation. Drought escape through short and/or better timed life cycles, matched with large total biomass, is the primary form of crop adaptation to low rainfall Mediterranean-type conditions [Citation51]. Therefore, achieving successful production under terminal drought stress depends on the development of short-season (earliness) varieties that enable the crop to escape severe soil-water deficits [Citation52]. Drought avoidance as an alternative mechanism corresponds to the maintenance of high tissue water potential and consists in mechanisms that both reduce water loss from plants, via stomatal control of transpiration, and also maintain water uptake through an extensive and prolific root system [Citation53]. In the present study, we took advantage of both mechanisms, so the suitable drought tolerance varieties showed acceptable yield at stressed conditions.
The results showed that Cicer genotypes are well adapted to germination and seedling establishment in moderate conditions, followed by vegetative growth in cooler conditions which are typical following autumn or winter sowing in temperate Mediterranean and cool West Asia regions. The cold tolerance scores of Cicer species indicated that the level of cold tolerance in all accessions of C. reticulatum and C. echinospermum were superior to those of well-known cold tolerant varieties, ILC 8262 and ILC 8617. These results were in agreement with the data reported by Robertson et al. [Citation54] and Singh et al. [Citation55]. They found that most of the accessions of C. bijugum, C. echinospermum and C. reticulatum are tolerant to cold and have significantly higher levels of cold tolerance than cultivars. The results indicated that some desi types, such as Sel 95TH 1716 and Sel 95TH 1744, as well as kabuli types, such as FLIP 93-261C and x03TH21, showed higher cold tolerance during the early seedling stage and withstood temperatures of −15.6 °C without snow covering, under dry cold conditions. The results also indicated that, for colder areas of highlands, genotypes adapted for winter or autumn sowing could be obtained by the use of genes for cold tolerance from the wild Cicer species. In a preliminary screening for cold tolerance, Toker [Citation7] found that 11 accessions of C. reticulatum and 4 accessions of C. echinospermum were highly cold tolerant and superior than that the best cold tolerant cultigens, ILC 8262 and FLIP 93-53C. This was supported by our findings, and the findings of Singh et al. [Citation56].
The results showed that all wild Cicer genotypes and landraces as well as some kabuli types were resistant to Ascochyta blight. Most of desi types showed susceptibility to disease. Reddy and Sing [Citation15] evaluated 9574 desi and 3836 kabuli germplasm accessions from the world collection of chickpea for resistance to Ascochyta blight both in vegetative and podding stages and reported that 11 kabuli and 6 desi accessions were resistant. A major part of reports focus on strategies to minimize the damage caused by Ascochyta blight [Citation16]. Factors such as using Ascochyta blight-free seeds, one to two years of non-host crops for warm and wet areas, 3–4 years crop rotation for cold and dry areas, optimum sowing date, deep sowing, optimizing plant density, balanced nutrition and alternative sowing patterns should be considered as useful means of reducing this disease [Citation16].
Molecular diversity and population structure
Using 6 AFLP primer combinations, 64 clear bands were generated. The number of polymorphic markers varied from 6 (EcoRI-ACC/ MseI-CAG) to 46 (EcoRI-AAC/ MseI-CAG) for primer combinations. Detailed information on the levels of genetic diversity of genotypes is available elsewhere [Citation45].
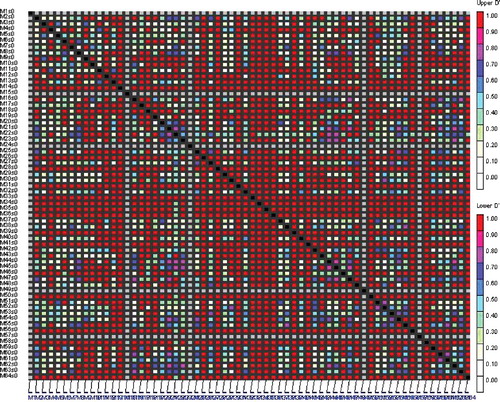
Analysis of population structure was carried out by using a model-based clustering approach that assigns individuals into one or more sub-populations probabilistically based on the allele frequencies detected at different loci [Citation46]. The structure clustering results from K = 2–10 are shown in . As indicated in , the K values (number of sub-populations) steadily kept on increasing until K = 4, indicating that the 44 genotypes in this study are clustered into four sub-populations. Genetic variation among the four identified sub-populations was tested using F-statistics, estimated from pairwise comparisons as a measure of genetic distance between sub-populations. The F-statistics values between sub-populations were significant (P = 0.01) and ranged from 0.02 to 0.96, supporting the existence of genetic structure. Of all genotypes, 65.9% were assigned into the corresponding subgroups, and the remaining ones were categorized into the ‘mixed’ genotypes based on their Q-values ( and ). In our association panel based on AFLP markers, the r2 values ranged from 0.082 to 0.333 with an average of 0.027 and D' ranged from 0.001 to 0.999 with an average of 0.356 (). Of 576 AFLP marker pairs, 7.76% showed a significant level of LD (P < 0.05).
Figure 2. Bilateral charts to determine the optimal number of K identified by Structure program.
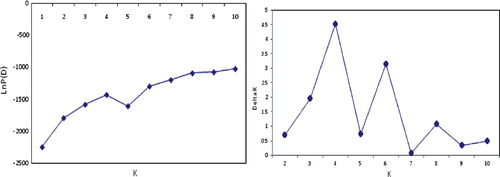
Figure 3. Genetic relatedness of 44 genotypes of chickpea comprising cultigen, landraces, internationally developed improved lines and wild relatives with 6 AFLP primer combinations as analysed by the Structure program.
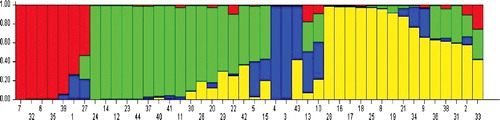
Figure 4. LD plot generated by AFLP marker pairs. The upper diagonal shows the linkage disequilibrium rates (D´) among each pair of markers and the below diagonal corresponds to their P-values.
Association analysis
By applying the GLM procedure and multiple testing corrections in the TASSEL software, one AFLP marker was identified to be associated with genes controlling the stem number; two markers, with the days from the first effective raining after sowing to 50% flowering and two ones, to 90% maturity; two markers, with partial tolerance to Ascochyta blight; one marker, with the 100-seed weight and two ones, with the yield (). None of identified markers for plant height, cold and drought tolerance were statistically significant. Among the identified AFLP markers, six markers were common, whereas 12 ones were specific.
Table 4. QTLs detected for the studied agro-morphological traits in chickpea using the GLM procedure.
The significant level of LD found in the present study supports the idea of using natural populations for genomic studies. Being a predominantly self-pollinating species, chickpea is expected to show higher LD extent, 150–200 Kb [Citation36] and 500–600 Kb [Citation57], than outcrossing species like maize with (≈2 Kb) LD extent [Citation58]. Several factors which cause LD content increasing include low recombination rate, small population size, population admixture, inbreeding, genetic isolation between lineages, population subdivision, genetic drift and epistasis [Citation22,Citation59]. The admixture of populations is the most important factor influencing marker–traits associations [Citation39]. Therefore, good understanding of the population structure is a prerequisite in association mapping and necessary to avoid identifying false-positive correlations between markers and traits [Citation40,Citation60]. Using polymorphic bands produced by six AFLP primer combinations, the association panel subdivided into seven sub-populations. The GLM was used to identify genes controlling some agro-morphological traits in the studied chickpea germplasm mini-core collection. Heretofore a considerable number of QTLs have been identified for desirable agronomic traits in chickpea on different linkage groups (LG 2, 3, 4, 6 and 8) [Citation61]. For instance, Iruela et al. [Citation62] identified three QTLs for resistance to Ascochyta blight on linkage group 4 (LG4) (QTL AR1 and QTL AR2) and 2 (QTL AR3). Cho et al. [Citation63] reported two major QTLs on LG 2 close to the GA16 and TA37 loci controlling the resistance to Ascochyta rabiei pathotype I, as well as two QTLs for resistance to pathotype II on LG 4 such that one is linked to CaETR or GAA47 and the other is linked to TA72/ScY17. Bian et al. [Citation64], by comparing three chickpea LGs comprising QTLs for tolerance to A. rabiei, found that LG3 correspond to the sub-centromere region of chromosome C in chickpea. LG8 is located on the long arm of chromosome H (W-Ca-LG8) and LG4 is located in the sub-centromere region of chromosome B (W-Ca-LG4). Based on bibliography, the majority of AB-resistance QTLs were reported mainly on two LGs, CaLG02 and CaLG04 [Citation61,Citation65]. Two important QTLs (Q3-1 and Q1-1) were reported for drought tolerance from ILC 588 × ILC 3279 population which was located on LG3 and LG1 [Citation66,Citation67]. In order to understand the complex nature of drought tolerance in chickpea, Thudi et al. [Citation68] carried out an association mapping study and identified 15 markers significantly associated with five root traits (root dry weight, root length density, root surface area, root volume and rooting depth). Among them, seven markers showed significant relation with a single trait (rooting depth) and two markers (NCPGR7 and DR_237) showed associations with more than one trait. They concluded that these two markers were associated with co-localized/pleiotropic QTLs. In the case of cold tolerance, we were not able to identify any reported QTLs. The association studies in chickpea have revealed that the linkage-based QTL analyses can be complemented by LD-based association studies [Citation68]. The markers identified in this study could be transferred to sequence characterized amplified region (SCAR) markers to increase the efficiency of MAS in chickpea breeding programmes for biotic and abiotic stresses.
Conclusions
High genetic diversity was observed for the studied agro-morphological traits in the association panel. Using a GLM, several AFLP markers were detected for the studied traits. The identified markers can be transferred to sequence characterized amplified region markers for facilitating MAS. Detection of molecular markers associated with genes controlling different traits could increase the efficiency of MAS in chickpea breeding programmes for biotic and abiotic stresses.
Supplementary_Data.pdf
Download PDF (387.5 KB)Acknowledgments
The authors are grateful to Dr Razban A. and the Institute of Biotechnology, Urmia University, Iran for the scientific support of this work.
Disclosure statement
The authors declare that the research was conducted in the absence of any commercial or financial relationships that could be construed as a potential conflict of interest.
Related Research Data
References
- Hall AE. Breeding for adaptation to drought and heat stress on cowpea. Eur J Agron. 2004;21:447–54.
- Prasad PVV, Boote KJ, Allen LG, et al. Effect elevated temperatures and carbon dioxide on seed set and yield of kidney bean (Phaseolus vulga ris L.). Glob Change Biol. 2002;8:710–21.
- Wang J, Gan YT, Clarke F, et al. Response of chickpea yield to high temperature stress during reproductive development. Crop Sci. 2006;46(5):2171–2178.
- Boote KJ, Allen LH, Prasa PVV, et al. Elevated temperatures and carbon dioxide impact on pollination, reproduction, growth and yield severally globally important crops. J Agric Meteorol. 2005;60(5):469–474.
- Thomas JMG, Boote KJ, Allen LH, et al. Elevated temperature and carbon dioxide effects of soybean seed composition and transcript abundance. Crop Sci. 2003;43:1548–1557.
- Stoddard FL, Balko C, Erskine W, et al. Screening techniques and sources of resistance to abiotic stresses in cool-season food legumes. Euphytica. 2006;147:167–186.
- Toker C. Preliminary screening and selection for cold tolerance in annual wild Cicer species. Genet Resour Crop Evol. 2005;52:1–5.
- Wery J. Adaptation to frost and drought stress in chickpea and implication in plant breeding. In: Saxena MC, Cubero JI, Wery J, editors. Present status and future prospect of chickpea crop production and improvement in the Mediterranean countries. Zaragoza: CIHEAM; 1990. p. 77–85. ( Options Méditerranéennes. Serie A: Séminaires Méditerranéens, No. 9; 1988 Jul 11–13, Zaragoza, Spain).
- Malhotra RS, Sarker A, Saxena MC. Drought tolerance in chickpea and lentil – present status and future strategies. In: Rao JR, editor. Challenges and strategies of dryland agriculture, CSSA Spec. Publ. 32. Madison: (WI): CSSA and ASA; 2004. p. 257–273.
- Leport L, Turner NC, French RJ, et al. Physiological response of chickpea genotypes to terminal drought in a Mediterranean-type environment. Eur J Agron. 1999;11:279–291.
- Subbarao GV, Johansen C, Slinkard AE, et al. Strategies for improving drought resistance in grain legumes. Crit Rev Plant Sci. 1995;14:469–523.
- Toker C, Lluch C, Tejera NA, et al. Abiotic stresses. In: Yadav SS, Redden R, Chen W, Sharma B.. editors. Chickpea breeding and management. Wallingford: CABI; 2007. p. 474–449.
- Cattivelli L, Rizza F, Badeck FW, et al. Drought tolerance improvement in crop plants: an integrated view from breeding to genomics Field Crops Research. 2008;105:1–14.
- Kaur L, sirari A, kumar D, et al. Combining Ascochyta blight and Botrytis grey mould resistance in chickpea through interspecific hybridization. Phytopathol Mediterr. 2013;52(1):157–165.
- Reddy MV, Singh KB. Evaluation of a world collection of chickpea germplasm accessions for resistance to Ascochyta blight. Plant Dis. 1984;68:900–901.
- Gan YT, Siddique KHM, MacLeod WJ, et al. Management options for minimizing the damage by ascochyta blight (Ascochyta rabiei) in chickpea (Cicer arietinum L.). Field Crops Res. 2006;97:121–134.
- Varshney RK, Kudapa H, Roorkiwal M, et al. Advances in genetics and molecular breeding of three legume crops of semi-arid tropics using next-generation sequencing and high-throughput genotyping technologies. J Biosci. 2012;37(5):811–820.
- Ahmad Z, Mumtaz AS, Ghafoor A, et al. Marker assisted selection (MAS) for chickpea Fusarium oxysporum wilt resistant genotypes using PCR based molecular markers. Mol Biol Rep. 2014;41(10):6755–6762.
- Edae EA, Byrne PF, Haley SD, et al. Genome-wide association mapping of yield and yield components of spring wheat under contrasting moisture regimes. Theor Appl Genet. 2014;127(4):791–807.
- Benke A, Urbany C, Stich B. Genome-wide association mapping of iron homeostasis in the maize association population. BMC Genet. 2015 [ cited 2016 Apr 13];16:1. DOI: 10.1186/s12863-014-0153-0.
- Darvishzadeh R, Poormohammad Kiani S, Huguet T, et al. Genetic variation and identification of molecular marker associated with partial resistance to Phoma macdonaldii in gamma-irradiation-induced mutants of sunflower. Can J Plant Pathol. 2008;30:106–114.
- Darvishzadeh R. Population structure, linkage disequilibrium and association mapping for morphological traits in sunflower (Helianthus annuus L.). Biotechnol Biotechnol Equip. 2016;30(2):236–246.
- Anandan A, Anumalla M, Pradhan SK, et al. Population structure, diversity and trait association analysis in rice (Oryza sativa L.) germplasm for early seedling vigor (ESV) using trait linked SSR markers. PLoS ONE. 2016 [ cited 2016 Apr 13];11(3):e0152406. DOI: 10.1371/journal.pone.0152406.
- Sukumaran S, Dreisigacker S, Lopes M, et al. Genome-wide asso ciation study for grain yield and related traits in an elite spring wheat population grown in temperate irrigated environments. Theor Appl Genet. 2015;128(2):353–363.
- Shehzad T, Iwata H, Okuno K. Genome-wide association mapping of quantitative traits in sorghum (Sorghum bicolor (L.) Moench) by using multiple models. Breed Sci. 2009;59(3):217–227.
- Jain D, Chattopadhyay D. Analysis of gene expression in response to water deficit of chickpea (Cicer arietinum L.) varieties differing in drought tolerance. BMC Plant Biol. 2010 [ cited 2016 Apr 13];10:24. DOI: 10.1186/1471-2229-10-24.
- Gaur R, Sethy NK, Choudhary S, et al. Advancing the STMS genomic resources for defining new locations on the intraspecific genetic linkage map of chickpea (Cicer arietinum L.). BMC Genom. 2011 [ cited 2016 Apr 13];12:117. DOI: 10.1186/1471-2164-12-117.
- Hiremath PJ, Kumar A, Penmetsa RV, et al. Large-scale development of cost-effective SNP marker assays for diversity assessment and genetic mapping in chickpea and comparative mapping in legumes. Plant Biotech J. 2012;10:716–732.
- Jain M, Misra G, Patel RK, et al. A draft genome sequence of the pulse crop chickpea (Cicer arietinum L.). Plant J. 2013;74:715–729.
- Ruperao P, Bayer PE, Chan CK, et al. A chromosomal genomics approach to assess and validate the desi and kabuli draft chickpea genome assemblies. Plant Biotech J. 2014;12:778–786.
- Khajuria YP, Saxena MS, Gaur R, et al. Development and integration of genome-wide polymorphic microsatellite markers onto a reference linkage map for constructing a high-density genetic map of chickpea. PloS ONE. 2015 [ cited 2016 Apr 13];10(5):e0125583. DOI:10.1371/journal.pone.0125583.
- Upadhyaya HD, Bajaj D, Das S, et al. A genome-scale integrated approach aids in genetic dissection of complex flowering time trait in chickpea. Plant Mol Biol. 2015;89(4–5):403–420.
- Bajaj D, Upadhyaya HD, Das S, et al. Identification of candidate genes for dissecting complex branch number trait in chickpea. Plant Sci. 2016;45:61–70.
- Saxena MS, Bajaj D, Das S, et al. An integrated genomic approach for rapid delineation of candidate genes regulating agro-morphological traits in chickpea. DNA Res. 2014;21(6):695–710.
- Bajaj D, Saxena MS, Kujur A, et al. Genome-wide conserved non-coding microsatellite (CNMS) marker-based integrative genetical genomics for quantitative dissection of seed weight in chickpea. J Exp Bot. 2015;66:1271–1290.
- Das S, Upadhyaya HD, Bajaj D, et al. Deploying QTL-seq for rapid delineation of a potential candidate gene underlying major trait-associated QTL in chickpea. DNA Res. 2015;22(3):193–203.
- Upadhyaya HD, Bajaj D, Narnoliya L, et al. Genome-wide scans for delineation of candidate genes regulating seed-protein content in chickpea. Front Plant Sci. 2016 [ cited 2016 Apr 13];7:302. DOI: doi.org/10.3389/fpls.2016.00302.
- Varshney RK. Exciting journey of 10 years from genomes to fields and markets: some success stories of genomics-assisted breeding in chickpea, pigeon pea and groundnut. Plant Sci. 2016;242:98–107.
- Zhang Q, Wu C, Ren F, et al. Association analysis of important agronomical traits of maize inbred lines with SSRs. Aust J Crop Sci. 2012;6(6):1131–1138.
- Guo X, Gao A, Liu W, et al. Evaluation of genetic diversity, population structure, and linkage disequilibrium among elite Chinese wheat (‘Triticum aestivum’ L.) cultivars. Aust J Crop Sci. 2011;5(10):1167–1172.
- ICARDA Chickpea international cold tolerance nursery (CICTN-2008) manual. Aleppo: ICARDA; 2008.
- ICARDA Chickpea international drought tolerance nursery (CIDTN-2006) manual. Aleppo: ICARDA; 2006.
- Singh KB, Reddy MV. Inheritance of resistance to Ascochyta blight in chickpea. Crop Sci. 1983;23:9–10.
- Dellaporta SL, Wood J, Hicks JB. A plant DNA mini preparation. Plant Mol Biol Rep. 1983;1:19–21.
- Saeed A, Darvishzadeh R. Genetic diversity in a minicore collection of Cicer accessions using amplified fragment length polymorphism (AFLP). Arch Agron Soil Sci. 2016;62(12):1711–1721.
- Pritchard JK, Stephens M, Donnelly P. Inference of population structure using multilocus genotype data. Genetics. 2000;155:945–959.
- Evanno G, Regnaut S, Goudet J. Detecting the number of clusters of individuals using the software STRUCTURE: a simulation study. Mol Ecol. 2005;14:2611–2620.
- Millan T, Madrid E, Cubero JI, et al. Chickpea. In: De Ron AM, editor. Grain legumes. Handbook of plant breeding. Vol. 10. New York: Springer-Verlag; 2015. p. 85–109.
- Kole C, Muthamilarasan M, Henry R, et al. Application of genomics-assisted breeding for generation of climate resilient crops: progress and prospects. Front Plant Sci. 2015 [ cited 2016 Nov 06];11(6):563. DOI: 10.3389/fpls.2015.00563.
- Toker C, Canci H, Yildirim T. Evaluation of perennial wild Cicer species for drought resistance. Genet Resour Crop Evol. 2007;54:1781–1786.
- Thomson BD, Siddique KHM, Barr MD, et al. Grain legume species in low rainfall Mediterranean-type environments I. Phenology and seed yield. Field Crops Res. 1997;54:173–187.
- Turner NC. Crop water deficits: a decade of progress. Adv Agron. 1986;39:1–51.
- Khan HR, Paull JG, Siddique KHM, et al. Faba bean breeding for drought-affected environments: a physiological and agronomic perspective. Field Crops Res. 2010;115:279–286.
- Robertson LD, Singh KB, Erksine W, et al. Useful genetic diversity in germplasm Germplasm Resour Crop Evol. 1996;43:447–460.
- Singh KB, Ocampo B, Robertson LD. Diversity for abiotic and biotic stress resistance in the wild annual Cicer species. Genet Res Crop Evol. 1998;45:9–17.
- Singh KB, Malhotra RS, Saxena MC. Additional sources of tolerance to cold in cultivated and wild Cicer species. Crop Sci. 1995;35:1491–1497.
- Saxena MS, Bajaj D, Kujur A, et al. Natural allelic diversity, genetic structure and linkage disequilibrium pattern in wild chickpea. PLoS ONE. 2014 [ cited 2016 Apr 11];9(9):e107484. DOI: 10.1371/journal.pone.0107484.
- Bajaj D, Das S, Badoni S, et al. Genome-wide high-throughput SNP discovery and genotyping for understanding natural (functional) allelic diversity and domestication patterns in wild chickpea. Sci Rep. 2015 [ cited 2016 Apr 13];5:12468. DOI: 10.1038/srep12468.
- Semagn K, Bjørnstad Å, Xu Y. The genetic dissection of quantitative traits in crops. Electron J Biotechnol. 2010 [ cited 2016 Apr 13];13(5):e14. DOI: 10.2225/vol13-issue5-fulltext-14.
- Crossa J, et al. Association analysis of historical bread wheat germplasm using additive genetic covariance of relatives and population structure. Genetics. 2007;177(3):1889–1913.
- Sharma M, Ghosh R. An update on genetic resistance of chickpea to Ascochyta blight. Agronomy. 2016 [cited 2016 Apr 12];6:18. DOI: 10.1534/genetics.107.078659.
- Iruela M, Castro P, Rubio J, et al. Validation of Aqtl for resistance to Ascochyta blight linked to resistance to fusarium wilt race 5 in chickpea (Cicer arietinu m L.). Eur J Plant Pathol. 2007;119:29–37.
- Cho S, Chen W, Muehlbauer FJ. Pathotype-specific genetic factors in chickpea (Cicer arieti num L.) for quantitative resistance to Ascochyta blight. Theor Appl Genet. 2004;109:733–739.
- Bian XY, Ford R, Han TR, et al. Approaching chickpea quantitative trait loci conditioning resistance to Ascochyta rabiei via comparative genomics. Australas Plant Pathol. 2007;36:419–423.
- Varshney RK, Mohan SM, Gaur PM, et al. Marker-assisted backcrossing to introgress resistance to fusarium wilt race 1 and Ascochyta blight in C 214, an elite cultivar of chickpea. Plant Genom. 2014 [ cited 2016 Apr 13];7(1):1–11. DOI:10.3835/plantgenome2013.10.0035.
- Rehman AU, Malhotra RS, Bett K, et al. Mapping QTL associated with traits affecting grain yield in chickpea (Cicer arietinu m L.) under terminal drought stress. Crop Sci. 2011;51:450–63.
- Sharma M, Ghosh R. An update on genetic resistance of chickpea to Ascochyta blight. Agronomy. 2016 [ cited 2016 Apr 13];6(1):18. DOI:10.3390/agronomy6010018.
- Thudi M, Upadhyaya HD, Rathore A, et al. Genetic dissection of drought and heat tolerance in chickpea through genome-wide and candidate gene-based association mapping approaches. PLoS ONE. 2014 [ cited 2016 Apr 13];9(5):e96758. DOI: 10.1371/journal.pone.0096758.