
 ?Mathematical formulae have been encoded as MathML and are displayed in this HTML version using MathJax in order to improve their display. Uncheck the box to turn MathJax off. This feature requires Javascript. Click on a formula to zoom.
ABSTRACT
Optimization strategy that encompassed one-factor-at-a-time (OFAT), response surface methodology (RSM), and artificial neural network method was implemented during medium formulation with specific aim for lysine-methionine biosynthesis employing a newly isolated strain of Pediococcus pentosaceus RF-1. OFAT technique was used in the preliminary screening of factors (molasses, nitrogen sources, fish meal, glutamic acid and initial medium pH) before proceeded to optimization study. Implementation of central composite design of experiment subsequently generated 30 experimental runs based on four factors (molasses, fish meal, glutamic acid, and initial medium pH). From RSM analysis, a quadratic polynomial model can be devoted to describing the relationship between various medium components and responses. It also suggested that using molasses (9.86 g/L), fish meal (10.06 g/L), glutamic acid (0.91 g/L), and initial medium pH (5.30) would enhance the biosynthesis of lysine (15.77 g/L) and methionine (4.21 g/L). Alternatively, a three-layer neural network topography at 4-5-2 predicted a further improvement in the biosynthesis of lysine (16.52 g/L) and methionine (4.53 g/L) by using formulation composed of molasses (10.02 g/L), fish meal (18.00 g/L), and glutamic acid (1.17 g/L) with initial medium pH (4.26), respectively.
Introduction
Amino acids are widely applied in food, pharmaceutical, medicine, and chemical industries [Citation1]. They are most commonly utilized as nutritional supplement or as additive in animal feeds. Amino acids are very important element in many metabolic activities. As such, their bioprocessing plays a major role in improving the efficacy of animal protein production contributing to the increase in protein supply [Citation2–4]. Dietary provision for protein inevitably relates to the requirement of amino acids, since they are the building blocks of protein whilst some being the products of protein hydrolysis as well [Citation5–7].
For industrial microbial cultivation process, medium composition plays a critical role due to its major influences on the formation, concentration, and yield of a particular culture's end product [Citation8,Citation9]. As such, optimization of medium is usually a major concern when one is tasked with maximizing the profit [Citation10,Citation11]. For each bioproduct, the process facility and suitable strategies have to be elaborated by a comprehensive and detailed process characterization, which in turn will determine the most relevant process parameters influencing the final yield or productivity affecting the overall process economics [Citation11].
The traditional one-factor-at-a-time (OFAT) approach for optimization exercise can be time-consuming. Nonetheless, it can serve the purpose of coarse estimation of the optimum levels [Citation12–14]. On the other hand, statistical method such as response surface methodology (RSM) enables researchers to design the experiments and evaluating the interactions among factors and responses throughout the study. More researches in recent time have used this approach that combines experimental design, regression modeling techniques, and optimization tool to predict the maximum yield for bioproducts of interest [Citation15–Citation17].
Artificial neural network (ANN) is another means of analysing experimental outputs that is fundamentally different from RSM. Nowadays, the use of ANN in the field of predictive microbiology has inspired several studies [Citation8,Citation18,Citation19]. The attractiveness of ANN as empirical modelling schemes lies in their ability to extract, with high accuracy and irrespective of the degree of nonlinearity existing between system variables, the intrinsic relationships between independent and dependent variables through training of the network on a set of examples representing the phenomenon to be modelled [Citation20]. In other words, ANN is a highly simplified model mimicking the structure of a biological network. A set of biological neurons receive inputs, combines them, presents it as a nonlinear operation on the result, and then output the final result [Citation21,Citation22].
Numerous studies were reported in the literature whereby models were derived based on the RSM and ANN analyses of data-set gained from the same experimental design. ANN and RSM models were then compared for their predictive capacity. Several researchers had reported the combined ANN and RSM model development in various bioprocessing optimization studies [Citation15,Citation16,Citation23–25]. While the use of ANN or RSM optimization method for lactic acid bacteria (LAB) cultivation and protein biosynthesis has been reported [Citation19,Citation25,Citation26]; this is the first such report on lysine–methionine biosynthesis by Pediococcus pentosaceus using these two approaches. The main objective of this study is to optimize the medium formulation and initial medium pH on lysine–methionine biosynthesis by P. pentosaceus RF-1 in accordance to the traditional OFAT and statistical approaches of RSM and ANN.
Materials and methods
Bacterial strain and maintenance
P. pentosaceus RF-1, which is a facultative anaerobe strain, was used and maintained in 5% (v/v) glycerol at −80 °C. The strain was routinely grown in de Man Rogosa Sharpe (MRS) medium. P. pentosaceus RF-1 was locally isolated from fermented milk and has been characterized by full-length 16S rRNA gene sequencing. Phylogenetic analysis had disclosed a taxonomic position of the strain to be closely related to P. pentosaceus ATCC 25 745 with 99% of similarity. The strain was deposited in the Microbial Culture Collection Unit (UNICC), Institute of Bioscience, Universiti Putra Malaysia, under the accession number of UPMC1087 [Citation27].
Cultivation medium
P. pentosaceus RF-1 was incubated at 37 °C for 18 h and agitated at 150 rpm. The strain was cultivated in modified agro-waste medium. Molasses was purchased from Central Sugar Refinery (CSR) Malaysia and fish meal was obtained from Animal Science Department, Faculty of Agrobio, UPM, Malaysia. Cultivation of P. pentosaceus RF-1 was done according to the modified Khan medium [Citation2] consisted of (in g/L) molasses (10 g/L), fish meal (5 g/L), ammonium sulphate, (2 g/L), calcium carbonate (0.02 g/L), potassium di-hydrogen phosphate (0.05 g/L), di-potassium hydrogen phosphate (0.05 g/L), magnesium sulphate (0.2 g/L), glutamic acid (1 g/L), and Tween 80 (1 mL/L).
Molasses would undergo pre-treatment via dilution with distilled water containing 2% (v/v) sodium dihydrogen phosphate in the ratio of 1:1 and autoclaved [Citation28]. The cultivation medium was set to pH 7 with the addition of 1 M NaOH or 1 M HCl. before sterilization at 121 °C for 20 min. After sterilization, the medium was left to cool at room temperature and then added with CaCO3, molasses, and 10% (v/v) of inoculum. The inocula were prepared by inoculating a colony of the strain grown on MRS agar plate into 5 mL of MRS broth in a 100-mL test tube with continuous shaking (100 rpm) on a rotary incubator shaker at 37 °C for 12 h. The submerged batch cultivations for the growth of P. pentosaceus RF-1 were carried out using 250-mL shake flask filled with 150 mL of medium for 18 h. About 3 mL samples were withdrawn at time intervals during the cultivation for the analyses of cell concentration, glucose consumption, and lysine-methionine concentration.
Design of experiment (DOE)
One-factor-at-a-time
The experimental factors and their associated levels for medium formulation and pH adjustment via OFAT experiments are shown in . All experiments were performed in triplicates, and the results were reported as the mean of these replication.
Table 1. Parameters and variables used in OFAT approach.
Central composite design (CCD)
Four variables and five levels were used in this study. The four variables used were molasses, fish meals, glutamic acid, and initial medium pH ().
Table 2. Values of central composite design (CCD) variables.
Response surface methodology (RSM) modelling
The results from CCD were then statistically evaluated by Design Expert 6.0.6 software (Stat-Ease Inc.). Independent variables were allocated a high level (+1) and low level (-1). An axial distance (+α) of 1.6 was chosen to make the design rotatable. Central point was denoted as (0) and maintained at a constant value, as it is providing an unbiased estimate of the process error variance. The centre point was set as mid-point value, and there were six centre points for these particular experiments. The best suited regression model in terms of the two responses of interest, i.e. lysine and methionine concentration was found to be the quadratic model resembling second-order polynomial as per the following equation:(1)
(1) where Y is the lysine and methionine concentration, j is the index numbers of the pattern, xj is the coded variables, β j, β jj, and β jk were linear, quadratic, and interactive coefficient. The F-value was considered to be significant. The lack of fit (LOF) was registered as non-significant and regression produced a good multiple correlation coefficients (R2).
Artificial neural network (ANN) modelling
The same set of CCD group of experimental data, which had been used for the RSM design, was also employed in developing the ANN. Versatile ANN software (Neural Power, Ver. 2.5, CPC-X Software, USA) was chosen to recognize the relevant pattern or regression from tabulated data. They were further divided into two sets to serve for training (30 data) and testing (4 data) purposes. From , the bold number represents the randomly selected testing set. Every network developed would depict four input variables and two output responses; each underwent training for computation of network parameters. The performance of network was consulted concurrently with the testing set during training to avoid ‘over trained’ [Citation16,Citation26]. Training a neural network model means selecting one model from the set of allowed models that minimizes the cost criterion. As to supervise the training, designed networks were trained to the point of exhibiting root-mean-square error (RMSE) which theoretically should be closest to 0.01 (EquationEquation (2(2)
(2) )). The networks correlation coefficient (R) (EquationEquation (3
(3)
(3) )) and determination coefficient (DC) (EquationEquation (4
(4)
(4) )), respectively, are closest or equal to 1:
(2)
(2)
(3)
(3)
(4)
(4) where N is the number of experiments, xobs is the observed value, xp is the predicted value obtained from ANN, xm is the average of actual values, and xpm is the average of predicted value.
Table 3. CCD design matrix for RSM and ANN studies in the cultivation of P. pentosaceus RF-1.
A multilayer full feed-forward neural network was used to predict the model of lysine–methionine biosynthesis. The software allows for 5–30 numbers of neuron selections per layer when designing a network, each with an increment of one neuron at a time. In this experiment, the search for the best topology was restricted to a network containing a single hidden layer. The optimal number of neurons in hidden layers as well as the suitable transfer functions chosen for hidden and output layers (sigmoid, hyperbolic tangent function, Gaussian, linear, threshold linear, and bipolar linear) were manually determined iteratively based on the ability of network to provide the most accurate prediction of the testing set and least minimum of cost function.
Different learning algorithms were used to train the networks. However, a common default for selection is that of back-propagation learning algorithm, during training, a set of inputs is presented to a network of randomly pre-assigned weights. Each neuron in the hidden and output layers first calculates the weighted sum of its inputs and passes the result through a transfer function to produce an estimate of output that corresponds to the input data-set. The result was then compared to the corresponding desired values, and the error is back-propagated through the network to adjust the connection weights according to the learning instruction. This practice is reiterated until the predetermined target RMSE is reached [Citation8].
Analytical methods
Cell and glucose concentrations
A 1 mL of sample was centrifuged (10,000 x g, 10 min, 4 °C) to separate the cell pellet from supernatant. The supernatants were collected for glucose determination [Citation29] with absorbance measured at 540 nm, while cell pellets were used for cell concentration determination [Citation12].
Amino acid concentration
Amino acids were determined preliminary to assured tendency of amino acids in the medium using the quantitative methods by high-performance liquid chromatography (HPLC). For the routine detection, quantitative analysis by acid ninhydrin methods [Citation1,Citation30] was used.
Results and discussion
One-factor-at-a-time (OFAT)
Preliminary optimization of the medium formulation (molasses, nitrogen sources, and glutamic acid) and initial medium pH was conducted in shake-flask experiments () whereby biosynthesis of lysine and methionine by P. pentosaceus RF-1 was demonstrated as a strain-dependent in the culture medium.
Figure 1. Optimization by OFAT on P. pentosaceus RF-1 responses to produce lysine and methionine. (A) Effect of molasses (♦) 1 g/L, (■) 3 g/L, (▴) 5 g/L, (○) 10 g/L, (◊) 12 g/L; (B) effect of nitrogen sources (♦) yeast extract, (□) peptone (▴) PKC (■) fish meal; (C) effect of fish meal (♦) 1 g/L, (■) 3 g/L, (▴) 5 g/L, (∆) 10 g/L, (□) 15 g/L, (•) 20 g/L; (D) effect of glutamic acid (♦) 0.1 g/L, (■) 0.3 g/L, (▴) 0. 5 g/L, (•) 1 g/L, (○) 5 g/L; (E) effect of initial medium pH (♦) pH 5, (■) pH 6, (▴) pH 7, (○) pH 8.
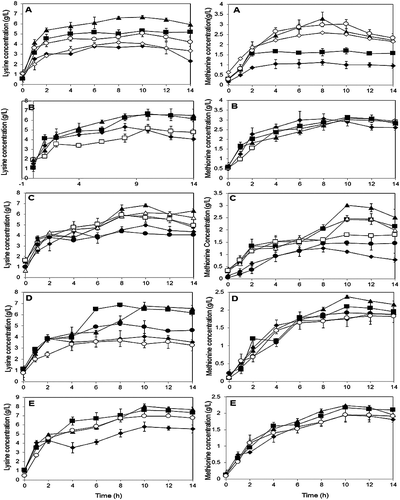
In order to achieve efficient and optimal production, various studies on medium composition had been dedicated to the selection of carbon and nitrogen sources. Molasses, often regarded as a waste from sugar factories was chosen as a prospect for the main carbon substrate in fermentation media. Effect of molasses concentration was carried out ranging from 1 to 12 g/L in the study ((A)). The best concentration was detected at 5 g/L when P. pentosaceus RF-1 produced high lysine and methionine at 6.68 and 3.29 g/L, respectively. Inhibition of cell growth and amino acids biosynthesis was observed when more than 10 g/L molasses was used in formulation.
Nitrogen is used both for functional and structural purposes by different microorganisms. The form of nitrogen has profound effect on the microbial metabolism [Citation12]. (B) evaluates the best candidates for nitrogen source among yeast extract, peptone, palm kernel cake (PKC), and fish meal. Maximum cell concentration of P. pentosaceus RF-1 was observed in medium adopting PKC due to its high nitrogenous compounds and protein value. Nonetheless, fish meal turned out at the top in affecting biosynthesis of lysine (6.67 g/L) and methionine (3.13 g/L). The concentration of fish meal was then varied from 1 to 20 g/L in the following experiments ((C)). Highest biosynthesis of lysine (6.84 g/L) and methionine (3.01 g/L) was detected when using fish meal at 5 g/L. It is worth noted that molasses when coupled with fish meal in the cultivation medium are particularly effective to provide tremendous microbial growth for further exploitation in producing various metabolites, biopolymers, and enzymes [Citation31,Citation32].
Protein-rich fish meal as the sole source of nitrogen depends upon the available level of the limiting amino acid. In this study, glutamic acid addition ranges from 0.1 to 5 g/L. (D) shows that the best concentration of glutamic acid for lysine biosynthesis (6.86 g/L) was detected at 0.3 g/L, whereby it was slightly higher at 0.5 g/L for methionine biosynthesis (2.38 g/L). The addition of glutamic acid is essential due to this substrate occupying in between energy and protein metabolism, and very crucial in cases of metabolic for amino acid mechanism [Citation33,Citation34].
Optimal pH range for the growth of all genus Pediococcus is between 6.0 and 6.5 [Citation35,Citation36]. Effect of initial medium pH experiment was carried out ranging from pH 4 to pH 8. The final result obtained is in agreement with others [Citation36], whereby pH 7 was found to be most suitable for amino acids secretion by microorganism ((E)).
RSM modelling
Findings from the preliminary screening in OFAT experiment were then applied to RSM modelling. Four factors to be optimized were molasses (A), fish meal (B), glutamic acid (C), and initial pH (D), in which they were assigned to a number of runs as determined through CCD. A total of 30 experiments () were conducted to evaluate their effect towards two responses (lysine and methionine synthesis). Results from CCD indicate that both produce optimal responses in experiment no. 16. The corresponding concentrations for factors A, B, C, and D are 10, 15, 1 g/L, and pH of 8, leading to the highest lysine and methionine produced at 14.13 and 4.96 g/L, respectively.
RSM simulation predicts that quadratic model was most suited to describe the relationship between factors and responses. Regression was performed to fit the response function with experimental data, resulting in two full actual models as per the following equations:(5)
(5)
(6)
(6) where lysine and methionine represent the predicted responses; A, B, C, and D are coded values of molasses, fish meal, glutamic acid, and initial medium pH, respectively.
The statistical analysis for significances of all factors was described by analysis of variance (ANOVA) in . The determinations of R2 coefficient, correlation, and model significance (F-value) were used to analyse the adequacy of the model. The quality of fit of the equation was expressed by the DC, R2. A good R2 should be 80% and above [Citation12]. Based on the results, R2 obtained for lysine and methionine are 0.9016 and 0.9039, respectively. These indicated that the models could explain about 90% of the variability, and it was attributed to the independent variables. It has been denoted that good of fit was determined by R2 Adj. The R2 Adj accurately shows that the extraneous factor terms in a derived model equation will affect in some reduction in the calculation of the error sum of squares [Citation16]. In this study, R2 Adj stands at 0.8097 (lysine) and 0.8143 (methionine), respectively, thus indicated an agreement of a good model among the obtained and predicted values for output responses.
Table 4. Regression model from ANOVA on lysine–methionine biosynthesis.
Model significance (F-value) is a measure of variation of the data around the mean. The probability value (Pmodel > F) of less than 0.05 implies that each of these models was considered significant, indicates that the present model can serve as a good prediction of the experimental results. Meanwhile, a result from the experiment was confirmed hence to be acceptable in good agreement relying on the value of the coefficient of variation (CV) that shows lysine at 14.69% and methionine 11.67%, respectively. From , centre points with a coded value (0) were repeated six times to estimate the pure error for the LOF tested. Models with a significant LOF term were not used for predictions, whereas insignificant LOF is the most desirable (p > 0.1). Both models produced LOF that are deemed not significant (Pmodel > F) at 0.1369 and 0.4927, respectively.
From ANOVA analysis (), four independent variables were denoted to have a significant effect on P. pentosaceus RF-1 producing lysine and methionine. A p-value is used as a tool to determine the significance of each coefficient. Every parameter was estimated, and the corresponding p-values for lysine and methionine are shown in . Positive coefficient for A, B, and C was indicated as a linear effect on the response. shows some of the model terms of responses of lysine (A, B, A2, and AC) and methionine (A, B, and A2) which had a p-value <0.05. Therefore, the simplified quadratic model equations (EquationEquations (7(7)
(7) ) and (Equation8
(8)
(8) )) appropriate in describing lysine and methionine biosynthesis are as follows:
(7)
(7)
(8)
(8)
ANN modelling
Thirty experimental runs derived from CCD were also analysed through ANN, whereby the outcomes in terms of the observed, predicted, and absolute deviation of amino acid biosynthesis prediction made by the best neural network constructed are shown in . About 120 network architectures had been developed and tested for the prediction of lysine–methionine biosynthesis by P. pentosaceus RF-1. Following training and testing procedures, describes the effect of different normal feed-forward network architectures on the model residual error, showing three examples of top network architectures that yielded quite a high accuracy compared to the rest. Nonetheless, only one network was selected as the best predictor based on the error reduction criterion.
Table 5. Observed, predicted, and absolute deviation of lysine–methionine biosynthesis by ANN.
Table 6. The effect of different normal feed-forward network architectures on the model residual error in the prediction of lysine–methionine biosynthesis by P. pentosaceus RF-1.
Training a neural network entails selecting a learning algorithm that can minimize the error or cost criterion. implies that ANN modelling of experimental data-set leading to the least residual error calculated was either trained using batch back propagation (BBP) or incremental back propagation (IBP). IBP is most adequate for the purpose of network training when both the training and, more importantly, the testing sets are able to return prediction values exhibiting the lowest RMSE and networks correlation coefficient (R) and DC closest to 1.0. The details of the learning algorithm have been reported elsewhere [Citation15,Citation18,Citation37].
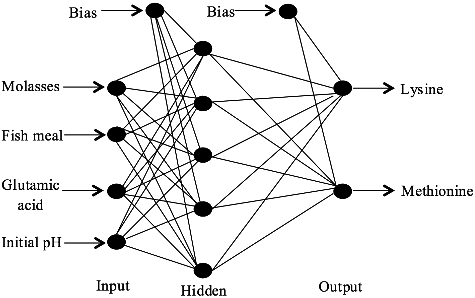
As for the best network design in terms of accuracy of which it is assigned as set no. 1, it has three layers with network topology of 4-5-2 (). Output response for lysine when allied with sigmoidal function for hidden layer and linear function for output layer produces RMSE, R, and DC are at values of 1.83, 0.98, and 0.85, respectively. In addition, the output that predicted methionine using the same topology of neural network registers RMSE, R, and DC at values of 0.61, 0.99, and 0.85. This network consequently compromises a good bias and variance, and model explanation could promote a good generalization. It was reported in literature that one hidden layer is typically adequate to provide an accurate prediction, and it could be the first choice for any practical feed-forward network design [Citation22]. Hence, a single hidden layer network was used in this study.
Figure 2. Finalized topology of neural network architecture (4-5-2) trained by incremental back propagation (IBP) for the estimation of lysine–methionine biosynthesis.
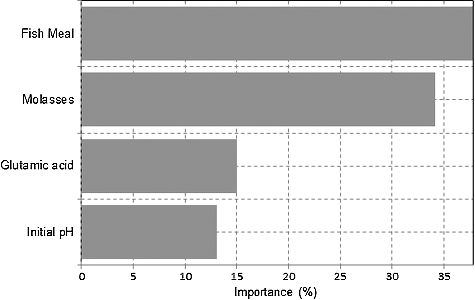
illustrates the level of importance (in percentages) or effectiveness of each factor (medium constituent) when analysed with Neural Power. The highest level of significance was attributed to fish meal (37.79%), followed by molasses (34.16%), glutamic acid (15%), and initial medium pH (13.05%). Numerous investigators have looked for ways of producing microbial amino acids using inexpensive media. In this study, P. pentosaceus RF-1 is shown to tolerate fish meal in the medium formulated as it is required for growth and amino acids biosynthesis. Fish meal provides not only a relatively larger proportion of proteins and nucleic acid but also more growth factor as compared to other nitrogen used [Citation2,Citation32,Citation38].
Figure 3. The level of importance of effective medium constituents on lysine–methionine biosynthesis.
The second-ranked molasses contain a high concentration of C6 to support the fermentation process; it is also an enriched source of ‘B’ vitamin [Citation2,Citation28,Citation31]. However, this study revealed that utilization of molasses is rather limited to not more than 12 g/L in the medium due to inhibitive effect on the growth of P. pentosaceus RF-1. In fact, very high concentration of molasses would obviously darken the medium, or it could provide a complex Maillard reaction with fish meal for P. pentosaceus RF-1 to effectively grow.
Glutamic acid does not simply function as an energy source, but also as a precursor for nucleotides, guanosine triphosphate, purine, and pyrimidine, hence providing an essential component for the cell replication [Citation33]. Most LAB depends on the addition of glutamic acid into the medium [Citation34]. It has also exhibited a growth action of LAB in amino acid biosynthesis [Citation4,Citation6].
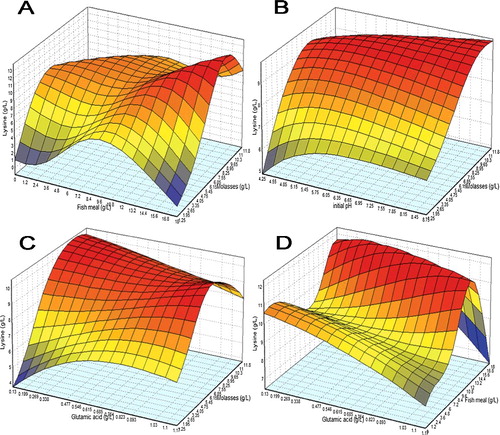
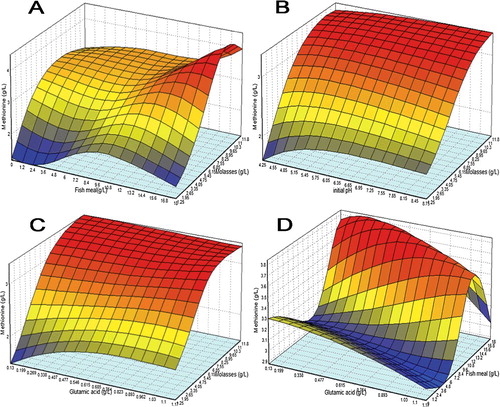
shows the three-dimensional plots describing the interaction of four factors on lysine biosynthesis as predicted by the best ANN network that are quite similar to representation by RSM (data not shown). From (A), too high an increase in molasses concentration eventually causes a reduction in lysine whilst biosynthesis actually peaked in the mid-range of fish meal. On the other hand, (B) depicts that too low of pH would inhibit product secretion but an increase in the pH range actually causes not too much improvement in lysine biosynthesis as compared to molasses. (C,D) interestingly shows that in some area of response curve, glutamic acid has an inverse relation with molasses and fish meal, lower concentration of glutamic acid is actually preferred when the concentration of molasses or fish meal was increased to a very high proportion in the medium formulation.
Figure 4. 3D response surface plot for lysine biosynthesis with the interaction between (a) molasses with fish meal, (b) initial pH with molasses, (c) glutamic acid with molasses, and (d) glutamic acid with fish meal as modelled by ANN.
depicts surface plots for methionine biosynthesis with the interaction between molasses with fish meal ((A)), initial pH with molasses ((B)), glutamic acid with molasses ((C)), and glutamic acid with fish meal ((D)) as modelled by the neural network. When molasses concentration was fixed at 10 g/L, methionine biosynthesis increases, as glutamic acid and fish meal concentrations were raised to a certain level, methionine production starts to regress. The interaction between initial medium pH with molasses ((B)) and glutamic acid with molasses ((C)) shows similarity in trend.
Figure 5. 3D response surface plot for methionine biosynthesis with the interaction between (a) molasses with fish meal, (b) initial pH with molasses, (c) glutamic acid with molasses, and (d) glutamic acid with fish meal as modelled by ANN.
Comparison between OFAT, RSM, and ANN
shows the follow-up experimental results that validate the new medium formulations as suggested by ANN as well as RSM simulation when compared to the optimal points from OFAT which are as follows: molasses (5 g/L), fish meal (5 g/L), glutamic acid (0.3 g/L), and initial medium pH 7. Validation experiments were required to verify the suggested maximum achievable concentration of lysine and methionine from the fermentation of P. pentosaceus RF-1. Based on the best point optimization function in Design Expert which possess a desirability factor closest to 1.0 (most desirable condition), RSM simulation had suggested that molasses to be set at 9.86 g/L, fish meal at 10.06 g/L, glutamic acid at 0.91 g/L, and initial medium pH 5.3. As for ANN, forecasting on the best possible medium formulation was made by solving the previous best network model through Rotation Inherit Optimization solver module of NeuralPower which in turn yielded a different recipe: molasses (10.02 g/L), fish meal (18 g/L), glutamic acid (1.17 g/L), and initial medium pH (4.26). All three conditions were tried on P. pentosaceus RF-1 subjected to 18-h batch cultivation.
Table 7. Validation results of medium formulation and medium pH as suggested by ANN and RSM model with comparison to OFAT.
depicts the comparison between OFAT, RSM, and ANN recipes on P. pentosaceus RF-1 cell concentration, glucose consumption, and lysine–methionine biosynthesis. Observation made on the three media formulated via OFAT, RSM, or ANN indicates that P. pentosaceus RF-1 initially experienced a lag phase in the first 2 h of cultivation. Exponential growth phase ensued until 12-h cultivation for culture to gain high cell growth (Xmax) before reaching stationary phase. For medium using ANN and RSM formula, measured maximum cell growth at 12 h of cultivation was approximately 1.24 ± 0.046 and 1.154 ± 0.019 g/L, respectively. Cell density was slightly higher in OFAT-based formulation with Xmax achieved at 1.31 ± 0.01 g/L. During exponential phase of cell growth, the maximum amount of lysine–methionine production was also observed, implying that the biosynthesis of lysine–methionine is a growth-associated process.
Figure 6. Comparison on (A) cell density, (B) substrate consumption, (C) lysine, and (D) methionine biosynthesis by P. pentosaceus RF-1 using ANN, RSM, and OFAT in shake-flask experiment: (■) ANN, (□) RSM, (•) OFAT.
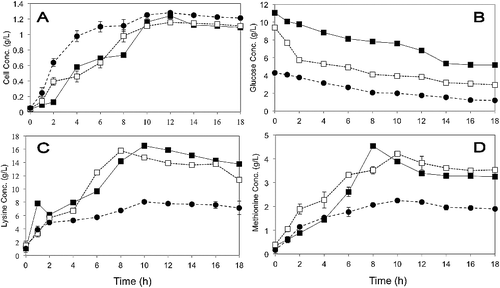
Generally, the statistical approaches of RSM and ANN are sequential strategies which enable us to design, analyse, and find the optimum level and assessing the interrelationship effects of factors leading to the higher growth of P. pentosaceus RF-1. Both approaches have a similar prominence on lysine–methionine biosynthesis by P. pentosaceus RF-1. It was found that actual biosynthesis of lysine and methionine using ANN suggested recipe produced 16.52 ± 0.18 and 4.53 ± 0.03 g/L against the predicted values of 14.45, and 4.34 g/L, respectively. It was apparent that the medium formulated through ANN slightly improved on the biosynthesis of lysine–methionine by P. pentosaceus RF-1 when cultured in medium proposed by RSM (an increase of 4.8% for lysine and 7.6% for methionine).
Conclusion
The statistical based models provide good predictions for the independent variables regarding lysine–methionine production whereby the superior ANN signified more precision among the predictions made. RSM-derived formulation demonstrated maximum lysine and methionine biosynthesis at 15.77 ± 0.10 and 4.21 ± 0.08 g/L, respectively. The predicted values from RSM model were somewhat comparable with the experimental values obtained. Finally, as a measure of comparison, it is quite apparent from the data obtained that the improvement of medium constituent undertaken through a more systematic statistical approach has a sound merit given that ANN- and RSM-based formulation managed to encouragingly increase the biosynthesis of lysine–methionine by as much as 100% against that of OFAT method.
Acknowledgments
The authors would like to acknowledge the Department of Bioprocess Technology and Institute of Tropical Agriculture and Food Security, Universiti Putra Malaysia for the research facilities.
Disclosure statement
No potential conflict of interest was reported by the authors.
Additional information
Funding
Related Research Data
References
- Shakoori FR, Butt AM, Ali NM, et al. Optimization of fermentation media for enhanced amino acids production by bacteria isolated from natural sources. Pak J Zool. 2012;44:1145–1157.
- Khan SH, Rasool G, Nadeem S. Bioconversion of cane molasses into amino acids. Pak J Agric Sci. 2006;43:157–161.
- Khattak FM, Pasha TN, Hayat Z, et al. Enzymes in poultry nutrition. J Anim Poult Sci. 2006;16:1–7.
- Liu SQ, Holland R, Crow VL. The potential of dairy lactic acid bacteria to metabolise amino acids via non-transaminating reactions and endogenous transamination. Int J Food Microbiol. 2003;86:257–269.
- Fumiere O, Veys P, Boix A, et al. Methods of detection, species identification and quantification of processed animal proteins in feedingstuffs. Biotechnol Agric Soc Environ. 2009;13:59–70.
- Kranenburg RV, Klereebezem MB, Vlieg JVL, et al. Flavour formation from amino acids by lactic acids bacteria: predictions from genome sequence analysis. Int Dairy J. 2002;12:111–121.
- Leuchtenberger W, Huthmacher K, Karlheinz D. Biotechnological production of amino acids and derivatives: current status and prospects. Appl Microbiol Biotechnol. 2005;69:1–8.
- Basri M, Rahman RNZRA, Ebrahimpour A, et al. Comparison of estimation capabilities of response surface methodology (RSM) with artificial neural network (ANN) in lipase-catalyzed synthesis of palm-based wax ester. BMC Biotechnol. 2007;7:53.
- Bibhu PP, Ali M, Salem J. Fermentation process optimization. Res J Microbiol. 2007;2:201–208.
- Parra R, David A, Naresh M. Medium optimization for the production of the secondary metabolite squalestatin S1 by a Phoma species combining orthogonal design and response surface methodology. Enzyme Microbiol Technol. 2005;37:704–711.
- Schmidt FR. Optimization and scale up of industrial fermentation processes. Appl Microbiol Biotechnol. 2005;68:425–435.
- Nor MN, Mohamad R, Foo HL, et al. Improvement of folate biosynthesis by lactic acid bacteria using response surface methodology. Food Technol Biotechnol. 2010;48:243–250.
- Hu Y, Qin H, Zhan Z, et al. Optimization of Saccharomyces boulardii production in solid state fermentation with response surface methodology. Biotechnol Biotechnol Equip. 2016;30(1):173–179.
- Rosfarizan M, Ariff AB, Hassan MA, et al. Kojic acid production by Aspergillus flavus using gelatinized and hydrolyzed sago starch as carbon sources. Folia Microbiol. 1998;43:459–464.
- Dasari VRRK, Donthireddy SRR, Nikku MY, et al. Optimization of medium constituents for Cephalosporin C production using response surface methodology and artificial neural networks. J Biochem Technol. 2009;1: 69–74.
- Mohamed MS, Tan JS, Mohamad R, et al. Comparative analyses of response surface methodology and artificial neural network on medium optimization for Tetr aselmis sp. FTC209 grown under mixotrophic condition. Sci World J. 2013;1–14.
- Tan JS, Ramanan RN, Ling TC, et al. Comparative of predictive capabilities of response surface methodology and artificial neural network for optimization of periplasmic interferon-α2b production by recombinant Escherichia coli. Minerva Biotechnol. 2010;22:63–73.
- Basheer IA, Hajmeer M. Artificial neural networks: fundamentals, computing, design, and application. J Microbiol Methods. 2000;43:3–31.
- Dziuba B, Nalepa B. Identification of lactic acid bacteria and propionic acid bacteria using ftir spectroscopy and artificial neural networks. Food Technol Biotechnol. 2012;50:399–405.
- Poirazi P, Leroy F, Georgalaki MD, et al. Use of artificial neural networks and a gamma-concept-based approach to model growth of and bacteriocin production by Streptococcus macedonicus aca-dc 198 under simulated conditions of kasseri cheese production. Appl Environ Microbiol. 2007;73:768–776.
- Moghaddam MG, Khajeh M. Comparison of Response Surface Methodology and Artificial Neural Network in Predicting the Microwave-Assisted Extraction Procedure to Determine Zinc in Fish Muscles. Food Nutr Sci. 2011;2:803–808.
- Moghaddam MG, Ahmad FBH, Basri M, et al. Artificial neural network modeling studies to predict the yield of enzymatic synthesis of betulinic acid ester. Electron J Biotechnol. 2010;12:1–12.
- Yadav M, Sehrawat N, Sangwan A, et al. Artificial Neural Network (ANN): application in media optimization for industrial microbiology and comparison with Response Surface Methodology (RSM). Adv Appl Sci Res. 2013;4:457–460.
- Nelofer R, Ramanan RN, Abdul Rahman RNZR, et al. Comparison of the estimation capabilities of response surface methodology and artificial neural network for the optimization of recombinant lipase production by E. coli BL21. J Ind Microbiol Biotechnol. 2012;39:243–254.
- Bordoloi H, Sarma KK. Protein structure prediction using artificial neural network. Special Issue Int J Comput Appl. 2011;3:22–24.
- Uppada SR, Balu A, Gupta AK, et al. Modeling lipase production from co-cultures of lactic acid bacteria using neural networks and support vector machine with genetic algorithm optimization. Int J Emerg Technol Comput Appl Sci. 2014;9:38–43.
- Norfarina MN, Chwen LT, Raha AR, et al. 2014. Evaluation of lactic acid bacteria as amino acid producer for poultry feed additive formulation. Poster presented in the 35th Annual Conference of Malaysian Society of Animal Production (MSAP), Riverside Majestic Hotel Kuchingth. Sarawak, Malaysia.
- Abdul Razack S, Velayutham V, Thangavelu V. Medium optimization for the production of exopolysaccharide by Bacillus subtilis using synthetic sources and agro waste. Turkish J Biol. 2013;37:280–288.
- Miller GL. Use of Dinitrosalycilic acid reagent for determination of reducing sugar. Anal Chem. 1959;31:426.
- Chinard FP. Paper chromatography. J Biol Chem. 1952;199:91.
- Mao Y, Tian C, Zhu J. Production of novel biopolymer by culture of B. cereus B11 using molasses wastewater and its use for dye removal. Adv Mater Res. 2011;230–232:1119–1122.
- Rebah FB, Miled N. Fish processing wastes for microbial enzyme production: a review. Biotechnology. 2013;3:255–265.
- Meijer GAL, Meulen JVD, Vuuren AMV. Glutamine is a potentially limiting amino acid for milk production in dairy cows: a hypothesis. Metabolism. 1993;3:358–364.
- Pollack MA, Lindner M. Glutamine and glutamic acid as growth factors for lactic acid bacteria. J Biol Chem. 1942;143:655–661.
- Dicks LMT, Endo A. Taxonomic status of lactic acid bacteria in wine and key characteristics to differentiate species. South Afr J Enol Viticol. 2009;30:72–90.
- Fernandez PAA, Saguir FM, De Nadra MCM. Effect of amino acids and peptides on growth of Pediococcus pentosaceus from wine. Latin Am Appl Res. 2003;33:225–229.
- Shihab K. A backpropagation neural network for computer network security. J Comput Sci. 2006;2:710–715.
- Hayek SA, Ibrahim SA. Current limitations and challenges with lactic acid bacteria: a review. Food Nutr Sci. 2013;4:73–87.