
ABSTRACT
The root of Aconitum carmichaelii Debeaux is used in Oriental folk medicine, but its cultivation is very labour intensive. Therefore, it is important to dissect the genetic mechanism of agronomic traits to breed elite cultivars for commercial cultivation. We analyzed the genetic diversity of 126 genotypes of A. carmichaelii collected from the major productive regions in China based on 280 amplified fragment length polymorphism (AFLP) loci. The values of the coefficient of gene differentiation, Nei's gene diversity index, and Shannon's information index, and the results from a hierarchical analysis of molecular variance analysis indicated that there is more genetic variability within populations than between populations. Marker–trait association analyses were conducted under a general linear model without controlling for population structure, and under a relative kinship model. In total, 59 loci were identified under both models for plant height (PH), stem diameter (SD), lateral root number (LRN), fresh weight and dry weight of stem (FWS and DWS, respectively), fresh weight and dry weight of leaves per plant (FWL and DWL, respectively), and fresh weight (FWR) and dry weight of individual lateral roots (DWR). Thirty-eight loci were associated with two to eight traits. For example, P1M1-39 was associated with variations in DWR, DWS, FWS, SD, DWL, FWL, FWR and PH, and P1M1-14 was close to a locus associated with variations in DWR, DWS, FWS, DWL, FWL, PH, FWR and LRN. Loci associated with favourable traits should be combined in commercial varieties to improve the yield and quality of A. carmichaelii.
Introduction
The root of aconite (Aconitum carmichaelii Debeaux; 8n = 64) is an important material in Oriental folk medicine, and has been popularly used in herbal medicines in Asia for several thousand years. Such medicines treat rheumatism, arthritis, bruises, fractures and pain. The first record of their use was in Shen Nong's Herbal [Citation1–4]. The herb A. carmichaelii has been cultivated in China for medical use for more than 1000 years, and is mainly grown in the Sichuan, Yunnan and Shanxi provinces of China. The gross output of A. carmichaelii is much greater than those of traditional cereal crops such as wheat, rice and maize. However, the cultivation of A. carmichaelii is labour intensive because redundant lateral roots, leaves, and tops must be removed to increase the yields of the first and second ‘daughter’ roots (Figure S1a–S1f in the Online supplemental data) [Citation5]. Therefore, it is very important to breed elite cultivars with suitable agronomic traits for commercial cultivation of A. carmichaelii.
Although A. carmichaelii plants can be raised from seeds, the plants take 2–3 years to flower and grow acceptable quantities of lateral roots (Figure S1e in the Online supplemental data). The lateral roots can generate stronger plants than those grown from seeds. Therefore, the propagation of A. carmichaelii is usually by division of lateral roots. This mode of reproduction has led to a high frequency of genetic heterozygosity among cultivated populations. In addition, A. carmichaelii is an octoploid species. All of these factors are serious obstacles in attempting to develop ‘pure lines’ and segregating populations that are essential for plant breeding and genetic studies. Therefore, genetic studies and breeding of A. carmichaelii have progressed slowly.
The genomewide association approach can overcome the limitations of traditional bi-parental quantitative trait loci (QTL) mapping because a diverse germplasm is analyzed in a single study. Furthermore, this approach can identify alleles overlapping with lowerresolution QTLs that have been identified in recombinant inbred line populations [Citation6–9]. Therefore, this method is more efficient and less expensive than traditional QTL mapping using a bi-parental population. Association mapping has been widely used in wheat, maize and rice to detect QTLs for important traits, including disease resistance, quality, yield and various yield components [Citation10–14].
In the present study, we used the amplified fragment length polymorphism (AFLP) technique to analyze the genetic diversity of 126 lines of A. carmichaelii and to conduct a marker–trait association (MTA) analysis. The objectives of the present study were as follows: (1) to analyze the genetic diversity and population structure of cultivated lines collected from the main productive regions in China; and (2) to identify markers associated with yield, yield components and various morphological traits.
Materials and methods
Plant materials
The analyzed population of A. carmichaelii included 126 diverse genotypes collected from the major A. carmichaelii-producing regions of Jiangyou, Anxian, Beichuan and Butuo in Sichuan Province, and Hanzhong and Mianxian in Shanxi Province (). Fifty-three accessions were collected from Jiangyou because this is a major A. carmichaelii-producing area yielding more than 500 million kg/year, almost one-third of the total A. carmichaelii yield in China. All genotypes were collected from large drug-farms and propagated by division of lateral roots.
Table 1. Geographic origin of 126 diverse genotypes.
Experimental design and phenotypic trait evaluation
The collected genotypes were planted in Jiangyou at an altitude of 1100 m. Each line was planted in five 1.5-m rows, with 10-cm spacing between plants. Phenotypic evaluations were conducted in 2014. For each genotype, 10 representative leading plants in the middle row were selected to measure plant height (PH), stem diameter (SD), lateral roots number (LRN), fresh weight of stem (FWS), fresh weight of leaves per plant (FWL), dry weight of stem (DWS) and dry weight of leaves per plant (DWL) in August. The fresh weight of individual lateral root (FWR) and dry weight of individual lateral root (DWR) were determined from 10 randomly selected lateral roots with three replications.
Amplified fragment length polymorphism analysis
For each line, genomic DNA (250 ng) was completely digested with 5 U MseI and 10 U EcoRI (Sangon Biotechnology Co. Ltd., Shanghai, China). The double-digested DNA fragments were ligated to 5 pmol EcoRI and 50 pmol MseI adaptors. In pre-selective amplifications, each 20-µL reaction mixture contained 2 µL adaptor-ligated DNA, 0.8 µL EcoRI adaptor +A primer (10 pmol), 0.8 µL MseI +C primer, 1 × reaction buffer (10 mmol/L Tris–HCl (pH 8.3), 50 mmol/L KCl and 1.5 mmol/L MgCl2), 0.4 U Taq DNA polymerase (Sangon Biotechnology Co. Ltd.) and 0.4 µL deoxynucleotide triphosphates (dNTPs; 10 mmol/µL). The thermal cycling conditions were as follows: 25 cycles of 95 °C for 30 s, 55 °C for 30 s, and 72 °C for 60 s (T100™ Thermal Cycler, Bio-Rad, Hercules, USA). The pre-amplification product was diluted 50 times with Tris–ethylenediaminetetraacetic acid (TE) buffer and subjected to selective amplifications.
Selective amplifications were performed with 2 µL diluted pre-amplification product and 30 ng each selective nonlabeled +3 primer, 2 × buffer (20 mmol/L Tris–HCl (pH 8.4), 1.5 mmol/L MgCl2, and 50 mmol/L KCl), 0.4 μL dNTPs (10 pmol/L), and 0.4 U Taq DNA polymerase (Sangon Biotechnology Co. Ltd.). Selective amplification was carried out for one cycle at 94 °C for 30 s, 65 °C for 30 s and 72 °C for 60 s, and the annealing temperature was then repeatedly lowered by 0.7 °C for each of the next 12 cycles, followed by 24 cycles at 94 °C for 30 s, 56 °C for 30 s, and 72 °C for 60 s. Amplified samples were separated in a 6% polyacrylamide gel. The DNA fragments were scored as ‘1’ and ‘0’, where ‘1’ indicates the presence and ‘0’ indicates the absence of each AFLP fragment. The 10 combinations used for selective amplifications are shown in . The combinations of primers were as follows: P1M1, P2M1, P2M2, P3M3, P4M3, P4M4, P4M5, P4M6, P5M5 and P6M6.
Table 2. Oligonucleotide sequences used in AFLP analysis.
Statistical analysis
The complete set of phenotypic data was subjected to analysis of variance (ANOVA) to determine the main effects of genotype and replication factors using SAS version 9.1 [Citation15]. The raw data matrix was subjected to a geographic population genetic analysis using POPGENE version 1.31. The analyses were performed using the model for dominant markers with haploid individuals at two levels; that is, within populations and between populations [Citation16]. The following parameters were estimated: percentage of polymorphic loci (P), Shannon's information index, Nei's gene diversity (He), genetic distance (D) and coefficient of gene differentiation (GST). Hierarchical analysis of molecular variance (AMOVA) was used to estimate within- and between-population diversity using Arlequin 3.0 with 1000 bootstrap replicates [Citation17].
MTA analysis
To determine population structure, we applied the admixture model with correlated allele frequency using the STRUCTURE software [Citation18]. A burn-in of 100,000 iterations followed by 150,000 Monte Carlo Markov Chain (MCMC) replicates was conducted to test k values in the range of 1–15. To evaluate MTAs, two models were used to evaluate the effects of population structure (Q) and relative kinship (K) on three traits: (1) the general linear model (GLM) without controlling for population structure and relative kinship; and (2) the Q+K model controlling for population structure and relative kinship. The Q+K model was applied using the mixed linear model (MLM) in TASSEL v.2.1 [Citation19,Citation20].
Results and discussion
Phenotypic traits
In Chinese folk medicine, the geographical origin and phenological phase of a medicinal plant are considered so important in terms of its use that there is a specific term, ‘Dao Di’, to refer to the highest quality of herbs that are collected from the best region at the optimal time [Citation21]. The quality and yield of traditional Chinese medicines depend on the cultivation and environmental conditions [Citation22]. There were significant differences (ANOVA, P < 0.05) among genotypes for most traits analyzed in this study. The mean plant heights of individual lines ranged from 17.8 cm to 148.0 cm. The stem diameters ranged from 0.15 cm to 0.61 cm. The dry weight of the stem ranged from 5.3 g to 11.7 g, and the fresh weight of the stem ranged from 10.8 g to 40.1 g. The dry weight of leaves per plant ranged from 5.2 g to 9.9 g, and the fresh weight of leaves per plant ranged from 10.1 g to 57.6 g. The lateral root number per plant ranged from 1 to 14. The dry weight of individual lateral roots ranged from 11.2 g to 27.6 g, and the fresh weight of individual lateral roots ranged from 24.9 g to 63.3 g (). The phenotypic investigation result indicated that all investigated traits varied widely among the 126 lines collected from drug farms. However, all lines must meet the requirements of the Chinese Pharmacopoeia 2010 when grown in their environment of origin. Therefore, the quality of A. carmichaelii is dependent not only on the environmental conditions, but also on the cultivation conditions.
Table 3. Phenotypic variations for nine traits.
AFLP and genetic diversity analysis
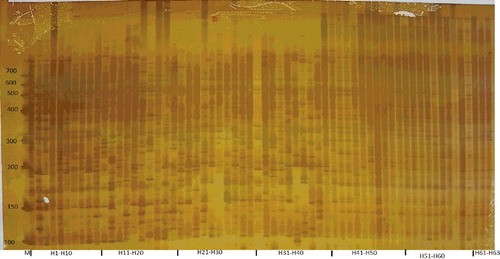
In previous studies, the genetic diversity among A. carmichaelii populations has been studied using random amplified polymorphic DNA (RAPD), random amplified microsatellite polymorphism (RAMP) and inter simple sequence repeat (ISSR) marker-based methods [Citation23–25]. In this study, 12 different primers were used in 10 combinations in an AFLP fingerprinting analysis. Among a total of 327 identified AFLP bands, 280 (85.63%) were polymorphic with clear and reliable separation patterns (, ). The polymorphism rate of AFLP is lower than those detected using RAPD and ISSR markers, but higher than that detected using RAMP markers. However, the average number of polymorphic loci was 28 for AFLPs, which is higher than the values obtained using RAPD, RAMP and ISSR markers. Therefore, AFLP markers are powerful and valuable tools that can be used for genetic analyses of A. carmichaelii.
Table 4. Genetic diversity and differentiation of 10 AFLP primer combinations.
Figure 1. AFLP profile obtained using P2M2 in 63 lines of Aconitum carmichaelii.
The average values of He, Shannon's information index and GST among all the primer combinations were 0.416, 0.601 and 0.334, respectively. Among all the primer combinations, P2M1 resulted in the highest He and Shannon's information index values (0.457 and 0.648, respectively) and P4M4 the lowest (0.322 and 0.498, respectively). The average values of P, He and Shannon's information index for all populations were 0.635, 0.267 and 0.399, respectively. The P-5 population showed the lowest He and Shannon's information index values (0.216 and 0.329, respectively), and the P-1 population showed the highest (0.294 and 0.438, respectively) (). The primer combination P2M2 showed the lowest GST (0.228), whereas P3M3 showed the highest (0.412). The average GST of 0.334 indicated that 33.4% of the variation was between populations and the rest (66.6%) was within populations. The results of the AMOVA analysis also indicated that most of the variation was within populations (86.25%, p < 0.01). Nybom [Citation26] proposed that cross-pollinating and long-lived species retain more genetic variability within populations than between populations. This idea is consistent with the values of GST, He and Shannon's information index, and with the results of the AMOVA analysis of A. carmichaelii in the present study. The obtained results are also consistent with those reported for wild populations of A. carmichaelii [Citation23].
Table 5. Genetic diversity in 6 A. carmichaeli Debx populations based on AFLP markers.
We also calculated the coefficients of genetic distance (D) and genetic identity (I) for six geographic populations (). The average values of D and I among all investigated populations were 0.9183 and 0.0858, respectively. The P-2 and P-4 populations showed the lowest D (0.08 678) and highest I (0.1418) and the P-4 and P-3 populations showed the highest D (0.9631) and the lowest I (0.0376).
Table 6. Nei's unbiased measures of genetic identity (above diagonal) and genetic distance (below diagonal).
MTA analysis
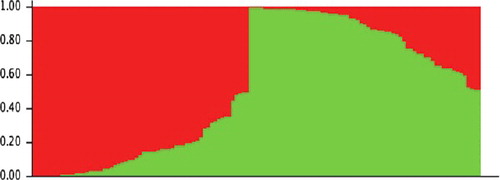
The population structure analysis of all lines conducted using STRUCTURE indicated that the likely number of subgroups was 2 based on the change in k ( and ). All lines from Butuo except H56, four lines from Anxian, 49 lines from Jiangyou and H100 from Hanzhong grouped together in one genetic subpopulation, whereas the remaining 65 lines grouped together in another subpopulation.
Figure 2. k values in 126 lines of Aconitum carmichaelii.
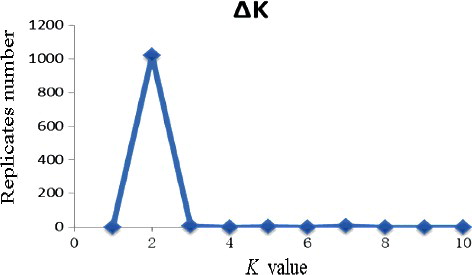
Figure 3. Population structure for 126 lines of Aconitum carmichaelii.
Six models have been used to evaluate the effects of population structure and relative kinship on phenotypic traits in previous MTA studies [Citation19,Citation20,Citation27]. In the present study, we used MLM and GLM models to perform MTA analysis for nine traits to identify QTLs accurately. In the MTA analysis, a total of 192 significant AFLP loci (P < 0.05) were identified under the GLM model for the nine investigated traits, whereas 81 significant AFLP loci were detected under the MLM model (Table S1 in the Online supplemental data). The number of significant loci detected using the models were 42 (GLM) and 13 (Q+K) for plant height; 22 (GLM) and 9 (Q+K) for stem diameter; 30 (GLM) and 10 (Q+K) for dry weight of stem; 23 (GLM) and 9 (Q+K) for fresh weight of stem; 20 (GLM) and 8 (Q+K) for dry weight of leaves; 15 (GLM) and 9 (Q+K) for fresh weight of leaves; 12 (GLM) and 8 (Q+K) for lateral roots number; 12 (GLM) and 8 (Q+K) for dry weight of lateral roots; and 16 (GLM) and 7 (Q+K) for fresh weight of lateral roots. Although the number of associations identified for each trait varied significantly between the two models, a total of 59 associations were identified under both MLM and GLM models. These associated loci might be more significant than other loci in terms of important quality traits. To confirm the accuracy of the MTA results and determine whether these loci are environment-independent, the expression of the identified loci should be verified in more environments and consecutive years.
Pleiotropism of one gene or several genes clustered tightly at a locus has been reported in other species, such as wheat, rice and maize [Citation28–30]. In this study, a total of 38 loci were associated with two to eight traits. For example, P1M1-39 was associated with variations in DWR, DWS, FWS, SD, DWL, FWL, FWR and PH. Similarly, P1M1-14 was associated with variations in DWR, DWS, FWS, DWL, FWL, PH, FWR and LRN. To obtain high-yielding lines of A. carmichaelii, commercial varieties should be further bred by marker-assisted selection. It would be useful to select plants with less growth of above-ground organs and greater growth of below-ground organs. The harvested lateral roots will be processed using traditional methods to prepare Chinese medicine. Such methods reduce the toxicity of secondary plant metabolites and obtain the maximal therapeutic efficacy with minimal adverse effects [Citation31]. Only large lateral roots are suitable for these processing methods and for industrialization of this crop. Breeders of A. carmichaelii should also aim at reducing the number but increasing the size of lateral roots. In this study, we identified loci associated with variations in LRN, FWR and DWR. Therefore, these loci are very important to improve the yield and quality of A. carmichaelii.
Conclusions
The results from this study showed that there is more genetic variability within populations than between populations in cultivated A. carmichaelii. Although the yield and agronomic traits of A. carmichaelii are highly environment-dependent, we still identified 59 loci associated with these traits. A suitable commercial variety of A. carmichaelii will not only have high yield and quality, but will also be easy for cultivation. That is why all significant loci associated with phenotypic variations are very important to A. carmichaelii breeding, especially the loci of P1M1-39 and P1M1-14. Breeders should pay more attention to combinations of the loci associated with less LRN, more FWR and DWR, and weaker growth potential such as less PH, FWS, DWS, FWL and DWL.
Supplementary_Data.pdf
Download PDF (736.5 KB)Disclosure statement
The authors declare that they have no conflict of interest.
Additional information
Funding
Related Research Data
References
- Chan TYK, Tomlinson B, Tse LKK, et al. Aconitine poisoning due to Chinese herbal medicines: a review. Vet Hum Toxicol. 1994;36:452–455.
- Chan TYK. Aconite poisoning. Clin Toxicol. 2009;47:279–285.
- Chen J, Chen T. Chinese medical herbology and pharmacology. City of Industry (CA): Art of Medicine Press; 2004.
- Wang X, Wang H, Zhang A, et al. Metabolomics study on the toxicity of aconite root and its processed products psing ultraperformance liquid-chromatography/electrospray-ionization synapt high-definition mass spectrometry coupled with pattern recognition approach and ingenuity pathways analysis. J Proteome Res. 2012;11(2):1284–1301.
- Yu Ma, Yang YX, Shu XY, et al. Aconitum carmichaelii Debeaux, cultivated as a medicinal plant in western China. Genet Resour Crop. 2016;63:919–924.
- Ersoz E, Yu J, Buckler E. Applications of linkage disequilibrium and association mapping in maize. In: Kriz Al, Larkins BA, editors. Molecular genetic approaches to maize improvement. Vol. 63, Biotechnology in agriculture and forestry. Berlin Heidelberg: Springer; 2009. p. 173–195.
- Sorrells M, Yu J. Linkage disequilibrium and association mapping in the Triticeae. In: Feuillet C, Muehlbauer GJ, editors. Genetics and genomics of the triticeae. Vol. 7, Plant genetics and genomics: crops and models. Berlin Heidelberg: Springer; 2009. p. 655–683.
- Waugh R, Jannink JL, Muehlbauer GJ, et al. The emergence of whole genome association scans in barley. Curr Opin Plant Biol. 2009;12:218–222.
- Brachi B, Faure N, Horton M, et al. Linkage and association mapping of Arabidopsis thaliana flowering time in nature. PLoS Genet. 2010 [cited 2017 Feb 09];6(5):e1000940. DOI:10.1371/journal.pgen.1000940
- Zheng S, Byrne PF, Bai GH, et al. Association analysis reveals effects of wheat glutenin alleles and rye translocations on dough-mixing properties. J Cereal Sci. 2009;50:283–290.
- Yu LX, Lorenz A, Rutkoski J, et al. Association mapping and gene–gene interaction for stem rust resistance in CIMMYT spring wheat germplasm. Theor Appl Genet. 2011;123:1257–1268.
- Adhikari TB, Gurung S, Hansen JM, et al. Association mapping of quantitative trait loci in spring wheat landraces conferring resistance to bacterial leaf streak and spot blotch. Plant Genome-US. 2012;5:1–16.
- Kollers S, Rodemann B, Ling J, et al. Whole genome association mapping of Fusarium head blight resistance in European winter wheat (Triticum aestivum L.). PloS One. 2013 [cited 2017 Feb 09];8:e57500. DOI:10.1371/journal.pone.0057500
- Neumann K, Kobiljski B, Dencic S, et al. Genome-wide association mapping: a case study in bread wheat (Triticum aestivu m l.). Mol Breeding. 2011;27:37–58.
- SAS Institute. SAS/STAT user's guide, version 9.1. Cary (NC): SAS Institute; 2003.
- Yeh FC, Yang RC, Boyle T, et al. POPGENE, the user-friendly shareware for population genetic analysis. Alberta: Molecular Biology and Biotechnology Center, University of Alberta; 1997.
- Excoffier L, Laval G, Schneider S. Arlequin (version 3.0): an integrated software package for population genetics data analysis. Evol Bioinform Online. 2005;1:47–50.
- Pritchard JK, Stephens M, Donnelly P. Inference of population structure using multilocus genotype data. Genetics. 2000;155:945–959.
- Yu JM, Pressoir G, Briggs WH, et al. A unified mixed-model method for association mapping that accounts for multiple levels of relatedness. Nat Genet. 2006;38:203–208.
- Zhang ZW, Buckler ED, Casstevens TM, et al. Software engineering the mixed model for genome-wide association studies on large samples. Brief Bioinform. 2009;10:664–675.
- Dong TT, Cui XM, Song ZH, et al. Chemical assessment of roots of Panax notoginseng in China: regional and seasonal variations in its active constituents. J Agric Food Chem. 2003;51:4617–4623.
- Szakiel A, Paczkowski C, Henry M. Influence of environmental abiotic factors on the content of saponins in plants. Phytochem Rev. 2011;10:471–491.
- Hou DB, Ren ZL, Shu GM. RAPD analysis of genetic diversity in the wild populations of Aconitum carmichaeli Dexb. (Ranunculaceae) in China. Acta Ecol Sin. 2006;26(6):1833–1841.
- Hu P, Xia YL, Yang YX, et al. Genetic Diversity among Aconitum carmichaeli Debx. [Germplasm based on RAMP marker]. Southwest China J Agric Sci . 2014;27(3):984–990.
- Zhao FC, Nie JH, Chen MZ, et al. Assessment of genetic characteristics of Aconitum germplasms in Xinjiang Province (China) by RAPD and ISSR markers. Biotechnol Biotechnol Equip. 2015;29(2):309–314.
- Nybom H.. Comparison of different nuclear DNA markers for estimating intraspecific genetic diversity in plants. Mol Ecol. 2004;13:1143–1155.
- Yang XH, Gao SB, Xu ST, et al. Characterization of a global germplasm collection and its potential utilization for analysis of complex quantitative traits in maize. Mol Breeding. 2011;28(4):511–526.
- Krattinger SG, Lagudah ES, Spielmeyer W, et al. A putative ABC transporter confers durable resistance to multiple fungal pathogens in wheat. Science. 2009;323(5919):1360–1363.
- Chen JY, Guo L, Ma H, et al. Fine mapping of qHd1, a minor heading date QTL with pleiotropism for yield traits in rice (Oryza sativ a L.). Theor Appl Genet. 2014;127(11):2515–2524.
- Zhang N, Gibon Y, Wallace JG, et al. Genome-wide association of carbon and nitrogen metabolism in the maize nested association mapping population. Plant Physiol. 2015;168(2):575–583.
- Cao G, Cai H, Zhang Y, et al. Identification of metabolites of crude and processed Fructus Corni in rats by microdialysis sampling coupled with electrospray ionization linear quadrupole ion trap mass spectrometry. J Pharmaceut Biomed. 2011;56:118–125.