
 ?Mathematical formulae have been encoded as MathML and are displayed in this HTML version using MathJax in order to improve their display. Uncheck the box to turn MathJax off. This feature requires Javascript. Click on a formula to zoom.
ABSTRACT
The present study was conducted to present the comparative modelling, predictive and generalization abilities of response surface methodology (RSM) and artificial neural network (ANN) for optimization of fermenting medium. Cell dry mass and inhibition zone of strain B67 against Botrytis cinerea were used as response variables. The response variables were optimized and modelled as a function of five independent variables (pH, gelatine percentage, incubation period, agitation speed, and temperature) using response surface methodology and artificial neural network. The results of both approaches were compared for their modelling abilities in terms of root-mean-squared error (RMSE), mean absolute error (MAD), chi-square, and correlation coefficient, computed from experimental and predicted data. ANN models were proved to be superior to RSM with lower RMSE, MAD, and chi-square and higher values for correlation coefficient, coefficient of determination, and predictive coefficient of determination. The optimum fermenting conditions predicted were pH 6.65, gelatine 3.30%, incubation period 35 h, agitation speed 163 rpm, and incubation temperature 33.64 °C, with 15.00 g/L and 31.64 mm cell dry mass and inhibition zone, respectively. The predictive models were validated experimentally and were found in agreement with experimentally obtained values.
Introduction
The excessive use of synthetic pesticides for the management of plant pathogens has given rise to problems due to the development of resistance in pathogens against traditional fungicides [Citation1]. Therefore the biological management of pathogens has gained interest as an alternative approach that is sustainable and safe both economically and environmentally [Citation2]. Biological control agents have an important position in the integrated management of plant diseases and especially the bacteria from Bacillus genus have potential to serve as biological control agents [Citation3–6].
Although a large number of biological control agents have been discovered, the number of commercially available ones is very small [Citation7]. The contribution of biological control agents is less than 5% of the total use of pesticides in agriculture [Citation3], which might be due to complications in the formulation and fermentation processes of these biological control agents [Citation7]. Low yield and high production cost are major limiting factors for the development, commercialization, and implementation of biological control agents [Citation8]. Thus, the optimization of fermenting medium is crucial to overcoming the above limitations [Citation7]. Efficient fermentation is an important step for industrial use of bacteria as biological control agents for enhancing their cell density and yield of products of interest.
Single-factor optimization is time consuming and laborious. Furthermore, it hardly ever promises the determination of optimal conditions for effective and efficient production of the target product [Citation9]. These limitations of the one-factor-at-a-time approach can be overcome by using alternative approaches like response surface methodology (RSM) and artificial neural network (ANN). RSM has been largely used in optimization of fermentation medium [Citation10–15]. RSM encompasses a group of statistics-based approaches for building models, designing experiments, assessing effects of factors and searching for optimal conditions [Citation16]. It is a designed experimental procedure which allows the simultaneous optimization of several factors [Citation10]. The experimental responses in RSM are fitted to a quadratic function and the successful application of RSM in a number of studies suggested to be the best choice for many of the fermentation systems [Citation17].
In recent years, ANN has arisen as an efficient and attractive approach for nonlinear multifactor modelling due to its generic structure and ability to learn from historical data [Citation18,Citation19]. ANN is more efficient than RSM because it does not require a prior description of proper fitting function and it has the ability of universal approximation, i.e. approximation of almost all kinds of nonlinear functions, while RSM is only useful for quadratic approximation [Citation17]. Moreover ANN is structured in nature and useful for getting more insight information, i.e. it has the ability to provide sensitivity analysis and to reveal the interactive effect of two factors on the system [Citation20–23].
The present study had two objectives: (i) to maximize the cell dry mass of Bacillus sp.strain B67 and its antifungal potential against Botrytis cinerea and (ii) to compare the modelling ability of RSM and ANN for optimization of fermenting medium components, namely pH, gelatine percentage, incubation period, rotation speed, and incubation temperature. The optimized conditions predicted by both RSM and ANN were compared and experimentally verified.
Materials and methods
Biocontrol agent and fungal pathogen
The Bacillus sp. strain B67 was obtained from the Department of Pesticides Science, Plant Protection College, Shenyang Agricultural University, Liaoning, China. It was isolated from the rhizosphere of a tomato plant and was maintained in Tryptic Soy Broth (TSB) with 20% glycerol at −80 °C after initial testing of its antifungal activity against B. cinerea [Citation24], it was activated in TSB for 48 h before use [Citation2]. The fungal pathogen (B. cinerea) was also obtained from the Department of Pesticides Science, Plant Protection College, Shenyang Agricultural University, Liaoning, China, where it was isolated from tomato plant leaves. The biological control agent (Bacillus sp. strain B67) and the pathogen (B. cinerea) were deposited in China General Microbial Cultural Collection Centre under accessions numbers CGMCC1.15933 and CGMCC 3.18224, respectively.
Preliminary antifungal activity of biocontrol agent
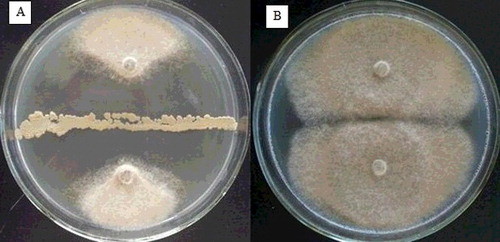
Pure cultures of fungus were initially grown in Petri dishes containing standard potato dextrose agar (PDA)(20% potato extract, 2% dextrose, and 1.5% agar) medium and incubated at 28 °C for 5 days. After this period, 8 mm disks were cut from the edge of actively growing colonies of fungus with the aid of a cork borer. Two plugs were placed at opposite edges of each dish. The strain B67 was streaked on the centre of the PDA plate at the time of fungi transplanting. After incubation for 5 days at room temperature, the radii of the zones of inhibition of the fungus were measured in two perpendicular directions.
Growth medium and culture conditions
The inoculum of strain B67 was prepared by transferring a single colony to a 250 mL conical flask containing 100 mL of basal medium (standard Luria-Bertrani medium) composed of tryptone 10 g/L, yeast extract 5 g/L, and NaCl 10 g/L and grown for 12 h at 28 °C. Then, 10% (v/v) of the inoculum culture was added to 250 mL conical flasks containing 100 mL of the experimental medium consisting of the basal medium adjusted according to experimental design (). The cultures were incubated at different temperatures, using different rotator speeds for the different incubation periods as determined by the experimental design ().
Table 1. Central composite design of experimental variables and their corresponding experimental and RSM and ANN predicted values for cell dry mass and inhibition zone.
Estimation of cell dry mass and antifungal activity
Cells were harvested by centrifugation at 10,000 g for 20 min. The cell pellet was washed with phosphate buffer and recentrifuged. After that, the cell pellet was dried to constant mass in an oven at 80 °C for 24 h.
The cultural supernatants were used to evaluate the antifungal activity. The antifungal activity was determined by the Oxford cup plate assay system. PDA medium (70 mL) was heated until completely melted and then slowly cooled to 50 °C, and rapidly mixed with 8 mL of a spore suspension of B. cinerea (107 spores/mL) before being poured onto the 180 mm plates and allowed to solidify at room temperature. The supernatant (150 µL) was added into each Oxford cup on the plate, incubated at 28 °C for 5 days in the dark. The antifungal activity was determined by measuring the diameter of inhibition zones in two perpendicular directions.
RSM based modelling
In the present study, RSM was employed to determine the optimum medium components for cell dry mass and antifungal activity against B. cinerea. A central composite design (CCD) with five factors and five levels for each was used to design the experiment (). The medium components selected for optimization included pH (X1), gelatine percentage (X2), incubation period (X3), agitation speed (X4) and temperature (X5). Central composite designed (CCD) consisted of 16 cube, 10 axial, and 6 central pints as 32 triplicate experiments were performed in a randomized order. The central values selected for experimental design were: medium pH 6.5, gelatine 3%, incubation period 35 h, rotator speed 150 rpm, and incubation temperature 34 °C. Each variable was coded at 5 levels between −2 and 2 and the coding of the variables was done using Equation (Equation1(1)
(1) ).
(1)
(1) where xi is a dimensionless value of the independent variable, Xi is the real value of the independent variable, Xcp is the real value of the impendent variable at the central point and Δxi is the step change in the real value of variable i corresponding to a variation in a unit for the dimensionless value of variable i.
The process performance was determined by analysing the response (Y) and the relationship between response and input parameters was determined by Equation (Equation2(2)
(2) ).
(2)
(2) where x1, x2…, xk are input factors and e is the error which describes the differentiation.
A second-order polynomial regression equation was used to fit the experimental data and to describe the relevant model terms using MINITAB 17 software. A quadratic model, which also includes the linear model, was described by the Equation (Equation3(3)
(3) ).
(3)
(3) where Y is the predicted response; β0 is the intercept constant; βj, βjj and βijare the interaction coefficients of the linear, quadratic and the second-order terms, respectively; k is the number of factors; xi and xj are variables (i and j range from 1 to k); ei is the error [Citation25–26].
Multiple regression was employed to analyse the experimental data, and the significance of regression coefficients was evaluated by F-test. Modelling was started with a quadratic model including linear, squared, and interaction terms and the model competences were tested in terms R2, adjusted R2, and predicted R2 values. The significant terms in the model were determined by analysis of variance (ANOVA) for each response, and ANOVA tables were constructed. The regression coefficients were used to make statistical calculations to generate Contour plots from the regression models.
ANN based modelling
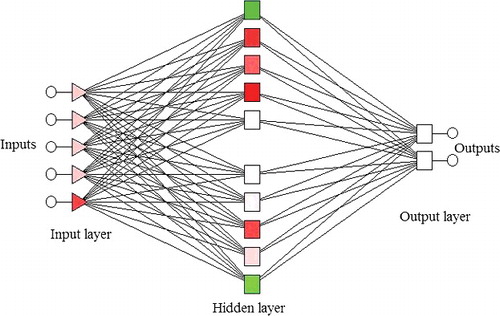
The feed forward architecture of ANN, also known as multilayer perceptron (MLP) was further used to provide nonlinear mapping between the input and the output variables. ANN was employed to construct the predictive model with five input variables (pH, gelatine percentage, incubation period, agitation speed, and temperature) and two output variables (cell dry mass and inhibition zone) for the same set of experimental data used for RSM.
The input layer consisted of five neurons, i.e. pH, gelatine percentage, incubation period, agitation speed, and temperature, while the output layer comprised of two neurons, i.e. cell dry mass and inhibition zone.
The data flow in a forward direction, i.e. from an input layer to an output layer. A real number quantity, known as weights, is linked with the assembly of neurons, which is a variable parameter of the network. The neurons in the input layer just introduce the scaled input data to the hidden layer via weights. The neurons in the hidden layer perform two tasks, i.e. they sum up the weighted inputs to neurons, including bias as shown by Equation (Equation4(4)
(4) ).
(4)
(4) where Wij are the connection weights; Xi is the input variable; θj is bias.
The weighted output is then passed through an activation function f (sum). The activation shifts the space in non-linearity of input data. The sigmoid transfer function was used in this study, as shown in Equation (Equation5(5)
(5) ).
(5)
(5)
The input for the output layer comes from the output produced by the hidden layer. The same function is used by the neuron in the output layer and produces the same output using the same technique as that of the neuron in the hidden layer. ANN training is an iterative process where a pre-specified error function is minimized by adjusting the weights appropriately. An error function (the root-mean-squared error (RMSE) based upon the calculated output and actual experimental output was formulated using Equation (Equation6(6)
(6) ).
(6)
(6) where i is the index of pattern; N is the number of patterns used in data training; M is the number of output nodes;
and
are the target and predicted outputs of the nth node, respectively.
Comparison of RSM and ANN
The goodness of fit and prediction abilities of computed models were evaluated by calculating RMSE [Citation27], mean absolute error (MAE) [Citation28], chi square (x2) [Citation29] and correlation coefficients (R2) [Citation30]. The formulas used for these analyses are given in EquationEquations (6(6)
(6) )–(Equation9
(9)
(9) ), respectively. Furthermore, the values predicted by RSM and ANN were plotted against the corresponding experimental values.
(7)
(7)
(8)
(8)
(9)
(9) where n is the number of experiments; Yi,e is the experimental value for ith experiment; Yi,p is the predicted value for the ith experiment; Ye is the average of the experimental values.
Results and discussion
RSM modelling
During the preliminary confirmation, strain B67 showed strong antifungal activity against B. cinerea (). Then the study was mainly focused to inspect the effect of five independent variables, i.e. pH, gelatine, incubation period, temperature, and agitation speed on cell dry mass and inhibition zone. A central composite design (CCD) of 16 cube, 10 axial, and 6 central points, leading to a total 32 experiments, was performed. Linear interactive and quadratic coefficients for experimental variables were calculated to develop the regression models. Consecutive sum of squares and descriptive statistics were performed to determine the models’ capabilities. For developing predictive models for cell dry mass and inhibition zone, a second-order polynomial regression analysis was performed. Based on CCD, the second-order polynomial equations were derived. The final equations are given below (EquationEquations (10(10)
(10) ) and (Equation11
(11)
(11) )).
(10)
(10)
(11)
(11) where Y1 and Y2 are the predicted values for cell dry mass and inhibition zone respectively while X1, X2, X3, X4 and X5 are medium pH, gelatine percentage, incubation period, agitation speed, and incubation temperature, respectively.
Figure 1. Antifungal activity of strain B67 against Botrytis cinerea. Strain B67 dual cultured with Botrytis cinerea (A) vs. sterile distilled water as control (B).
The fitness and adequacy of the models were analysed by ANOVA. The F values (81.82, 131.08) indicate that both of the models have satisfactory goodness of fit (). The models p values were very low, i.e. 0.000 also confirm the models results (). P values were used to evaluate the significance of different coefficients, which provides the information required to understand the interaction pattern among the experimental variables. Smaller P values refer to larger significance of the respective coefficient. The coefficients estimates and their respective P values showed that, among all tested variables, X1 (pH), X2 (gelatine), X3 (agitation speed), X4 (incubation period), and X5 (temperature) had a significant effect in both models, i.e. on cell dry mass and inhibition zone ().
Table 2. ANOVA for the cell dry mass and inhibition zone based on central composite design.
Table 3. Regression analysis of central composite design showing models coefficients and their significance for cell dry mass and inhibition zone.
The models’ fitness was expressed by the coefficient of determination (R2) and adjusted coefficient of determination R2. The values for R2 were 0.9834 and 0.9881 for cell dry mass and inhibition zone, respectively, which showed that both of the models were >98% accurate to express the variability of the data (). The adjusted coefficient of determination corrects the R2 value for sample size and number of terms in the model, and its values (0.9713 for cell dry mass and 0.9796 for inhibition zone) were also high enough to express the high significance of models ().
The effects of the independent variables and the interactive effects of each independent variable on the response variables were illustrated by contour plots. The oval shape of the contour plots indicates a significant interaction between the independent variables. The smallest ellipses in the contour plots represent the maximum predicted values. The cell dry mass and inhibition zone for each pair of independent variables are presented in (A–J) and 3(A–J). It is apparent that the cell dry mass and inhibition zone increase with the increase in pH from 5.5 to 6.65 but a further increase in pH caused a reduction in both cell dry mass and inhibition zone. A similar relation was observed for gelatine, incubation period, agitation speed, and incubation temperature. An initial increase in these variables resulted in an increase in the cell dry mass and inhibition zone but, after a certain level, further increase resulted in reduced cell dry mass and inhibition zone ( and 3). Therefore, the maximum cell dry mass and inhibition zone were predicted at pH 6.5, gelatine concentration of 3.30%, incubation period of 35 h, agitation speed of 163 rpm and incubation temperature of 33.63 °C ( and ). The cell dry mass (14.80 g/L) and antifungal activity (32.25 mm inhibition zone) obtained in the present work were much higher than the values reported previously [Citation2,Citation31,Citation32].
Figure 2. Contour plots showing the effect of different experimental variables on cell dry mass of strain B67: effect of pH and gelatine (A); effect of gelatine and temperature (B); effect of pH and incubation period (C); effect of gelatine and agitation speed (D); effect of gelatine and incubation period (E); effect of pH and temperature (F); effect of agitation speed and temperature (G); effect of pH and gelatine (H), effect of incubation period and temperature (I) and effect of incubation period and agitation speed (J).
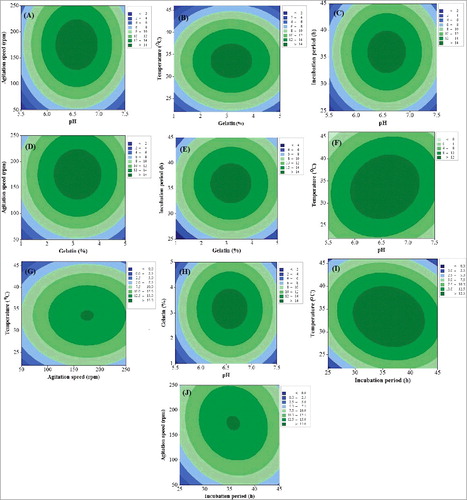
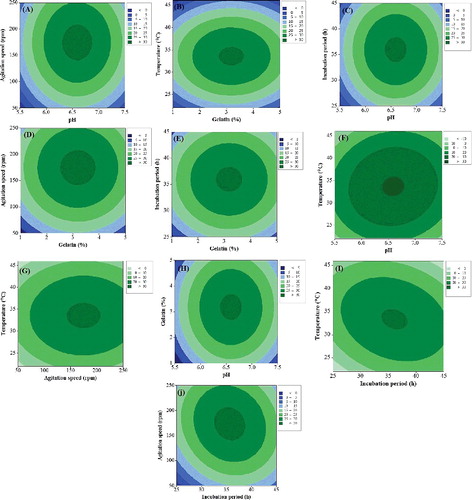
Figure 3. Contour plots showing effect of experimental variables on antifungal activity (inhibition zone) of strain B67 against Botrytis cinerea: effect of pH and agitation speed (A); effect of gelatine and temperature (B); effect of pH and incubation period (C); effect of gelatine and agitation speed (D); effect of gelatine and incubation period (E); effect of pH and temperature (F); effect of agitation speed and temperature (G); effect of pH and gelatine (H); effect of incubation period and temperature (I) and effect of agitation speed and incubation period (J).
The growth of Bacillus species is generally considered be an aerobic process, so the amount of dissolved oxygen is an important parameter in the fermentation process [Citation33]. The oxygen supply is directly related to the agitation speed, and therefore, the agitation speed was found to be an important factor affecting the cell dry mass and antifungal activity. Lower or higher pH of the fermenting medium affects the behaviour of the secondary metabolites production [Citation34,Citation35]. Similarly, lower or higher temperatures affect the enzymatic activity of organisms [Citation36]. The present findings are in agreement with these observations, as both of the factors, i.e. pH and temperature, were found to significantly affect the cell dry mass and the inhibition zone. The results revealed that lower or higher levels of pH, gelatine, incubation period, agitation speed, and incubation temperature were not favourable for cell dry mass and antifungal activity [Citation37].
ANN modelling
Multilayer perceptron (MLP) with logistic sigmoid function was used to develop ANN-based process models. An MLP with feed-forward architecture comprised of five input nodes (pH, gelatine, incubation period, agitation speed, and temperature) and two output nodes (cell dry mass and inhibition zone) was used (). First, the ANN model was optimized to obtain minimum dimension and error during the training and testing of the data. The design of the experiment and the respective experimental yield was used for training the network. The data were divided into training, validation and test sets to avoid over-training and over-parameterization. Data training was performed by changing the number of neurons in the hidden layer and for different combinations of ANN-specific parameters, i.e. initialization and learning rate. The generalization capacity of the model was confirmed by selecting the weights of parameter resulting in the least test set of RMSE. The MLP with 10 nodes in the hidden layer resulted in the least value for the test set RMSE (). The correlation values between the predicted and the experimental sets were 0.999 for cell dry mass and 0.997 for inhibition zone ().
Figure 4. A general graphical representation of a feed forward multilayer perceptron (MLP) neural network consisting of 5 input nodes in the input layer, 10 nodes in the hidden layer and 2 nodes in the output layer.
Validation of model predictions
The predictive models were validated by conducting experiments in triplicate, using the optimized conditions. The maximum predicted values for cell dry mass and inhibition zone were 15.00 g/L and 31.12 mm, respectively. The optimized predicted conditions were pH 6.65, gelatine 3.30%, incubation period of 35.0 h, agitation speed of 163.13 rpm, and incubation temperature of 33.64 °C, with the desirability of 99% and 96% for cell dry mass and inhibition zone, respectively. The average values obtained in the experiments were 4.80 g/L and 32.25 mm for cell dry mass and inhibition zone, respectively. This was in close agreement with the values predicted by the models. The good correlation between the predicted and the experimental values was observed after optimization which further justified the validity of models.
Comparison of RSM and ANN models
Nutritional constituents and culture conditions play a crucial role in the development of an effective fermentation process [Citation38–40]. The statistical techniques allowed determination of the best fermentation conditions that give the maximum cell dry mass and antifungal activity for Bacillus sp. strain B67. The RSM and ANN models were compared for their predictive capabilities. The values predicted by RSM and ANN are presented in . Descriptive statics in terms of RME, MAE, chi-square (χ2) and correlation coefficient (R2) between experimental and predicted values were calculated to compare the results (). These results showed that the ANN models have higher modelling capability compared to the RSM models for both cell dry mass and inhibition zone. The linear regression analysis between the values predicted by RSM and ANN showed that the values predicted by ANN are much closer to the line of perfect prediction than those predicted by RSM (). The better modelling ability of ANN can be attributed to its universal approximation ability for nonlinearity, whereas RSM is only limited to a second-order polynomial regression [Citation26,Citation41]. Modelling using RSM is easier compared to ANN, as ANN needs a higher number of inputs than RSM for better predictions. ANN has excellent prediction and optimization abilities, while sensitivity analysis is more precise in RSM. RSM is recommended for modelling of a new process, while ANN is best suited for nonlinear systems that include interactions higher than quadratic. Moreover ANN does not require any prior specification for suitable fitting function [Citation42].
Table 4. Error based comparison of RSM and ANN models.
Figure 5. Comparison of experimentally obtained values with the values predicted by RSM and ANN for cell dry mass (A) and inhibition zone (B).
Conclusions
In this work, fermentation conditions for strain B67 were optimized for maximizing the cell dry mass and antifungal activity by using RSM and ANN approaches. Furthermore, the predictive and generalization abilities of both techniques were compared. ANN showed more precise optimum conditions for maximizing the cell dry mass and inhibition zone than RSM. The ANN predictive ability was proved to be better than that of RSM and it can be concluded that ANN gives a more accurate replacement of RSM.
Disclosure statement
No potential conflict of interest was reported by the authors.
Additional information
Funding
References
- Marin DH, Romero RA, Guzman M, et al. Black Sigatoka: an increasing threat to banana cultivation. Plant Dis. 2003;87:208–222.
- Mosquera S, González-Jaramillo LM, Orduz S, et al. Multiple response optimization of Bacillus subtilis EA-CB0015 culture and identification of antifungal metabolites. Biocatal Agric Biotechnol. 2014;3:378–385.
- Bailey K, Boyetchko S, Längle T. Social and economic drivers shaping the future of biological control: a Canadian perspective on the factors affecting the development and use of microbial biopesticides. Biol Control. 2010;52:221–229.
- Raaijmakers JM, De Bruijn I, Nybroe O, et al. Natural functions of lipopeptides from Bacillus and Pseudomonas: more than surfactants and antibiotics. FEMS Microbiol Rev. 2010;34:1037–1062.
- Heins SD, Manker DC, Jimenez DR, et al., inventors; AgraQuest, Inc., assignee. Compositions and methods for controlling plant pests. United States patent US 6,103,228. 2000 Aug 15.
- Shafi J, Tian H, Ji M. Bacillus species as versatile weapons for plant pathogens: a review. Biotechnol Biotechnol Equip. 2017;31:446–459.
- Hynes RK, Boyetchko SM. Research initiatives in the art and science of biopesticide formulations. Soil Biol Biochem. 2006;38:845–849.
- Schisler D, Slininger P, Behle R, et al. Formulation of Bacillus spp. for biological control of plant diseases. Phytopathology. 2004;94:1267–1271.
- Niemann H, Rath D, Wrenzycki C. Advances in biotechnology: new tools in future pig production for agriculture and biomedicine. Reprod Domest Anim. 2003;38:82–89.
- Rao KJ, Kim C-H, Rhee S-K. Statistical optimization of medium for the production of recombinant hirudin from Saccharomyces cerevisiae using response surface methodology. Process Biochem. 2000;35:639–647.
- Reddy PRM, Ramesh B, Mrudula S, et al. Production of thermostable β-amylase by Clostridium thermosulfurogenes SV2 in solid-state fermentation: optimization of nutrient levels using response surface methodology. Process Biochem. 2003;39:267–277.
- Wei W, Zheng Z, Liu Y, et al. Optimizing the culture conditions for higher inulinase production by Kluyveromyces sp. Y-85 and scaling-up fermentation. J Ferment Bioeng. 1998;86:395–399.
- Dutta JR, Dutta PK, Banerjee R. Optimization of culture parameters for extracellular protease production from a newly isolated Pseudomonas sp. using response surface and artificial neural network models. Process Biochem. 2004;39:2193–2198.
- Xiong Y-H, Liu J-Z, Song H-Y, et al. Enhanced production of extracellular ribonuclease from Aspergillus niger by optimization of culture conditions using response surface methodology. Biochem Eng J. 2004;21:27–32.
- Shafi J, Mingshan J, Zhiqiu Q, et al. Optimization of Bacillusaerius strain JS-786 cell dry mass and its antifungal activity against Botrytis cinerea using response surface methodology. Arch Biol Sci. 2017;69:469–480.
- Kalil S, Maugeri F, Rodrigues M. Response surface analysis and simulation as a tool for bioprocess design and optimization. Process Biochem. 2000;35:539–550.
- Desai KM, Survase SA, Saudagar PS, et al. Comparison of artificial neural network (ANN) and response surface methodology (RSM) in fermentation media optimization: case study of fermentative production of scleroglucan. Biochem Eng J. 2008;41:266–273.
- Desai KM, Vaidya BK, Singhal RS, et al. Use of an artificial neural network in modeling yeast biomass and yield of β-glucan. Process Biochem. 2005;40:1617–1626.
- Yang Y, Gao M, Yu X, et al. Optimization of medium composition for two-step fermentation of vitamin C based on artificial neural network–genetic algorithm techniques. Biotechnol Biotechnol Equip. 2015;29:1128–1134.
- Gevrey M, Dimopoulos I, Lek S. Review and comparison of methods to study the contribution of variables in artificial neural network models. Ecol Model. 2003;160:249–264.
- Jaiswal S, Benson E, Bernard J, et al. Neural network modelling and sensitivity analysis of a mechanical poultry catching system. Biosys Eng. 2005;92:59–68.
- Gevrey M, Dimopoulos I, Lek S. Two-way interaction of input variables in the sensitivity analysis of neural network models. Ecol Model. 2006;195:43–50.
- Sewsynker Y, Kana EBG, Lateef A. Modelling of biohydrogen generation in microbial electrolysis cells (MECs) using a committee of artificial neural networks (ANNs). Biotechnol Biotechnol Equip. 2015;29:1208–1215.
- Ji M, Wang Y, Cheng G, et al. Selection of antagonistic strains against watermelon wilt and their biocontrol efficiency. Chin J Biol Control. 2002;18:71–74.
- Montgomery DC. Design and analysis of experiments. New York (NY): Wiley; 2017.
- Maran JP, Mekala V, Manikandan S. Modeling and optimization of ultrasound-assisted extraction of polysaccharide from Cucurbita moschata. Carbohydr Polym. 2013;92:2018–2026.
- García-Gimeno R, Hervas-Martinez C, Rodriguez-Perez R, et al. Modelling the growth of Leuconostocmesenteroides by artificial neural networks. Int J Food Microbiol. 2005;105:317–332.
- Youssefi S, Emam-Djomeh Z, Mousavi S. Comparison of artificial neural network (ANN) and response surface methodology (RSM) in the prediction of quality parameters of spray-dried pomegranate juice. Dry Technol. 2009;27:910–917.
- Çelekli A, Geyik F. Artificial neural networks (ANN) approach for modeling of removal of Lanaset Red G on Chara contraria. Bioresour Technol. 2011;102:5634–5638.
- Rajendra M, Jena PC, Raheman H. Prediction of optimized pretreatment process parameters for biodiesel production using ANN and GA. Fuel. 2009;88:868–875.
- Huang C-J, Wang T-K, Chung S-C, et al. Identification of an antifungal chitinase from a potential biocontrol agent, Bacilluscereus 28-9. BMB Reports. 2005;38:82–88.
- Wei X, Yan P-s, Wu H-q, et al. Antagonizing Aspergillus parasiticus and promoting peanut growth of Bacillus isolated from peanut geocarposphere soil. J Integr Agric. 2014;13:2445–2451.
- Gao X, He Q, Jiang Y, et al. Optimization of nutrient and fermentation parameters for antifungal activity by Streptomyces lavendulae Xjy and its biocontrol efficacies against Fulvia fulva and Botryosphaeria dothidea. J Phytopathol. 2016;164:155–165.
- Yang X, Yang H, Jian H, et al. Effect of fermentation conditions on antibiotic production of Xenorhabdus nematophilus. Wei sheng wu xue tong bao. 2000;28:12–16.
- Yang X, Qiu D, Jiao N,et al. Cultural medium and fermentation conditions of {\ sl Xenorhabdus} sp. strain D43. Chin J Biol Control. 2005;22:58–62.
- Lai L-ST, Tsai T-H, Cheng T-Y. The influence of culturing environments on lovastatin production by Aspergillus terreus in submerged cultures. Enzyme Microb Technol. 2005;36:737–748.
- Wang Y-H, Zhang X. Influence of agitation and aeration on growth and antibiotic production by Xenorhabdus nematophila. World J Microbiol Biotechnol. 2007;23:221–227.
- Ripa F, Nikkon F, Zaman S, et al. Optimal conditions for antimicrobial metabolites production from a new Streptomyces sp. RUPA-08PR isolated from Bangladeshi soil. Mycobiology. 2009;37:211–214.
- Usha Kiranmayi M, Sudhakar P, Sreenivasulu K, et al. Optimization of culturing conditions for improved production of bioactive metabolites by Pseudonocardia sp. VUK-10. Mycobiology. 2011;39:174–1781.
- Song Q, Huang Y, Yang H. Optimization of fermentation conditions for antibiotic production by actinomycetes YJ1 strain against Sclerotiniasclerotiorum. J Agric Sci. 2012;4:95–102.
- Maran JP, Sivakumar V, Thirugnanasambandham K, et al. Artificial neural network and response surface methodology modeling in mass transfer parameters predictions during osmotic dehydration of Caricapapaya L. Alexandria Eng J. 2013;52:507–516.
- Mansour Ghaffari M, Mostafa K. Comparison of response surface methodology and artificial neural network in predicting the microwave-assisted extraction procedure to determine zinc in fish muscles. Food Nutr Sci. 2011;2:803–808.