
ABSTRACT
The aim of this study was to investigate the effect of hyperoxia, calcium ions and pH value on the composition of major phospholipids in human erythrocyte membranes and erythrocytes’ oxygen-transport function. To create a model of hyperoxia, we saturated the incubated mixture with oxygen by constant passing of oxygen–air mixture through the incubation medium. To assess the effect of elevated calcium ion concentrations, CaCl2 was added to the incubation medium. An incubation medium with different pH was used to study the effect of various pH values. Lipids were extracted from erythrocytes and chromatographic separation was carried out in a thin layer of silica gel deposited on a glass plate. The thiobarbituric acid (TBA)-active products and the content of diene conjugates (DC) in erythrocytes were determined. The oxygen-binding capacity of haemoglobin was evaluated using Raman spectroscopy. The obtained results indicated that hyperoxia causes deep changes both in the composition and character of bilayer lipids of erythrocyte membranes, which affects the functional characteristics of erythrocytes, primarily the oxygen-transport properties of erythrocyte haemoglobin. It should be noted that a combination of Ca2+ ions and change in the pH value intensify the processes associated with disruption of phospholipids’ composition. The findings indicate that the lipid phase is one of the key elements in the functioning of erythrocytes in norm as well as during development of various pathological processes.
Introduction
Many studies [Citation1–3], including ours [Citation4–6], have provided evidence that the lipid phase plays an active role in the regulation of the oxygen-transport function of haemoglobin during hypoxia, which is the cause and consequence of many cardiovascular diseases [Citation7]. However, the human body often faces a situation when in some tissues and, in particular, in the blood, there may be an excessive amount of oxygen. Understanding the processes that occur during elevated concentrations of oxygen is essential, in particular, for patients in need of additional oxygenation [Citation8–18].
Uncontrolled increase of oxygen concentration leads to the so-called ‘oxidative stress’, resulting in the activation of many oxidative processes, including processes of lipid peroxidation (LPO) [Citation1,Citation8,Citation19–21]. Currently there is abundant evidence pointing to the influence of products of LPO on the structure and functional properties of the cell as well as on separate enzyme systems and functional elements, localized in the membrane [Citation22]. A particularly important link in the chain of these events is the processes associated with the change in the concentration of Ca2+ and pH [Citation23]. It is known that during peroxidation, calcium ions can enter into the cells and leave their intracellular depot though non-specific ion channels, formed by peroxide groups [Citation23]. The change in the concentration of calcium in these or other areas can trigger the lipolytic Ca-dependent phospholipase [Citation24]. In addition, the interaction of calcium with charged peroxide groups can affect the physico-chemical (phase) properties of the lipid bilayer. The enzyme activity itself depends on the pH value [Citation25]. In addition, pH can also quite efficiently affect those phospholipids, which have charged groups, such as phosphatidylserine, phosphatidylinositol, phosphatidylcholine, etc. This array of changes is a powerful factor that can profoundly alter the properties of the membrane and the functional characteristics of a cell and the structures making up its composition.
Taking into account the above considerations, we investigated whether hyperoxia causes changes in the composition of major phospholipids that erythrocyte membranes are composed of. In addition, we explored the role of calcium ions and pH value on the nature of these disorders and how the processes may affect the haemoglobin oxygen-binding ability and oxygen-transport of red blood cells (RBCs).
Subjects and methods
Blood samples
The study was conducted with the approval of the Local Ethics Committee of Mordovia State University in accordance with the principles of Good Clinical Practice (Minutes no. 12 of 17 September 2014).
Blood was obtained from healthy donors at the Mordovian Republican Station of Blood Transfusion in Saransk city. Donors were 37 healthy men aged 27–37 years who, at the time of examination, had no history of cardiovascular disease (average haematological parameters: RBC (1012 /L) 4.86 ± 0.08; Hb – 149.2 ± 5.69 g/L). Informed consent for participation in the study was obtained from all blood donors.
Blood sampling procedure
Fasting blood was taken aseptically from the cubital vein, and then centrifuged for 15 min at 1500g. The supernatant was taken away and discharged. Erythrocyte suspension was prepared from the sediment by adding normal saline solution (NSS) in a 3:1 ratio. After adding NSS, the samples were centrifuged for 5 min at 1500g. The obtained suspension of erythrocytes was used for further work.
Hyperoxia model
To create a model of hyperoxia, we saturated the incubated mixture with oxygen by constant passing of oxygen–air mixture through the incubation medium. The erythrocyte mass was well stirred and 22 mL samples were incubated for 30 min at 37 °C.
To assess the impact of elevated concentrations of calcium ions, we added CaCl2 in the incubation medium to a final concentration of 3.5 mmol/L. To study the effect of different values of pH, the incubation medium with pH 6.8 and 7.8 was used.
After incubation, RBCs were deposited by centrifugation at 1500g for 10 min, after which a small portion of sediment was re-suspended in the washing medium, of which samples for microscopy were prepared; the other part was used to obtain membranes.
Isolation of membranes from human erythrocytes
The sediment of erythrocytes was lysed in a chilled to 0 °C solution of 5 mmol/L NaH2PO4; 0.5 mmol/L phenylmethylsulphonyl fluoride pH of 8.0. The ratio of the sediment of RBCs to lysis solution was 1:20 (v:v). The mixture was left for 10 min at 4 °C, then centrifuged at 20,000g for 40 min (temperature 0 °C). The supernatant was discharged and the sediment was re-suspended in lysis solution and centrifuged at 20,000g for 40 min (at 0 °C). The procedure was repeated three times.
Extraction of lipids
Extraction of lipids from erythrocytes was performed by the Bligh–Dyer method [Citation26]. Briefly, 1 mL of the erythrocyte mass was homogenized in 3 mL of chloroform/methanol/water mixture (1:2:0.8 by volume). The volume of the resulting homogenate was topped up to 10 mL and left for 1 h in the flask with a friction-fitted lid. Then, the content of the flask was filtered through a folded filter. To separate non-lipid water-soluble impurities, 4 mL of chloroform and 4 mL of water were added in the resulting mixture, shaken and centrifuged for 15 min at 1000g.
Under the above conditions, the solution was divided into two phases: the upper one – aqueous-methanol, containing water-soluble components; at the border of phases – white film of proteolipids; and the lower phase – chloroform containing the lipids. The lower fraction was carefully separated and drained into a pre-weighed evaporating flask.
The extraction of lipids was carried out at low temperature (4 °C). The final extract in the evaporating flask was evaporated on a rotary evaporator to constant weight in a flow of nitrogen. The resulting lipids were dissolved in a mixture of chloroform/methanol (2:1 by volume) to a concentration of 20 mg/mL. The lipid samples were stored at low temperature (−20 °C) in nitrogen atmosphere.
High-performance thin-layer chromatography
Chromatographic separation was carried out in a thin layer of silica gel deposited on a glass plate [Citation27,Citation28]. We used standard high-performance thin-layer chromatography Silicagel plates 60 F254 (Merck, Darmstadt, Germany) as well as plates prepared at the laboratory. To separate the lipids, chromatographic chambers were used. The walls inside were lined with filter paper to accelerate the saturation by solvents vapours. Solvents in the chambers were prepared 1–1.5 h before analysis. Then, 20 µL of samples for analysis were deposited by an automatic applicator (Automatic TCL-Sanipler 4, Gamag, Muttenz, Switzerland) at a distance of 0.7–1 cm from the edges of the plate in the form of a strip (one-dimensional separation).
To separate phospholipids by one-dimensional chromatography, the following solvent system used: chloroform/methanol/glacial acetic acid/water (50:25:8:4, v/v). Only two plates were put into the chamber at a time, so that the substrate surface was facing the chamber's lining paper, and the layers of adsorbent were at maximum distance from each other. Plates were warmed up for 30 min at a temperature of 110–120 °C before depositing.
After depositing samples, the plate was put into a chromatography chamber. The separation/division was terminated when the solvents front reached 0.5–1 cm from the upper edge of the plate. The plate was removed from the chamber and dried until the odour of solvents disappeared.
Detection of lipids
To detect lipids, we used the method based on iodine vapour staining, convenient due to its universality and absence of destructive effect on lipids [Citation29]. Detection of phospholipids was carried out by the method of Vaskovsky et al. [Citation30]. Originally, we prepared source reagent A by mixing 10 g sodium molybdate, 60 mL 4n HCl, 0.4 g hydrochloric acid hydrazine and 14 mL of 4n НCl. The mixture was heated on a water bath for 20 min, cooled and then 14 mL of concentrated sulphuric acid was added, bringing the volume up to 100 mL with distilled water. To spray plates, reagent C was prepared: to the initial volume of reagent A, three volumes of distilled water or seven volumes of 7n sulphuric acid were added. The spots of phospholipids in the latter case were tinted blue.
Separate fractions of phospholipids were identified using the Rf values of specific colouring agents and witnesses. Choline-containing phospholipids were detected using Dragendorff's reagent [Citation29]. To detect amine-containing phospholipids (PEA, PS) ninhydrine reagent was used [Citation31]. Detection of free fatty acids (FFAs) was carried out by using bromcresol green [Citation29].
Quantitative analysis of lipids
Quantitation of phospholipids was carried out with the aid of a densitometric automated device CAMAG TLC Scanner 4 (Switzerland) [Citation27,Citation28]. Methyl esters of fatty acids (FA) of individual lipids and FFAs were analysed by gas chromatography (GC). Methylation of FAs was determined by Morrison and Smith's method [Citation32]. Separation of methyl esters of FAs was performed by gas chromatograph SHIMADZU GC-2010Plus AF (Kyoto, Japan) [Citation32].
Analysis and processing of chromatography were conducted by the internal standard method. This method is based on adding a known amount of a certain substance called the ‘internal standard’, to the analysed compounds. To do this, we calibrated the device using a mixture with a known content of analysed substances and internal standard. As an internal standard we used margarine acid.
Study of lipid peroxidation products
The intensity of LPO was determined by the accumulation of products of peroxidation of polyunsaturated fatty acids (PUFAs) – DC and malondialdehyde (MDA) in erythrocytes. The estimation of TBA-active products was carried by the method described by Ohkawa et al. [Citation33]. The method is based on the fact that, at high temperature in an acidic medium, MDA reacts with TBA, forming a coloured trimethine complex with an absorption maximum at 535 nm [Citation33].
The content of DC in erythrocytes was determined on the basis of the classical method by Placer Z. (1968) in the modification of Gavrilov et al. [Citation34–36]. Briefly, 0.5 mL of erythrocyte haemolysate (1:1) was mixed in test tubes with a glass lid with 4 mL of a pure distilled mixture of isopropanol: heptane (1:1, v/v). The mixture was shaken for 1 h; after that we added 1 mL of 0.01 N HCl (pH = 2) and the mixture was again shaken for 2 min. Then, 2 mL of pure distilled heptane were added and the mixture was again periodically shaken for 10–15 min. After about 1–2 h, the upper phase was taken and scanned photometrically at 232 nm against a control sample where instead of the haemolysate, 0.5 mL of H2O was used. Calculations were done using the following equation: C (nmol/mL er) = (AOP Afon) × 36.4, where AOP is the optical density of the experimental samples; Afon is the optical density of the control sample; 36.4 is the conversion rate in nm (nmol).
Conformation and properties of haemoglobin
The oxygen-binding capacity of haemoglobin was determined using Raman spectroscopy (RS) on the device In Via Renishaw (UK) [Citation37–39] with short-focus high luminosity monochromator (focal length not more than 250 mm) and CCD detector for recording data (1024 × 256 pixels with Peltier cooling to −70 °С), 1800 lines/mm. The digitized spectra were processed with the program WIRE 3.3. Reference line correction and smoothing of the spectra were carried out.
To excite Raman spectra, a laser was used (wavelength of 532 nm, maximum emission power of 100 mW, 100 × objective). The data recorder, CCD detector (1024 × 256 pixels with Peltier cooling up to −70 °C), was with grating of 1800 lines/mm. The digitized spectra were processed in WIRE 3.3. Baseline correction and smoothing of the spectra were made.
The swab of the erythrocytes suspension was studied on the specimen slide. We had bands of the haemoglobin spectrum at laser excitation of 532 nm and correlation of bands with fluctuations of the porphyrin relations. For each sample, the measurements were performed three times and the resulting values were averaged. The position and intensity of Raman spectrum bands of haemoglobin depends on the nature of the fluctuations of the porphyrin ring relations that allows evaluating the conformation of haematoporphyrin, which is directly related to the oxygen-binding properties of haemoglobin [Citation38,Citation39].
To analyse the conformation of haemoglobin HP, we used certain characteristic bands of the Raman spectrum, which allows to examine the HP conformation in deoxyhaemoglobin (d-Hb) and the ability of d-Hb to bind the ligands as well as HP conformation in oxyhaemoglobin (o-Hb) and the ability of o-Hb to reduce oxygen. To analyse the conformation and O2-binding properties of Hb, the following bands of the Raman spectra of the blood (positions of the maxima) were used: 1172, 1355, 1375, 1548, 1550, 1580 cm−1.
The use of Raman peaks relations and not their absolute values is explained by the fact that the absolute value of spectrum intensity depends on the amount of haemoglobin and therefore of RBCs in the sample as well as of the laser focus area. Internal normalization of peaks (on the intensity of other bands) ensures that the analysed parameters in different samples do not depend on the amount of haemoglobin, and are determined only by the conformation of haemoglobin and the relative content of its various forms.
The correlation of the spectra intensities I1375/(I1355 + I1375) characterizes the relative amount of oxyhaemoglobin in the blood, I1355/I1550 – the relative ability of the total haemoglobin in the sample to bind ligands (including oxygen), and the correlation I1375/I1580 – the ability of o-Hb to reduce oxygen. The correlation I1580/I1548 reflects the affinity of haemoglobin to ligands, primarily to oxygen. The correlation I1375/I1172 shows the intensity of the symmetric and asymmetric vibrations of pyrrole rings, a change of which may be attributed to conformational changes of pyrroles [Citation37–41].
Data analysis
Statistical processing of results was performed using Statistics 6.0 software. For statistical analysis of the experiment results, we drew upon Geary's criterion, by which we estimated the normal value distribution for each of the samples [Citation42]. After that, the homogeneity of dispersion was evaluated; then, we conducted analysis of variance (ANOVA) and ANOVA for repeated measurements. In case of statistically significant differences between the average values, we used Tukey analysis of contrast of means post-factum [Citation43]. The results are presented as arithmetic means and standard deviation (mean ± SD).
Results and discussion
Changes in the composition of phospholipids of RBCs during hyperoxia
The erythrocyte membrane plays a key role in determining the homeostasis and functional capacity of the cell. The physico-chemical state of the membrane influences the active ion transport, the oxygen-binding and oxygen-transport capacity, the specifics of functioning of the membrane-associated enzymes and the character of the cell/environment interaction, whereas the organization of erythrocyte membranes directly depends on their protein and lipids composition [Citation44]. The main structural and functional component of erythrocyte membranes are phospholipids. It is they that determine the mobility of proteins and are responsible for the plasticity and deformability of erythrocyte membranes.
A characteristic feature of biological membranes is a different lipid composition on both sides of the lipid bilayer. This is attributed, first, to the thermodynamic probability of lipids distribution against stereo configuration of their molecules, and second, to the difference in the medium composition on both sides of the lipid bilayer [Citation7]. For these reasons, the outer monolayer of the lipid membranes of human erythrocytes contains 44% phosphatidylcholine (PC), 44% sphingomyelin (SM) and 12% phosphatidylethanolamine (PEA), while the inner monolayer contains 48% PEA, 28% phosphatidylserine (PS), 10% SM and 14% PC [Citation7,Citation45].
In our work, we examined the phospholipid and FA composition of individual phospholipids as well as the degree of their oxidation in normal conditions and during hyperoxia. Seven fractions of phospholipids were isolated from erythrocyte membranes, namely PC, PS, SM, phosphatidylinositol (PI), PEA, lysophosphatidylcholine (LPC) and lysophosphatidylethanolamine (LPEA).
It was found that in human erythrocytes under conditions of normal oxygen content, the concentration of PEA was 190.3 ± 8.1 µg pea/mgtl (total lipids) (). The elevated concentrations of Ca2+, pH 6.8 and 7.8 led to a decrease in the content of FEA in comparison with the control sample. The maximum decrease was observed at pH 7.8 (74.2% FEA). Such a significant change can probably be attributed to the fact that PEA is the most oxidizable fraction of the lipid spectrum, as it includes a large amount of unsaturated FAs.
Table 1. Changes in the lipid composition of erythrocyte membrane caused by Ca and different pH values during normoxia and hyperoxia.
Similar results were obtained for the PC fractions, which together with PEA, make up the bulk of the biomembranes’ phospholipids and PS. The concentration of PC in the control sample was 230.8 ± 9.3 µg/mg of lipids, and its minimum value at pH 7.8 was 52.5%. The concentration of PS in the control sample was 93.3 ± 7.3 µg/mg of lipids and the minimum value observed was at pH 6.8.
Similar quantitative changes occurred with the fraction of minor phospholipids – PI, and with a representative of sphingophospholipids – SM. At the same time, there was a significant increase in the number of lysoforms of phospholipids. The maximum increase in the number LPC and LPEA occurred with incubation of erythrocytes in the medium at pH = 7.8.
It could be speculated that under the action of elevated concentrations of calcium as well as under the action of non-physiological concentrations of protons, phospholipases in RBCs become active, which leads to the formation of isoform PEA, PC and PS lysoforms. Therefore, during incubation in conditions of normal oxygen content, the impact of an additional factor, namely the increased concentration of Ca2+ ions, non-physiological pH values (6.8 and 7.8) appeared as a low content of all fractions of phospholipids (PL), except lysophospholipids, the content of which increased.
Under hyperoxic conditions, the RBCs were losing the content of almost all fractions of phospholipids. The concentration of PL lysoforms, especially LPC, increased and the effect of additional factors led to mixed effects (). The strongest effect on the PL content was produced by the following factors: Ca2+ ions for PEA (3.9-fold and 2.9-fold decrease in comparison with the control samples during hyperoxia and normoxia, respectively) and for LPC (4.2-fold and 6.9-fold increase in comparison with the control sample during hyperoxia and normoxia, respectively).
Non-physiological pH values of the incubation medium of erythrocytes on the background of hyperoxia also caused quantitative changes in isolated fractions of PL. Thus, at pH = 6.8, we observed a further decrease in the amount of SM by 29% (compared with the control sample under hyperoxia), the amount of PC, PEA also remained below the control level (normoxia), but it was by 10% and 22.9% above the control level at hyperoxia, respectively. The number of PL lysoforms also increased, just like in normoxia.
The most pronounced effect on PEA, PS, PI and SM fractions was produced by the change of pH up to 7.8. The content of PEA, PS, PI and SM fractions decreased by 51%, 12.6%, 24.6% and 25.7% in comparison with the control samples during hyperoxia, respectively. Simultaneously, the processes of accumulation of LPC and LPEA fractions developed (their contents increased threefold and twofold, respectively, in comparison with control samples during hyperoxia). The amount of PC exceeded the control level in conditions of hyperoxia; however, it was significantly lower than the control level in normoxia.
These results demonstrated that the decrease of PEA, PC, PI and the increase in the content of lysophospholipids can affect the structural and functional properties of cell membranes [Citation46].
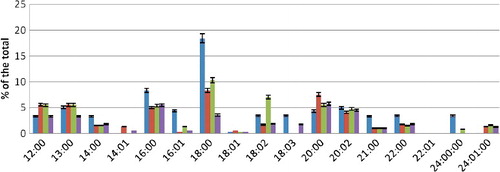
Effect of hyperoxia on the FA composition of erythrocyte phospholipids
The functioning and properties of biological membranes depend not only on the quantitative correlations of individual phospholipids with different polar parts, but also to some extent on the composition of their hydrophobic part formed by FA chains [Citation47]. The FA composition of membrane lipids can vary widely, which significantly predetermines the structure and functions of membranes [Citation44]. In our study, the analysis of the FA composition of total phospholipids in human blood revealed the following acids: C12:0 lauric acid, C13:0 tridecyl acid, C14:0 myristic acid, C14:1 myristoleic acid, C16:0 palmitic acid, C16:1 palmitoleic acid, C18:0 stearic acid, C18:1 oleic acid, C18:2 linoleic acid, C18:3 linolenic acid, C20:0 arachidic acid, C20:2 eicosadienoic acid, C21:0 heneicosanic acid, C22:0 behenic acid, C22:1 erucic acid, C24:0 lignoceric acid and C24:1 nervonic acid.
We found that, in the PEA fraction during incubation in conditions of normoxia, the overall FA composition was predominated by erucic acid. C12:0. C16:0. C20:0. C24:0 FAs were not found. The saturation rate for PEA amounted to 0.61 ().
Figure 1. FA composition of PEA fraction during hyperoxia.
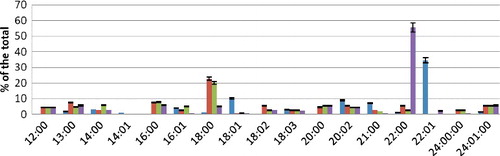
During incubation in conditions of hyperoxia in the presence of Ca2+ ions at a concentration of 3.5 mmol/L, the qualitative composition of saturated FAs changed; namely, there appeared C12:0, C16:0, C20:0 and C24:0 acids. Among the unsaturated acids, erucic acid was not detected. The content of saturated C18:0 and C22:0 FAs increased significantly. Unlike control samples, lignoceric acid was detected. Among the unsaturated FAs, the content of oleic acid significantly decreased, whereas myristoleic acid was not detected. The amount of linoleic and nervonic linoleic acids increased. The saturation rate was 0.84.
At pH = 6.8 during hyperoxia, the qualitative composition of PEA fatty acids did not change. The content of stearic acid significantly increased. Among the unsaturated FAs, the content of nervonic acid increased greatly and the amount of oleic and eicosadienoic acids decreased (). The saturation rate was 0.82.
At pH = 7.8, the qualitative composition of PEA fatty acids did not change either. The content of behenic acid in comparison with the control value increased significantly. Again, a small amount of erucic acid was detected, while lignoceric acid almost disappeared. The saturation rate was 0.84.
In the PC fraction of the control sample, we detected all of the above FAs except myristoleic and erucic acids. The main contribution to the amount was attributed to C16:0, C18:0 and C20:2. The saturation rate amounted to 0.81 (). During the incubation of erythrocytes in conditions of hyperoxia (incubation medium with CaCl2 3.5 mmol/L), qualitative changes in the FA composition were not detected in the PC fraction. Quantitatively, the increase in the content of all saturated acids was detected, which resulted in a high saturation rate – up to 0.85.
Figure 2. FA composition of PC fraction during hyperoxia.
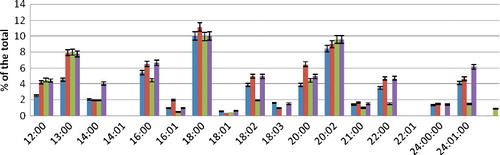
Decreasing the pH value of the incubation medium to 6.8 under the same conditions caused changes in the FA qualitative composition. C18:3 and C24:0 acids were not detected. The amount of C16:1, C18:2, C22:0 and C24:1 decreased significantly. The saturation rate increased to 0.89.
Changing the pH value of the incubation medium to 7.8 increased the amount of saturated FAs, particularly C12:0 and C14:0. Among the unsaturated FAs, the content of nervonic acid, C24:1 increased significantly. The saturation rate amounted to 0.85.
The overall FA composition of the PS fraction was similar to those described above, except that there was no linoleic and lignoglyceric acid. The saturation rate was 0.63 ().
Figure 3. FA composition of PS fraction during hyperoxia.
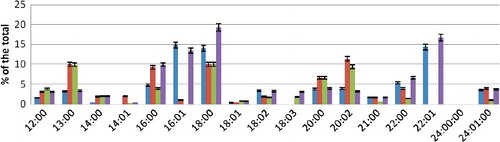
The overall FA composition of the PEA fraction was predominated by erucic acid. C12:0, C16:0, C20:0 and C24:0 acids were not detected. The saturation rate amounted to 0.61.
During incubation of human erythrocytes in conditions of hyperoxia and increased content of Ca2+ ions, in the PS fraction among FAs, C18:3 and C22:1 acids were not detected. The content of saturated acids increased except for C18:0 C22:0. Among the unsaturated FAs, the content of palmitoleic acid decreased markedly. The amount of eicosadienoic acid increased more than twofold. The saturation rate of PS was 0.82.
At pH = 6.8 under conditions of hyperoxia, the qualitative composition of PS saturated FAs did not change. Among the unsaturated FAs, palmitoleic and erucic acids were not detected. The saturation rate amounted to 0.82. At pH = 7.8, the qualitative composition of PS fatty acids did not differ from the control values. The amount of saturated acids C16:0 and C18:0 increased. The saturation rate was equal to 0.64.
The qualitative composition of FAs of phosphoinositides (PI) did not differ from previous fractions. In terms of amounts, among the saturated acids, the highest amount was that of C18:0 and C22:0 acids. Among the unsaturated FAs, palmitoleic acid predominated. The saturation rate of PI was equal to 0.77 ().
Figure 4. FA composition of PI fraction during hyperoxia.
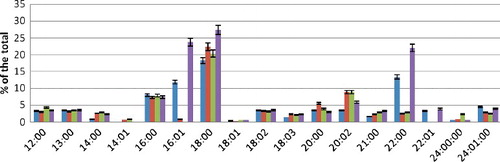
Saturated free FAs were mainly represented by C16:0 and C18:0 acids. Among the unsaturated acids, C16:1. C18:2 and 20:2 were detected. The saturation rate of FFA amounted to 0.86. PI did not have any significant changes during incubation in conditions of hyperoxia in the media with high content of CaCl2 in comparison with the control fraction of saturated FAs.
In quantitative composition, there was an increase in the amount of stearic and arachidic acids. The concentration of behenic and palmitoleic acids decreased significantly. Erucic acid disappeared completely. The saturation rate was 0.82.
At pH = 6.8 during hyperoxia, the PI fraction had a significantly low content of behenic acid. The amount of myristic acid increased. Among the unsaturated FAs, palmitoleic and erucic acids were not detected. The content of nervonic acid significantly decreased. The saturation rate of PI was 0.84.
At pH = 7.8, under the same conditions, there was a change in the qualitative composition of the fraction of unsaturated FAs. Myristoleic acid was not detected and erucic acid appeared again in an amount equal to the control value and palmitoleic acid in a twofold higher concentration of than the control values. The saturation rate decreased to 0.73.
Saturated FFAs are represented mainly by C16:0 and C18:0. Among the unsaturated FAs, C16:1, C18:2 and 20:2 were detected. The saturation rate of FFA totals to 0.86 ().
Figure 5. FA composition of FFA fraction during hyperoxia.
The composition of FFAs during incubation in conditions of hyperoxia and elevated concentrations of CaCl2 in comparison with the control fraction showed a significant decrease in the amount of stearic, myristic, heneicosanic and behenic acids. Unlike the control fraction, in the fraction of saturated acids, lignoceric acid was detected. Among the unsaturated FAs, myristoleic and nervonic acids were identified. The content of palmitoleic acid dropped significantly. The saturation rate was 0.86.
At pH = 6.8 under conditions of hyperoxia, myristoleic and linolenic acids reappeared in the FFA fraction. Among the saturated FAs, the content of myristic, stearic, heneicosanic and behenic acids dropped. Among the unsaturated acids, the content of eicosadienoic acid remained high and that of palmitoleic remained low. The saturation rate amounted to 0.83.
At pH = 7.8, the FFA composition underwent the following changes: myristoleic and linolenic acids re-appeared and the amount of stearic, heneicosanic and behenic acids dropped. Lignoceric acid was not detected. The saturation rate was 0.84.
Therefore, all examined fractions of phospholipids, had an increased saturation rate indicating a decrease in the content of unsaturated FAs and increase in the levels of saturated FAs. Accordingly, this leads to changes in the lipid bilayer microviscosity, which is an important indicator that depends on the phospholipids’ FA composition forming the membrane of RBCs [Citation48,Citation49].
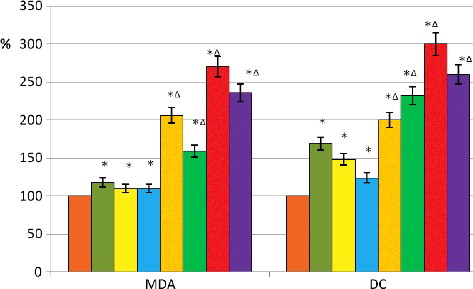
Changes in the amount of lipid peroxidation products in erythrocytes during hyperoxia
Our results in polar and hydrophobic regions of phospholipids testify that the lipid phase of the erythrocyte membrane was a highly dynamic system, responsive to external impacts. We assume that the detected changes can be attributed to the intensification of phospholipase systems [Citation24] and processes of LPO [Citation50]. To confirm our assumptions and assess the LP processes in erythrocytes, we determined the content of some primary products of LPO, DC, as well as of an end product, MDA. The results are presented in .
Table 2. Products of lipid peroxidation in erythrocytes under the effects of calcium and different concentrations of protons during normoxia and hyperoxia.
The analysis of the products of LPO showed that changing the composition of the incubation medium of erythrocytes led to an increase in the MDA and DC contents in RBCs, with maximum values for erythrocytes which were incubated in an environment with excessive concentration of Ca2+ ions (by 18% for MDA and 69% for DC in comparison with the control sample) (, ). The incubation of erythrocytes in conditions of hyperoxia led to a significant increase in LPO products, the amount of MDA and DC increased more than twofold in comparison with the control values (, ). The increased concentration of Ca2+ in the incubation medium worked for the decrease in the amount of MDA by 22.8% in comparison with the control values during hypoxia. At the same time, the amount of DC was increased by 19%. In addition, further conditions of acidosis and alkalosis created for RBCs, made possible even a more significant increase in the amount of MDA (by 27% and 24% in comparison with the control values during hyperoxia, respectively) as well as DC (by 50% and 30% in comparison with control values during hyperoxia, respectively) (, ).
Figure 6. Products of lipid peroxidation in erythrocytes under the effects of calcium and different concentrations of protons during normoxia and hyperoxia. Control normoxia (![]()
Changes in the oxygen-binding capacity of erythrocyte haemoglobin by incubation of erythrocytes during hypoxia
Changes in the phospholipid and FA composition of the erythrocyte lipids point to structural rearrangements in the membrane of erythrocytes and thus to the functional changes on the part of the erythrocyte as a whole, as well as on the part of the primary oxygen-transport protein of RBCs – haemoglobin (membrane-bound and cytoplasmic form) [Citation4,Citation5]. Our data obtained by RS suggested that these changes are linked to disruption of the conformation of haemoglobin and primarily its heme structures.
The images of the Raman spectra of haemoglobin haemoporphyrin [Citation39,Citation51] allow us to determine the degree of oxidation of the iron atom, its spin state and the presence of ligands. They reflect the changes in the structure of globin leading to the deformation of haemoporphyrin and affecting the oxygen-binding properties of haemoglobin [Citation52]. The conformation of haemoglobin haematoporphyrin of erythrocytes estimated in correlations of Raman spectra among healthy donors is presented in .
Figure 7. Raman spectrum of blood haemoglobin haemoporphyrin.
Values describing the oxygen-binding capacity of haemoglobin in conditions of normoxia are presented in . We observed that during incubation in the medium with normal oxygen content, additional impacts on erythrocytes (non-physiological values of pH or high content of Ca2+ ions in the medium) triggered changes in some indicators of the oxygen-binding capacity of haemoglobin (). Thus, the increase in the concentration of CaCl2 in the incubation medium up to 3.5 mmol/L triggered a significant increase in the correlation I1375/I1172 characterizing the intensity of the symmetric and asymmetric stretch of the pyrrole rings ().
Table 3. Correlation of typical Raman spectra bands of erythrocytes haemoglobin during normoxia and hyperoxia (M ± SD).
Figure 8. Correlation of typical Raman spectra bands of erythrocytes haemoglobin during normoxia and hyperoxia.
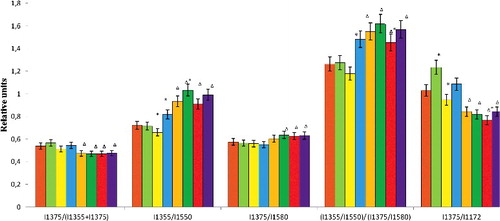
Conditions of acidosis increased the relative ability of Hb to bind oxygen, the affinity of haemoglobin to oxygen and the intensity of pyrrole rings stretch (by 9%, 8% and 10%, respectively). During alkalosis (pH = 7.8) in the incubation medium, we observed an increase in some indicators of the oxygen-binding capacity of RBCs. The ability of Hb to bind oxygen and the haemoglobin affinity to oxygen increased by 13% and 17.3%, respectively. The other parameters did not change. The relative amount of oxyhaemoglobin and the relative ability of Hb to discriminate the ligands remained unchanged if all additional exposures were applied.
The incubation of erythrocytes during hyperoxia triggered the increased haemoglobin affinity to ligands and the ability of haemoglobin to bind ligands (by 22.7% and 29.5%, respectively). The other parameters dropped (). This may indicate not only that in conditions of excessive oxygen in the incubation medium, the processes of oxygen release by haemoglobin are impaired. There may also be other ligands (NO, OH and CO) in haemoglobin, typical of the occurrence of pathological processes, because during hyperoxia, we observed a decrease in the relative amount of oxyhaemoglobin.
Additional effects of non-physiological pH values and elevated concentrations of calcium ions did not lead to further significant changes in the relative concentration of oxyhaemoglobin and the relative ability of haemoglobin to discriminate the ligands (in comparison with the control sample of erythrocytes in conditions of hyperoxia). With all that, all correlations were reliably measured against the control values in normoxia.
The changes in the composition of the incubation medium of erythrocytes during hyperoxia had an effect on the oxygen-binding ability of haemoglobin, its ability to bind ligands, the affinity of haemoglobin to oxygen and the intensity of the symmetric and asymmetric stretches of haematoporphyrin's pyrrole rings.
For instance, the ability of haemoglobin to bind ligands increased by 10% with elevated concentration of Ca2+ ions in the incubation medium, whereas the affinity of haemoglobin to oxygen and the intensity of the symmetric and asymmetric stretch of pyrrole rings decreased with the change in the pH to 6.8 by 7% and 10% against the control level in conditions of hyperoxia, respectively. In other cases, the effects of non-physiological pH values and elevated concentrations of calcium ions did not trigger additional changes in the oxygen-binding capacity of erythrocyte haemoglobin.
Correlation analysis
To assess the correlation between the content of membrane PL fractions, the intensity of LPO and the haemoglobin oxygen-binding capacity (values of conformational changes of haemoglobin haematoporphyrin) of RBCs, we conducted correlation analysis. We detected varying correlations between all values of haemoglobin oxygen-binding properties and PS content. For instance, the correlation rate was +0.80 (for the relative ability of Hb to bind ligands (including O2)) and +0.70 (for the relative ability of Hb to discriminate ligands) at p ≤ 0.05, indicating a strong positive correlation between these parameters. A strong inverse correlation was found between the PC content and the relative amount of оxyHb in the blood (r = −0.73) at p ≤ 0.05. Between the other parameters of haemoglobin oxygen-binding capacity and the amount of PS, there was moderate and medium correlation.
The content of SM correlated with all parameters of haemoglobin oxygen-binding capacity; moreover, we revealed a strong correlation between the values of the relative amount of o-Hb and the ability of haemoglobin to discriminate ligands (r = −0.71 and r = 0.84, respectively) at p ≤ 0.05. Between the values of haemoglobin ligand-binding capacity, haemoglobin affinity to ligands and intensity of symmetric and asymmetric stretch of pyrrole rings, average correlation dependence (r = 0.68, r = 0.53 and r = −0.63, respectively) was detected.
When examining the correlations between the values of the relative amount of o-Hb, the ligand-binding capacity of haemoglobin, the intensity of symmetric and asymmetric stretch of pyrrole rings and the haemoglobin capacity to release ligands, we observed average and moderate correlation (r = −0.49, r = 0.57, r = 0.64 and r = −0.49, respectively) with PC lysoform (p ≤ 0.05). The analysis of the correlations between the values of the relative amount of o-Hb, the ligand-binding capacity of haemoglobin, the haemoglobin affinity to ligands and the intensity of symmetric and asymmetric stretch of pyrrole rings, revealed average and moderate correlation (r = 0.58, r = −0.61, r = −0.40 and r = 0.54, respectively) with PI (p ≤ 0.05). On the other hand, strong correlations were not detected between the intensity of the symmetric and asymmetric stretch of pyrrole rings and the content of phospholipids’ fractions.
We also revealed correlation between the values of the haemoglobin oxygen-binding capacity and the amount of products of LPO. There was strong correlation between the content of MDA and the relative amount of o-Hb, the ligand-binding ability of haemoglobin, the ability of haemoglobin to discriminate ligands and the intensity of the symmetric and asymmetric stretches of pyrrole rings (r = −0.81, r = 0.71, r = 0.81 and r = −0.77, respectively). Moderate correlation was found between the amount of MDA and the values of the affinity of haemoglobin to ligands; the correlation rate was 0.45. There was strong correlation between the amount of DC and the values of the relative amount of o-Hb, the haemoglobin ligand-binding capacity, the ability of haemoglobin to discriminate ligands and the intensity of the symmetric and asymmetric stretch of pyrrole rings (r = −0.78, r = 0.73, r = 0.86 and r = −0.72, respectively). Between the amount of DC and the values of affinity of haemoglobin to ligands, including to oxygen, there was moderate correlation (r = 0.39).
Analysis
During normoxia, the additional effect of high concentrations of Ca2+ triggered a decrease in the main PL fractions in erythrocyte membranes with a simultaneous significant increase in the number of phospholipids’ lysoforms. During normoxia, the concentration of Ca2+ ions outside the cell is approximately 1.8 mmol/L; in the erythrocyte cytosol, the concentration of Ca2+ ions ranges from 30 to 60 nmol/L. This difference is maintained by the low permeability of the erythrocyte membrane to Ca2+ and the active work of Ca2+−ATPase [Citation53]. The enzyme activity is controlled by regulators such as calmodulin, PI, mostly localized on the outer membrane layer. In addition, the activity of Ca2+-ATPase may be regulated by phosphorylation under the action of protein kinases A and C.
High level of free Ca2+ in the cytosol leads to the activation of Ca2+−ATPase. It is known that high intracellular concentration of Ca2+ in erythrocytes leads to opening of CA-activated K-channels, through which K+ ions are released from erythrocytes. This phenomenon is called ‘the Gàrdos effect’. Activation of these channels occurs as a response to the increased concentration of Ca2+ in the cell or when other ways to transport Ca2+ are disrupted [Citation54–56].
The increase in intracellular concentration of Ca2+ will trigger cascades of enzymatic reactions, in particular related to the activation of proteases and phospholipases. As a result, there is aggregation of membrane proteins and hydrolysis of phospholipids accompanied by accumulation of lysoforms; thus, the permeability of biomembranes becomes enhanced. Altogether this leads to impairment of the function of RBCs and to changes in their morphological characteristics [Citation57,Citation58].
Apart from that, the increase in the amount of Ca ions in the extracellular medium was accompanied by changes in FA composition of PLs and an increase in the degree of their oxidation, exhibited by the increase in the saturation rate for all PL factions, with the exception of FFA. The presence of increased amount of Ca ions in the incubation medium led to an increase in the intensity of the symmetric and asymmetric stretch of the pyrrole rings of haemoglobin haematoporphyrin of RBCs. The other values of the oxygen-binding capacity of haemoglobin were not reliably affected by the above factor.
When changing the pH of the incubation medium of erythrocytes by making it more acidic or alkaline, similar changes in the phospholipid composition of erythrocyte membranes were observed. Conditions of acidosis also triggered changes in the FA composition of PL fractions such as PEA, PI, PC and PS. Their composition revealed an increased proportion of saturated FAs that was accompanied by an increase in the saturation rate. In case of alkalosis, the same changes were characteristic only for the main structure-forming membrane phospholipids of RBCs – PEA and PS; for the rest of the PL fractions, the degree of oxidation did not change.
The conditions of acidosis and alkalosis did not affect the relative amount of oxyhaemoglobin, the ability of haemoglobin to discriminate ligands. The change in the medium pH produced the strongest effect on such properties of haemoglobin as the capacity to bind ligands (including oxygen) and the affinity of haemoglobin to ligands (primarily oxygen).
It is known that medium pH can affect the shape and deformability of erythrocytes [Citation59,Citation60], membrane proteins and the phospholipid bilayer [Citation61–64] and the stability of the cytoskeleton [Citation65–67]. In addition, pH changes can affect the transmembrane transport of substances, reducing the rate of diffusion of oxygen in the lipid bilayer. This, in turn, will affect the structure and function of intracellular Hb and, consequently, the oxygen exchange of erythrocytes [Citation68].
Significant changes in the composition and degree of oxidation of membrane phospholipids occurring during experimental hyperoxia, can primarily be attributed to the intensification of LPO [Citation69]. In this case, first of all, there is a disruption in the integrity of the lipid bilayer of cell membranes. During intensive run of free radical processes, the amount of phospholipids composed of PUFA – phosphatidylserine, phosphatidylcholine and phosphatidylethanolamine, declines mostly dramatically [Citation70].
Reducing the amount of PEA may lead to disturbance of the ion-transport capacity of enzymes such as Ca2+-ATPase and Na+/K+-ATPase [Citation71]. PCH, as a membrane-stabilizing PL fraction, is the natural protector of the erythrocyte membrane. If its quantity becomes reduced, there will be an increase in the oxidative capacity and a decrease in the stability of the erythrocyte membrane.
During hyperoxia, not only the content of structural lipids of PEA and PCH, but also the content of minor, metabolically significant phospholipid PI decreases. According to scientific literature, the decrease in the content of phosphatidylinositol in the structure of membranes can be attributed to its extensive consumption as a precursor of the secondary messenger of intracellular processes – diacylglycerol, as well as to its degradation due to intensification of free radical oxidation of PUFAs that this phospholipid is rich in [Citation69]. Such changes may point to a decline in the adaptive capacity of both individual cells and the whole organism.
Considering the inability of erythrocytes to synthesize lipids and the metabolic pathways of membrane PL in the cell, we can assume that changes in the PL composition can be attributed to activation of phospholipase C and D, the product of which is PC, and of phospholipase A2, carrying out PL degradation with formation of lysofractions [Citation70,Citation72]. Since phospholipase A2 predominantly hydrolyses PCH, and phospholipase D has exclusive specificity to that PL [Citation70,Citation72], the decrease in the level of PCH may be associated with combined activation of these enzymes.
Apart from that, the potentiating effect on the degradation of PCH is produced by free-radical modification of its molecules, which are rich in unsaturated double bonds and act as the main substrate of LPO processes [Citation70]. Hyperoxia triggers the activation of LP, which enables peroxidation of PL in the membrane of erythrocytes; besides, PLs composed of hydroperoxides of FAs are especially most actively hydrolysed by phospholipase A2 [Citation72,Citation73].
Selective delipidization of membranes causes changes in their physico-chemical properties and an increase in their microviscosity. In turn, the changes in the biological membranes of RBCs lead to a decrease in the cells’ deformability, haemolysis of erythrocytes, enhancement of blood viscosity and impairment of the oxygen-transport function.
Erythrocytes are particularly susceptible to LP because they consist of many easily oxidizable phospholipids. When activating LP as a response to the increase in the passive permeability of potassium and sodium ions, and disruption of the erythrocyte osmotic balance, the lifespan of these cells decreases [Citation74]. LP in membranes disrupts the selective permeability and rheological properties of cells.
FAs, as part of PL erythrocyte membranes, exert paramount influence on the properties of the membrane and, consequently, on the morphology and function of erythrocytes in general. Human erythrocytes, in view of their specific structure, are deprived of the capacity to synthesize and oxidize FAs. Erythrocytes do not use FAs as a source of energy. Changes in the FA composition can only occur under the influence of active forms of oxygen on PL erythrocyte membranes, and such active forms are generated in sufficient quantities in erythrocytes (because erythrocytes have large quantities of oxygen). Moreover, oxidative stress and LP developing during various pathological processes also trigger modifications in the PL and FA composition of erythrocyte membranes due to formation of peroxide compounds of lipids. All these changes in the PL and FA composition of erythrocyte membranes trigger changes in the conformation of haemoglobin and haematoporphyrin and affect the erythrocyte oxygen-binding capacity.
During hyperoxia, the following characteristics of the oxygen-binding capacity of haemoglobin increased significantly: the ligand-binding capacity and the affinity to ligands, including oxygen. At the same time, the relative amount of o-Hb and the intensity of the symmetric and asymmetric stretch of the pyrrole rings of haematoporphyrin decreased. The ligand-binding capacity of haemoglobin increased due to additional action of Ca2+ ions. Additional conditions of acidosis on the background of hyperoxia, as well as during normoxia triggered a decrease in the affinity of haemoglobin to ligands (including oxygen). Conditions of alkalosis during hyperoxia, unlike normoxia, did not cause changes in the values of the oxygen-binding capacity of haemoglobin.
Conclusions
The results from this study demonstrated that during hyperoxia, there occur profound changes in the lipid composition of erythrocyte membranes. The observed changes affect to the polar as well as the hydrophobic regions of the phospholipid molecules. Such profound changes in the phospholipid composition are caused by the joint action of lipolytic enzymes as well as by intensive oxidative processes affecting the polyunsaturated component of the phospholipids. As a result, changes in the lipid bilayer impair the oxygen-binding and oxygen-transport properties of erythrocyte haemoglobin.
Disclosure statement
The authors declare that there is no conflict of interests regarding the publication of this paper.
Additional information
Funding
References
- Drgová A, Likavčanová K, Dobrota D. Changes of phospholipid composition and superoxide dismutase activity during global brain ischemia and reperfusion in rats. Gen Physiol Biophys. 2004;23:337–346.
- Weijers RNM. Lipid composition of cell membranes and its relevance in type 2 diabetes mellitus. Curr Diabetes Rev. 2012;8(5):390–400.
- Ivanova SM, Morukov BV, Maksimov GV, et al. Morphological and functional features of the blood in humans during a nine-day stay in an oxyargon environment with various oxygen contents. Hum Physiol. 2012;38(7):786–787.
- Revin VV, Filatova SM, Syusin IV, et al. Study of correlation between state and composition of lipid phase and change in erythrocytes structure under induction of oxidative processes. Int J Hematol. 2015;101(5):487–496.
- Revin VV, Gromova NV, Revina ES, et al. Study of the structure, oxygen-transporting functions, and ionic composition of erythrocytes at vascular diseases. BioMed Res Int. 2015 [cited 2017 Nov 22];2015: 973973 [7p.]. DOI: 10.1155/2015/973973
- Revin VV, Gromova NV, Revina ES, et al. Role of membrane lipids in the regulation of erythrocytic oxygen-transport function in cardiovascular diseases. BioMed Res Int. 2016 [cited 2017 Nov 30];2016: 3429604 [11 p.]. DOI: 10.1155/2016/3429604
- Mohandas N, Gallagher PG. Red cell membrane: past, present, and future. Blood. 2008;112(10):3939–3948.
- Mach WJ, Thimmesch AR, Pierce JTh, et al. Consequences of hyperoxia and the toxicity of oxygen in the lung. Nurs Res Pract. 2011 [cited 2017 Nov 30];2011: 260482 [7 p.].DOI: 10.1155/2011/260482
- Kilgannon JH, Jones AE, Shapiro NI, et al. Association between arterial hyperoxia following resuscitation from cardiac arrest and in-hospital mortality. JAMA. 2010;303(21):2165–2171.
- Wang CH, Chang WT, Huang CH, et al. The effect of hyperoxia on survival following adult cardiac arrest: a systematic review and meta-analysis of observational studies. Resuscitation. 2014;85(9):1142–1148.
- Davis DP, Meade W, Sise MJ, et al. Both hypoxemia and extreme hyperoxemia may be detrimental in patients with severe traumatic brain injury. J Neurotrauma. 2009;26(12):2217–2223.
- Rincon F, Kang J, Maltenfort M, et al. Association between hyperoxia and mortality after stroke: a multicenter cohort study. Crit Care Med. 2014;42(2):387–396.
- Rincon F, Kang J, Vibbert M, et al. Significance of arterial hyperoxia and relationship with case fatality in traumatic brain injury: a multicentre cohort study. J Neurol Neurosurg Psychiatry. 2014;85(7):799–805.
- Jonge de E, Peelen L, Keijzers PJ, et al. Association between administered oxygen, arterial partial oxygen pressure and mortality in mechanically ventilated intensive care unit patients. Crit Care. 2008 [cited 2017 Nov 30];12(6):R156. [8 p.] DOI: 10.1186/cc7150
- Stub D, Smith K, Bernard S, et al. Air versus oxygen in ST-segment elevation myocardial infarction. Circulation. 2015;131(24):2143–2150.
- Helmerhorst Hendrik JF, Wilde de Rob BP, Hyun LD, et al. Hemodynamic effects of short-term hyperoxia after coronary artery bypass grafting. Ann Intensive Care, 2017.7(20):20–29.
- Revin VV, Klenova NA, Gromova NV, et al. Physical and chemical processes and the morphofunctional characteristics of human erythrocytes in hyperglycaemia. Front Physiol. 2017 [cited 2017 Nov 30];8:606 [ 8 p.]. DOI: 10.3389/fphys.2017.00606.
- Gromova NV, Revin VV, Revina NV, et al. Changes in morphometric and oxygen-binding properties of erythrocytes in vascular diseases patients. Biodiscovery. 2017 [cited 2017 Nov 30];20:e15079 [ 1 p.]. DOI: 10.3897/biodiscovery.20.e15079
- Yee M, Vitiello PF, Roper JM, et al. Type II epithelial cells are critical target for hyperoxia-mediated impairment of postnatal lung. Am J Physiol Lung Cell Mol Physiol. 2006;291(5):L1101–L1111.
- Rahman I, Biswas SK, Kode A. Oxidant and antioxidant balance in the airways and airway diseases. Eur J Pharmacol. 2006;533(1–3):222–239.
- Clanton TL. Hypoxia-induced reactive oxygen species formation in skeletal muscle. J Appl Physiol. 2007;102(6):2379.
- Ayala A, Muñoz MF, Argüelles S. Lipid peroxidation: production, metabolism, and signaling mechanisms of malondialdehyde and 4-hydroxy-2-nonenal. Oxid Med Cell Longev. 2014 [cited 2017 Nov 30];2014:1 [ 31 p.]. DOI: 10.1155/2014/360438
- Singh AK, Singh S, Garg G, et al. Rapamycin alleviates oxidative stress induced damage in rat erythrocytes. Biochem Cell Biol. 2016;94:447–471.
- Berezhnova AV, Fedotovaa EI, Nenovc MN, et al. Role of phospholipases in cytosolic calcium overload and cardiomyocytes death in the presence of activated fatty acid derivatives. Biochem Moscow Suppl Ser A. 2010;4:56–63.
- Marangoni AG. pH Dependence of enzyme-catalyzed reactions. In: Marangoni AG, editor. Enzyme kinetics: а modern аpproach. Hoboken (NJ): Wiley; 2003. p. 79–89.
- Bligh EA, Dyer W, Can J. Rapid method of total lipid extraction and purification. Biochem Physiol. 1959;37(8):911–917.
- Handloser D, Widmer V, Reich E. Separation of phospholipids by HPTLC – an investigation of important parameters. J Liq Chromatogr Relat Technol. 2008;31:1857–1870.
- Reich Е, Schibli A. A standardized approach to modern high performance TLM-layer chromatography (HPTLC). J Planar Chromatogr. 2004;6(17):438–443.
- Kirchner Y. Tonkosloynaya khromatografiya [Thin-layer chromatography]. Vol. 2. Moscow: Mir; 1981. Russian.
- Vaskovsky VE, Vaskovsky VE, Kostevsky EY, et al. A universal reagent for phospholipids analysis. J Chromatogr. 1975;114(1):129–141.
- Marinetti GV. New biochemical separations. Princeton (NJ): Van Norstrand; 1964.
- Morrison WR, Smith ML. Preparation of fatty acid methylesters and dimethylacetals from lipid with boron fluoridemethanol. J Lipid Res. 1964;5:600–608.
- Ohkawa H, Ohishi N, Vagi K. Assay for lipid peroxides in animal tissues by thiobarbituric acid reaction. Analyt Biochem. 1979;95:351–358.
- Gavrilov VB, Mishkorudnaya MI. Spektrofotometricheskoye opredeleniye soderzhaniya gidroperekisey lipidov v plazme krovi [ Spectrophotometric determination of lipid hydroperoxides in blood plasma]. Laboratornoye Delo. 1983;3:33–35. Russian.
- Gavrilov VB, Gavrilova AR, Mazhul' MM. Analiz metodov opredeleniya produktov perekisnogo okisleniya lipidov v syvorotke krovi po testu s tiobarbiturovoy kislotoy [Analysis of methods for the determination of lipid peroxidation products in blood serum according to the test with thiobarbituric acid]. Vopr Med Khimii. 1987;1:118–121. Russian.
- Placer Z. Lip peroxidation systeme im biologischen material. Nahrung. 1968;12:679–684.
- Jewell SA, Petrov PG, Winlove CP. The effect of oxidative stress on the membrane dipole potential of human red blood cells. Biochim Biophys Acta. 2013;1828(4):1250–1258.
- Brazhe NA, Abdali S, Brazhe AR, et al. New insight into erythrocyte through in vivo surface-enhanced Raman spectroscopy. Biophys J. 2009;97(12):3206–3214.
- Brazhe NA, Baizhumanov AA, Parshina EY, et al. Studies of the blood antioxidant system and oxygen-transporting properties of human erythrocytes during 105-day isolation. Hum Physiol. 2014;40:804–809.
- Maksimov GV, Brazhe NA, Yusipovich AI, et al. Use of nanoparticles for studying the conformations of submembrane hemoglobin. Biophysics. 2011;56(6):1069–1073.
- Vlasov AP, Trofimov VA, Tarasova TV, et al. Strukturno-funktsional'noye sostoyaniye gemoglobina pri gestoze [ Structural-functional state of hemoglobin in gestosis]. Sovremennyye Problemy Nauki i Obrazovaniya. 2012;6 [8 c.]. Russian.
- Geary RC. Testing for normality. Biometrika. 1947;34(3/4):209–242.
- Tukey JW. Comparing individual means in the analysis of variance. Biometrics. 1949;5(2):99–114.
- Novitskiy VV, Ryazantseva NV, Stepovaya YEA, et al. Molekulyarnyye narusheniya membrany eritrotsitov pri patologii raznogo geneza yavlyayutsya tipovoy reaktsiyey organizma: kontury problemy [ Molecular disturbances of the erythrocyte membrane in pathologies of different genesis are a typical reaction of the organism: the contours of the problem]. Byulleten' Sibirskoy Meditsiny. 2006;2:62–69. Russian.
- Penga Z, Lib X, Pivkinc IV, et al. Lipid bilayer and cytoskeletal interactions in a red blood cell. PNAS. 2013;110(33):13356–13356.
- Dobrotyna NA, Kopytova TV, Shelchkova NA. The erythrocyte membrane function characteristic in patients with severe generalized dermatoses about endogenous intoxication. Mod Problems Sci Educ. 2010;2:39–43.
- Korzhenevskiy DA, Selischeva AA. Evaluation of phospholipid composition of erythrocytes from healthy volunteers by the method of high-performance liquid chromatography with a light scattering detector. Bull Exp Biol Med. 2009;147:489–492.
- Prades J, Funari SS, Escribá PV, et al. Effects of unsaturated fatty acids and triacylglycerols on phosphatidyl ethanolamine membrane structure. J Lipid Res. 2003;44(9):1720–1727.
- Revin V, Grunyushkin I, Gromova N, et al. Effect of hypoxia on the composition and state of lipids and oxygen-transport properties of erythrocyte haemoglobin. Biotechnol Biotechnol Equip. 2017;31(1):128–137.
- Borza C, Muntean D, Dehelean C, et al. Oxidative stress and lipid peroxidation – a lipid metabolism dysfunction. Lipid Metab. 2013;34:23–38.
- Mityanina VA, Parshina EY, Yusipovich AI, et al. Oxygen-binding characteristics of erythrocyte in children with type I diabetes mellitus of different duration. Bull Exp Biol Med. 2012;153(4):508–512.
- Yusipovich AI, Braze NA, Luneva OG, et al. Сhanges in the state of hemoglobin in patients with coronary heart disease and patients with circulatory failure. Bull Exp Biol Med. 2013;155(2):233–235.
- Tiffert T, Bookchin RM, Lew VL. Calcium homeostasis in normal and abnormal human red cells. Berlin, Germany: Springer Verlag; 2003.
- Agroyannis B, Paraskevopoulos A, Kopelias I, et al. Erythrocyte damage prevented by Gardos effect in hemodialyzed uremic patients. Artif Organs. 2000;24(9):743–745.
- Maher AD, Kuchel PW. The Gárdos channel: a review of the Ca2+-activated K+ channel in human erythrocytes. Int J Biochem Cell Biol. 2003;35:1182–1197.
- Lang PA, Kaiser S, Myssina S, et al. Role of Ca2+−activated K+ channels in human erythrocyte apoptosis. Am J Physiol Cell Physiol. 2003;285(6):C1553–C1560.
- Bruce JI, Elliott AC. Oxidant-impaired intracellular Ca2+ signaling in pancreatic acinar cells: role of the plasma membrane Ca2+-ATPase. Am J Physiol Cell Physiol. 2007;293(3):C938–C950.
- Woon L.A., Holland J.W., Kable E.P., et al. Ca2+ sensitivity of phospholipid scrambling in human red cell ghosts. Cell Calcium. 1999;25:313–320.
- Kuzman D, Znidarcic T, Gros M, et al. Effect of pH on red blood cell deformability. Pflügers Arch. 2000;440(1):R193–R194.
- Iglič A, Hägerstrand H, Kralj-Iglič V, et al. A possible physical mechanism of red blood cell vesiculation obtained by incubation at high pH. J Biomech. 1997;31(2):151–156.
- Zhou Q, Zhao J, Stout JG, et al. Molecular cloning of human plasma membrane phospholipid scramblase a protein mediating transbilayer movement of plasma membrane phospholipids. J Biol Chem. 1997;272(29):18240–18244.
- Takakuwa Y, Mohandas N. Modulation of erythrocyte membrane material properties by Ca2+ and calmodulin. Implications for their role in regulation of skeletal protein interactions. J Clin Invest. 1988;82(2):394–400.
- Takakuwa Y. Protein 4.1, a multifunctional protein of the erythrocyte membrane skeleton: structure and functions in erythrocytes and nonerythroid cells. Int J Hematol. 2000;72(3):298–309.
- Sikorski AF, Hanus-Lorenz B, Jezierski A, et al. Interaction of membrane skeletal proteins with membrane lipid domain. Acta Biochim Pol. 2000;47(3):565–578.
- Sato SB, Ohnishi S. Interaction of a peripheral protein of the erythrocyte membrane, band 4.1, with phosphatidylserine-containing liposomes and erythrocyte inside-out vesicles. Eur J Biochem. 2005;130(1):19–25.
- Liu F, Mizukami H, Sarnaik S, et al. Calcium-dependent human erythrocyte cytoskeleton stability analysis through atomic force microscopy. J Struct Biol. 2005;150(2):200–210.
- Best KB, Ohran AJ, Hawes AC, et al. Relationship between erythrocyte membrane phase properties and susceptibility to secretory phospholipase A2. Biochemistry. 2002;41(47):13982–13988.
- Yao C, Huang Y, Li X, et al. Effects of pH on structure and function of single living erythrocyte. Chin Sci Bull. 2003;48(13):1342–1346.
- Litvitskiy PF. Patogennyye i adaptivnyye izmeneniya v serdtse pri yego regionarnoy ishemii i posleduyushchem vozobnovlenii koronarnogo krovotoka [ Pathogenic and adaptive changes in the heart with its regional ischemia and the subsequent resumption of coronary blood flow]. Patol Fiziol i Eksper Ter. 2002;2:2–12. Russian.
- Peng X, Frohman MA. Mammalian phospholipase D physiological and pathological roles. Acta Physiol (Oxf). 2012;204(2):219–226.
- Suju M, Davila M, Poleo G, et al. Phosphatidylethanol stimulates the plasmamembrane calcium pump from human erythrocytes. Biochem J. 1996;317:933–938.
- Canonne J, Froidure-Nicolas S, Rivas S. Phospholipases in action during plant defense signaling. Plant Signal Behav. 2011;6(1):13–18.
- Vercaеmst L. Hemolysis in cardiac surgery patients undergoing cardiopulmonary bypass: a review in search of a treatment algorithm. J Extra Corporeal Technol. 2008;40(4):257–267.
- Vasil'yeva YEM. Biokhimicheskiye osobennosti eritrotsita. Vliyaniye patologii [Biochemical features of the erythrocyte. The influence of pathology]. Biomed Khim. 2005;51(2):118–126. Russian.