
ABSTRACT
Pistacia vera L. is the only cultivated and commercially-grown species in the genus and Iran is one of the two major centers of Pistacia diversity and the main producer of pistachios in the world. Genetic diversity is crucial for sustainable use of genetic resources and conservation. To investigate the genetic diversity of pistachio (Pistacia vera), we genotyped 42 cultivars of this species using 20 polymorphic nuclear simple sequence repeat (nSSR) markers. The nSSR markers generated 3–7 alleles (102 in total) with an average of 5.10 per locus. Polymorphism information content (PIC) ranged from 0.36 to 0.86 with an average value of 0.64, while the observed heterozygosity (Ho) ranged from 0.21 to 0.79 with an average value of 0.44 and also the expected heterozygosity (He) varied from 0.11 to 0.39 with an average of 0.22. Genetic similarity values obtained from Dice's coefficient ranged from 0.08 to 0.93. The UPGMA (unweighted pair group method with arithmetic mean) dendrogram and Bayesian clustering separated the cultivars into two major clusters containing 21 and 21 cultivars, respectively, and also the neighbour-joining method revealed their phylogenetic relationships. The present results indicated the existence of wide genetic variability within the species and can be used for further research in the area of germplasm conservation and plant breeding.
Introduction
The genus Pistacia is a member of the Anacardiaceae family and consists of 11 species [Citation1]. Pistacia vera L. (2n = 2x = 30) is a commercially-grown species in the genus [Citation2], native to north Afghanistan, northeast Iran and central Asian republics [Citation3]. It has been cultivated widely especially in Iran, which allocates the main part of the country's non-petroleum export product [Citation4]. As one of the oldest nut crops in human history, it dates back to ancient times [Citation1]. In addition, pistachio nuts have a high nutritional value and are commercially important [Citation3]. There are two other species in Iran, including P. atlantica subsp. mutica and P. khinjuk, which are mainly used as rootstock for P. vera [Citation4]. Iran is the world's largest producer of pistachio with the highest cultivation area of this crop in the world [Citation5], but compared to some countries like United States and Turkey, has low yield in recent years.
Although morphological, physiological and biochemical methods are current tools to study genetic diversity of the plant species, they have some limitations, for instance lack of sufficient polymorphism, effect of environmental conditions on character expression and time consumption for making a full description, as several characters need to be evaluated during the entire growth period of the plant. For these reasons, morphological, physiological and biochemical methods cannot be the only efficient techniques for identification of tolerant cultivars. The genetic bottlenecks imposed by crop domestication and the subsequent improvement programmes have meant that only a small fraction of the total genetic diversity within a species gene pool is captured in the modern improved crop cultivars [Citation6]. The amount of genetic diversity within a crop species depends on the various types of genetic resource in question, i.e. whether the resource is a wild genetic stock or a highly selected material from a breeding programme, as well as the breeding system and domestication history [Citation7]. Determination of genetic diversity can help the achievement of the processes such as gene transferring from wild species through direct gene transfer techniques or using vectors without needing crossing, shortening plant breeding programmes and rapid and safe selection in hybrids carrying a foreign gene. Continual advances in crop improvement through plant breeding are driven by the available genetic diversity. Therefore, the recognition and measurement of such diversity is crucial to breeding programmes. In addition, this knowledge provides the cornerstone on which decisions for germplasm collection, preservation and exchange are based. It is important to have fast, reliable, cost effective and objective methods to identify and describe plant material [Citation8].
Today, molecular marker technology provides a new way to identify cultivars and evaluate genetic diversity. DNA markers allow direct comparisons of different cultivars at molecular level [Citation9]. A number of different DNA molecular assays have been applied in pistachio studies, including RFLP [Citation8], RAPD [Citation10,Citation11], AFLP [Citation12], SRAP [Citation13] and SSR [Citation14,Citation15]. Microsatellite markers (SSRs) are tandem repeats of one to six nucleotides which are widespread in both eukaryotic and prokaryotic genomes [Citation16,Citation17]. SSR marker has some advantages such as quickness, simplicity, co-dominant inheritance, high polymorphism and abundant distribution throughout genomes. This technique has been used widely for genetic mapping, comparative analysis and QTL analysis in plants [Citation18].
Iran is considered as the origin of a number of fruits and nuts, because the country has highly diverse weather conditions and geographic regions [Citation19]. Despite the extensive genetic diversity of Iranian pistachio germplasm, few studies have addressed this important crop, and only some of its cultivars are commercially used. Thus, the germplasm of this species in Iran is endangered. Therefore, in order to manage and protect the Iranian pistachio, identification and registration of this valuable nut crop is essential for breeding programmes as well as commercial production. Thus, in the current study, nuclear SSR markers (nSSR) have been used to investigate the extent of diversity in the cultivars of P. vera gathered across Iran.
Materials and methods
A total of 42 pistachio cultivars from major growing centers of the crop in Iran were used (). Young leaves were collected from each cultivar during June to July, frozen immediately after collection with liquid nitrogen and grinded into powder. Total genomic DNA was extracted from 100 to 200 mg leaf material following a CTAB-based procedure as Doyle and Doyle [Citation20]. Quality and quantity of DNA were estimated both visually by ethidium bromide stained agarose gel 1.00% and a spectrophotometer.
Table 1. The studied cultivars of P. vera and their locations.
For nuclear DNA amplifications, a total of 20 nSSR primer pairs were used (). nSSR primer pairs were originally developed for P. vera by Topcu et al. [Citation21]. The authors reported that they could be useful in genetic studies on the genus Pistacia for different purposes such as fingerprinting, population genetic and molecular characterization. nSSR PCR was carried out in a thermal cycler (My cycler, Bio rad, Germany) in a total volume of 25 µL under the following conditions: 20 ng/µL genomic DNA, 1x PCR buffer (10 mmol/L Tris-HCl, pH 8.00; 50 mmol/L KCl), 1.50 mmol/L MgCl2, 200 µmol/L of each dNTP, 10 pmol of each primer and 1 U Taq DNA polymerase (Cinna Gen, Iran). Reactions were performed using a Touchdown PCR program of 5 min denaturation at 94 °C, followed by 10 cycles of 45 s at 94 °C, 45 s at 63 °C, decreasing with 0.80 °C every cycle and 1 min at 72 °C. This was followed by 25 cycles of 45 s at 94 °C, 60 s at primer set annealing temperature, 1 min at 72 °C and a final extension time of 7 min at 72 °C. PCR amplifications were confirmed by running 10 µL of PCR product on 2.50% agarose gels. Then, the amplification products were detected on 14% non-denaturing polyacrylamide gels visualized by silver nitrate staining.
Table 2. List of nSSR primer pairs used and informativeness obtained in the studied cultivars of P. vera.
The nSSR alleles were systematically scored along a ladder size. Polymorphism information content (PIC) was calculated for each primer using formulas described by Powell et al. [Citation22]. PIC = 1 − Σpi2, where, pi is the frequency of the ith allele. Also, MI = PIC × nβ, where PIC is the mean value of total PIC, n is the number of bands and β is the proportion of polymorphic bands (Powell et al. 1996). For each primer pair, the number of different alleles (Na), number of effective alleles (Ne), number of private alleles (Np), observed heterozygosity (Ho), expected heterozygosity (He) and discrimination power (Dp) were estimated using the GenAlEx 6.5 program [Citation23].
The genetic similarities according to Dice's coefficient were calculated using the SIMQUAL program of the numerical taxonomy multivariate analysis system NTSYS-pc version 2.10 [Citation24] and the dendrogram was constructed through the SAHN clustering program using the unweighted pair group method with arithmetic means (UPGMA). The correlation between the nSSR similarity matrix and constructed dendrogram was computed by Mantel Test [Citation25] using the COPH and MYXCOMP programs.
In addition, polymorphic alleles were analyzed using the STRUCTURE software to determine population structure, using the Monte Carlo Markov Chain (MCMC) algorithm [Citation26,Citation27]. STRUCTURE version 2.3.3 was applied to assign the cultivars to the subpopulations (K). The later data probabilities for each K (Pr(X | K)) or L(K) for clusters K = 1 to K = 10 were obtained using the Admixture model, which allows potential recombination between the justifiable clusters. Ten runs were used for each K, with 70,000 replicates, after a burn period of 30,000. The batch run function for a total of 100 runs (10 runs each for 1–10 clusters) was performed to measure the probability change value of each K. According to Evanno et al. [Citation28], some of the subpopulations were inferred using the rate of change of the log probability (ΔK) between the conjugate values of K. Also, FreeTree software (version 0.9.1.50) [Citation29] was used for phylogenetic relationships using neighbour-joining (NJ) trees which were viewed using Tree View program, version 1.6.6 [Citation30].
Results and discussion
The 20 nSSR primer pairs gave reproducible amplification products. A total of 102 alleles were generated using the 20 primer pairs across the studied cultivars (). The number of different alleles (Na) per primer pairs ranged from 3 (by CUPVB443a, CUPVD642x and CUPVB583) to 7 (CUPVB577, CUPVB630 and CUPVB462y) with an average of 5.10 alleles per primer pairs (). Number of effective alleles (Ne) ranged from 1.05 (by CUPVB595) to 1.79 (by CUPVB567x), with a mean of 1.40. The size of the alleles ranged from 111 to 244 bp. Observed heterozygosity (Ho) ranged from 0.21 (by CUPVB465) to 0.79 (CUPVB567x) with an average value of 0.44, while expected heterozygosity (He) varied from 0.11 (by CUPVB465) to 0.39 (by CUPVB567x) with an average of 0.22. PIC values ranged from 0.36 (by CUPVB583) to 0.86 (by CUPVB534b) with an average value of 0.64, while Dp varied from 0.54 (by CUPVB567x) to 0.89 (by CUPVB446 and CUPVB630) with an average of 0.74 (). Normally, nSSRs with polymorphism information content (PIC) values > 0.50 are considered as highly informative markers [Citation31].
Genetic similarity coefficients (GS) were obtained with using Dice's coefficient. The GS ranged from 0.08 (between Haj-Naseri and Shahpasand) to 0.93 (between Badami-Kaj and Sirizi) (). The UPGMA method was used for cluster analysis and dendrogram construction. The cophenetic correlation coefficient (CCC) indicated high correlations between the similarity matrix of each marker and the cophenetic matrix obtained from the UPGMA dendrogram. CCC value calculated nSSR was 0.92. The cophenetic correlation coefficient is considered to be a very good representative of the data matrix in the dendrogram if it is 0.90 or greater [Citation32].
Table 3. Genetic similarity matrix among the studied cultivars of P. vera based on nSSR data estimated by Dice's coefficient.
The dendrogram obtained from the nSSR markers by the UPGMA method revealed high genetic variation between the studied cultivars and grouped them into two main clusters (). The first main cluster contained 21 cultivars including Khanjari, Momtaz, Shahpasand, Loko, Nogh, Shahpasand-Kaj, Ghazvini, Rezaee, Sirizi, Amiri, Sifaldini, Ghafoori, Hasanzadeh, Harati, Ebrahimabadi, Mosaabadi, Hatami, Yazdi, Badami-Kaj, Badami-Zoodras and Sarakhs. Khanjari and Badami-Zoodras have high similarities in traits related to fruit (nut and kernel size and colour) and leaf. Sirizi and Badami-Kaj showed high similarity by SSR marker. Also, they have high similarities in morphological traits such as nut shape, kernel color and kernel size.
Figure 1. UPGMA dendrogram produced using Dice's coefficient based on nSSR data in the studied cultivars of P. vera.
The second cluster consisted of 21 genotypes including Aliabadi, Karimi, Ebrahimi, Shahrebabak, Ohadi-Riz, Akbarabadi, Sefid-Pesteh, Ghazvini-Zodras, Hasanzadeh, Ravar, Badami-Zarand, Fandoghi-Riz, Javadaghaee, Shasti, Lahijani, Mohseni, Beheshtabadi, Nasiri, Haj-Naseri, Rizab and Sirjani. Also, they have high similarities in traits related to fruit (nut and kernel size and colour) and leaf. Additionally, Bayesian clustering analysis using STRUCTURE software was performed. The most likely value of K based on the ΔK method in STRUCTURE HARVESTER (as chosen by Evanno's DK method) [Citation28] in Bayesian clustering analysis was two and indicates division of variation into two clusters, indicating the most appropriate two main clusters and confirmed the groupings observed in the UPGMA dendrogram (the first cluster represented by red colour and the second cluster by green colour) (). Phylogenetic analysis using NJ method revealed the evolution of the studied germplasm, in which Haj-Naseri, Sirjani and Nasiri genotypes showed the lowest similarity to their ancestors and thus were the newer genotypes ().
Figure 2. Bayesian clustering analysis (K = 2) based on nSSR data for the studied P. vera germplasm (42 cultivars) performed usingSTRUCTURE.
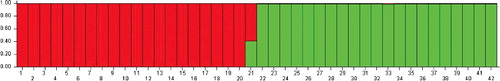
Figure 3. Phylogenetic analysis of the studied cultivars of P. vera based on nSSR polymorphisms using NJ method.
Molecular markers are considered to be versatile tools for studying genetic diversity and variability among different plant species. The major advantage of DNA markers is that they are not affected by environmental conditions [Citation9]. The microsatellites (SSR) are being used widely nowadays for the exploitation of variability among genotypes of different plant species. The selection of a set of highly polymorphic core SSR primers is a crucial step for DNA fingerprinting in cultivar identification. According to the UPOV (International Union for the Protection of New Varieties of Plants, 2010) guidelines [Citation33] for DNA fingerprinting using molecular markers for the protection of plant cultivars, only markers with distinct PCR alleles, high reproducibility and reasonable polymorphism can be selected.
Pistachio has important socio-economic and ecological impacts in the arid and semi-arid agricultural regions of Iran [Citation34]. In addition, Iran hosts a wide genetic diversity of Pistacia spp. and more than 300 pistachio genotypes have been collected across the country. Iran therefore possesses valuable germplasm for pistachio improvement and conservation programs. Assessing genetic diversity and relationships among cultivars of Iranian pistachio, using discriminative and robust markers, is therefore important [Citation34].
In the present work, 42 P. vera cultivars were characterized with 20 nSSR markers. The results confirm the efficiency of microsatellite markers for fingerprinting purposes. Our results demonstrated that the level of detected diversity was high, with an average Na per locus of 5.10, Ne of 1.40, Ho of 0.44, PIC of 0.64, and a Dp of 0.74 for nSSR marker. These values were higher than those reported by Arabnejad et al. [Citation35], who detected an average of 3.69 alleles per primer pairs and an average PIC of 0.46 detected in 20 commercial cultivars of Iranian pistachio; and also higher than those reported by Baghizadeh et al. [Citation36] (an average of 2.75 alleles per primer pairs and an average of 0.44 for detected in 31 Iranian pistachio cultivars) and by Ahmad et al. [Citation14] (an average of 3.30 alleles per locus in 17 pistachio cultivars). Kolahi-Zonoozi [Citation37] assessed genetic diversity of 45 commercially Iranian cultivars using 12 nSSR markers and detected that PIC varied from 0.19–0.56 with an average of 0.33 and the mean of Ho and He were 0.49 and 0.35, respectively. Mirzaei et al. [Citation38] reported 80.00% polymorphism among 22 Iranian pistachio cultivars and wild pistachio species. In a study reported by Golan-Goldhirsh et al. [Citation11] in assessing polymorphisms among 28 Mediterranean pistachio accessions, 27 selected primers produced 259 total bands (an average of 9.59).
Some cultivars in different locations have the same name and some morphological identity, while molecular results showed differences between them. For instance, Badami-Zarand cultivar was differentiated from Badami-Kaj and Badami-Zoodras. Also, Ghazvini-Zodras showed differences with Ghazvini. These differentiations can be due to the intrinsic nature of nSSRs, since it is very unlikely that the microsatellites amplified correspond to the mutated DNA region when they have been randomly isolated from the whole genome. The results from this study showed that the studied cultivars had high genetic variation due to the species’ dioeciously and cross-pollination nature [Citation36].
Conclusions
This study was aimed at evaluating the genetic diversity of Iranian pistachio in order to aid the conservation of its germplasm. The obtained information about the genetic variation between and within different populations will prepare the ground for the formulation of appropriate conservation strategies. The present analysis revealed that Iranian-cultivated pistachio germplasm is highly variable, presumably due to specific local genetic backgrounds, breeding pressure and/or limited interchange of genetic material. The unique nature of the Iranian pistachio germplasm revealed by our results, supports the case for the implementation of more intense characterization, conservation and breeding strategies. Also, the SSR markers used were useful for determination of genetic diversity among pistachio cultivars in Iran.
Acknowledgment
The authors would like to thank Arak University in Iran for its financial support (grant number: 96/5846).
Disclosure statement
None
Additional information
Funding
References
- Zohary M. A monographical study of the genus Pistacia. Palestine J Bot. 1952;5:187–228.
- Zohary D. The genus Pistacia L. In: Padulosi S, Caruso T, Barone E, editors. Taxonomy, distribution, conservation and uses of Pistacia genetic resources. Palermo: International Plant Genetic Resources Institute (IPGRI); 1996. p. 1–11.
- Kafkas S, Özkan H, Ak BE, et al. Detecting NA polymorphism and genetic diversity in a wide pistachio germplasm: comparison of AFLP, ISSR and RAPD markers J Am Soc Hortic Sci. 2006;131:522–529.
- Hosseinifard SJ, Khademi H, Kalbasi M. Different forms of soil potassium as affected by the age of pistachio (Pistacia vera L.) trees in Rafsanjan, Iran Geoderma. 2010;155:289–297.
- FAOSTAT. Agriculture data. Available form: http://faostat.fao.org. 2012.
- Schmutz J, McClean PE, Mamidi S, et al. A reference genome for common bean and genome-wide analysis of dual domestications. Nat Genet. 2014;46:707–713.
- Perdereau AC, Kelleher CT, Douglas GC, et al. High levels of gene flow and genetic diversity in Irish populations of Salix caprea L. inferred from chloroplast and nuclear SSR markers. BMC Plant Bio. 2014;14:202–205.
- Parfitt DA, Badenes ML. Phylogeny of the genus Pistacia as determined from analysis of the chloroplast genome. Proc Natl Acad Sci. 1997;94:7987–7992.
- Gupta M, Chyi YS, Romero-Severson J, et al. Amplification of DNA markers from evolutionarily diverse genomes using single primers of simplesequence repeats. Theor Appl Genet. 1994;89:998–1006.
- Hormaza JI, Dollo L, Polito VS. Identification of RAPD marker linked tosex determination in Pistacia vera using bulked segregant analysis. Theor Appl Genet. 1994;89:9–13.
- Golan-Goldhirsh A, Barazani1 O, Wangl ZS, et al. Genetic relationships among Mediterranean Pistacia species evaluated by RAPD and AFLP markers. Plant Syst Evol. 2004;246:9–18.
- Katsiotis A, Hagidimitriou M, Drossoul A, et al. Genetic relationships among species and cultivars of Pistacia using RAPDs and AFLPs. Euphytica. 2003;132:279–286.
- Ahmad R, Ferguson L, Southwick SM. Analyses of pistachio rootstocks by SSR and SRAP molecular markers. J Hortic Sci Biotechnol. 2005;80:382–386.
- Ahmad R, Ferguson L, Southwick SM. Identification of pistachio (Pistacia vera L.) nuts with microsatellite markers. J Am Soc Hortic Sci. 2003;128:898–903.
- Zaloglu S, Kafkas S, Dogan Y, et al. Development and characterization of SSR markers from pistachio (Pistacia vera L.) and their transferability to eight Pistacia species. Sci Hortic. 2015;189:94–103.
- Toth G, Gáspári Z, Jurka J. Microsatellites in different eukaryotic genomes: survey and analysis. Genome Res. 2000;10:967–981.
- Katti MV, Ranjekar PK, Gupta VS. Differential distribution of simple sequence repeats in eukaryotic genome sequences. Mol Biol Evol. 2001;18:1161–1167.
- Park YJ, Lee JK, Kim NS. Simple sequence repeat polymorphisms (SSRPs) for evaluation of molecular diversity and germplasm classification of minor crops. Mol. 2009;14:4546–4569.
- Khadivi-Khub A, Etemadi-Khah A. Phenotypic diversity and relationships between morphological traits in selected almond (Prunus amygdalus) germplasm. Agroforest Syst. 2015;89:205–216.
- Doyle JJ, Doyle JL. A rapid DNA isolation procedure for small quantities of fresh leaf tissue. Phytochem Bull. 1987;19:11–15.
- Topcu H, Coban N, Kafkas S. Novel microsatellite markers in Pistacia vera L. and theirtransferability across the genus Pistacia. Sci Hortic. 2016;198:91–97.
- Powell W, Morgante M, Andre C, et al. The comparison of RFLP, RAPD, AFLP and SSR (microsatellite) markers for germplasm analysis. Mol Breed. 1996;2:225–238.
- Peakall R, Smouse PE. GenAlEx 6.5: genetic analysis in Excel. Population genetic software for teaching and research-an update. Bioinformatics. 2012;28:2537–2539.
- Rohlf FJ. NTSYS-pc numerical taxonomy and multivariate analysis system. Version 2.1. Setauket: Exeter Software; 2000. p. 3.
- Mantel N. The detection of disease clustering and generalized regression approach. Cancer Res. 1967;27:209–220.
- Pritchard JK, Stephens M, Donnelly P. Inference of population structure using multilocus genotype data. Genetics. 2000;155:945–959.
- Falush D, Stephens M, Pritchard JK. Inference of population structure using multilocus genotype data: dominant markers and null alleles. Mol Ecol Notes. 2007;7:574–578.
- Evanno G, Regnaut S, Goudet J. Detecting the number of clusters of individuals using the software STRUCTURE: a simulation study. Mol Ecol. 2005;14:2611–2620.
- Pavlicek A, Hrda S, Flegr J. FreeTree - Freeware program for construction of phylogenetic trees on the basis of distance data and bootstrap/jackknife analysis of the tree robustness. Folia Biol. 1999;45:97–99.
- Page RDM. TreeView: an application to display phylogenetic trees on personal computers. Comp Appl Biosci. 1996;12:357–358.
- Botstein D, White RL, Skolnick M, et al. Construction of genetic linkage map in man using restriction fragment length polymorphisms. Am J Hum Genet. 1980;32:314–331.
- Romesburg HC. Cluster analysis for researchers. Malabar, FL (USA): Krieger Publishing; 1990.
- UPOV. Guidelines for DNA profiling: molecular marker selection and database construction (BMT guidelines). Geneva (Switzerland): International Union for the Protection of New Varieties of Plants; 2011. Available from:http://www.wipo.int/meetings/en.
- Fadaei H, Sakai T, Torii K. Investigation on pistachio distribution in the mountain regions of northeast Iran by ALOS. Front Agri China. 2011;5:393–399.
- Arabnejad H, Bahar M, Taj A. Genetic diversity of Pistacia khinjuk Stocks by SSR markers. Agri Sci Tech. 2008;12:207–217.
- Baghizadeh A, Noroozi S, Jalali-Javaran M. Study on genetic diversity of some Iranian Pistachio (Pistacia vera L.) cultivars using random amplified polymorphic DNA (RAPD), inter sequence repeat (ISSR) and simple sequence repeat (SSR) markers: A comparative study. Afr J Biotech. 2010;9:7632–7640.
- Kolahi-Zonoozi SH, Mardi M, Zeinalabedini M, et al. Development of 12 new SSR markers for genetic diversity and structure analysis in pistachio (Pistacia vera L.) J Hort Sci Biotech. 2014;89:707–711.
- Mirzaei S, Bahar M, Sharifnabi B. A phylogenetic study of Iranian wild pistachio species and some cultivars using RAPD markers. Acta Hort. 2005;726:39–43.