
 ?Mathematical formulae have been encoded as MathML and are displayed in this HTML version using MathJax in order to improve their display. Uncheck the box to turn MathJax off. This feature requires Javascript. Click on a formula to zoom.
ABSTRACT
Most research on the relationship between driver fatigue, driving comfort, stability and other factors related to driving has consisted subjective assessments via surveys. Bio-signal measurements allow more objective evaluations but the measurement processes and types are very complicated, and measurement signals are sensitive to noise. To address this issue, this paper attempts to quantify driver fatigue by measuring and analyzing hemodynamic responses with near-infrared spectroscopy. The oxygen concentration changes in the erector spinae muscle were measured for the same subjects when driving a vehicle on a highway for a long time, in one of two driving postures: posture A based on the seat status of the average male body type in South Korea (a 107.7° torso angle, 109.1° chair back angle and 561.0 mm seat x-axis position posture) and Posture B with the chair back angle adjusted by −10° from posture A and the seat moved 4 cm back. A survey was carried out on the degree of lumbar discomfort. The analysis of the degree of relative fatigue, based on driver posture utilizing a mathematical model for the physiological system of lower-back fatigue, showed that posture B is relatively uncomfortable compared to posture A by approximately 41%. The results of analyzing the degree of relative discomfort with regard to driver posture using a mathematical model allow the verification that interpreting the relative degree of discomfort based on the changes in the oxygen concentration at a particular time is possible, and the experimental results show the usefulness of the proposed method.
Introduction
The recent paradigm of car driver convenience technology is switching from the pursuit of convenience and economic benefit to that of amenities which ensure sensitivity, aesthetics and similar factors, such as congeniality, pleasure and comfort. In particular, the seat very directly affects driver comfort and could thus alter the driving experience with regard to ride comfort, having a negative influence on safety, as driver displeasure would increase and the driver's emotional stability could be compromised, which may eventually cause the driver to distrust the car brand and maker.
With regard to research on the relationship between driver fatigue, driver comfort and stability, among other factors, subjective evaluation methods such as questionnaires are now being universally performed, and many researchers attempt to evaluate these more objectively for better fatigue analyses using bio-signals, such as electromyogram (EMG), electrocardiogram (ECG), electroencephalogram (EEG) and oxygen saturation levels [Citation1]. Fatigue analysis utilizing EMG is most often studied while making use of features such as the root mean square (RMS), median frequency (MF), mean power frequency (MPF) and maximum voluntary contraction (MVC) [Citation1–10].
Near-infrared spectroscopy (NIRS) is a very good means of measuring hemodynamic responses, and measurements can be conducted during the volitional movement of people, since it is strong with regard to movement noise and physiological noise (e.g. respiration, pulse), which are utilized for diverse purposes. NIRS measurement technology, referring to measurements of cerebral cortex activation, has been developed to such an extent that it can replace magnetic resonance imaging, and given that it is being utilized in research to analyze hemodynamic behaviour in the peripheral nervous system, it can also be applied to the skin. The fatigue analysis methods using NIRS are mainly characterized by variations in the values of oxyhemoglobin (O2Hb), de-oxyhemoglobin (HHR) and oxymyoglobin (O2Mb) [Citation11–14].
The existing research analyzes muscle fatigue in relation to movement, such as isometric and isotonic contractions. Studies analyzing fatigue while driving have mostly been conducted in a simulated environment. Lower-back fatigue while driving is considered to be different from muscle fatigue from exercising, and simulation environment–based research has a shortcoming in that different results can arise when applied to an actual environment, as certain phenomena that could occur due to the influence of an actual environment are not considered [Citation14–23]. In addition, as bio-signal measurement and monitoring were conducted intermittently or only before and after driving, rather than being performed continuously from the time before starting to drive to after finishing driving, fatigue analysis while driving has been performed incorrectly; in particular, there has been major problems with NIRS signals when used to measure variations in the values of the relative oxygen saturation concentration [Citation24].
In this paper, we quantify driver fatigue using analysed hemodynamic responses by conducting driving in an actual road environment over a long time, with NIRS signals continuously measured from before driving to after driving. Thus, we assessed the lower-back fatigue experienced by drivers. In addition, as the sensors used in the measurement were portable and sufficiently small, they were able to minimize the physical burden on the drivers during the bio-signal measurement process, and because the cohesion time was shorter, the bio-signals could be measured without a cognitive load. The interpretation method to assess the relative discomfort and the discomfort time for each driving posture through measurements of the hemodynamic responses signals will be discussed in the next chapter.
Subjects and methods
The purpose of this study is to present methods for quantitatively estimating driver fatigue while also attempting to confirm the usefulness of the proposed methods both quantitatively and qualitatively by observing the oxygen saturation concentration of hemoglobin within the blood vessels in a driver's back (including the lower back) while driving for a long period. A driver fatigue index will be devised by conducting a practical car test aimed at regular people and a questionnaire survey will be utilized.
Experimental design and procedures
Nine able-bodied male adults (average age: 28.4 years) participated in this study to investigate the changes in the oxygen saturation concentration while driving for a long time, and two persons (average age: 34 years) participated in the relative comfort examination according to the body posture.
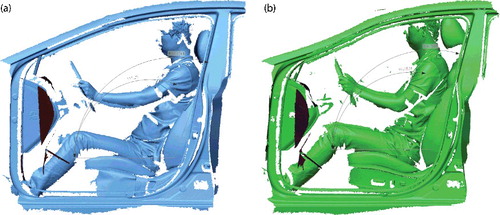
NIRS measurements and surveys were carried out by utilizing an Avante MD (Hyundai Motors) for the lower-back fatigue prediction experiment with oxygen concentration observations while the driver drove for a prolonged period of time (90 min). The driver's seat status was based on the seat status of the average male body type in South Korea (posture A): a 107.7° torso angle, 109.1° chair back angle, and 561.0 mm seat x-axis position posture. Posture B had the chair back angle adjusted by −10° from posture A, and the seat was moved 4 cm back. (a,b) shows the examples created with a 3D scanner that were measured for the two driver postures.
Figure 1. Example of driver postures while driving for a long time: Posture A (a); Posture B (b).
Data collection
Selection of bio-signal measurement locations
Muscle fibers are largely divided into two types: the slow twitch and the fast twitch types. A representative slow twitch muscle is the erector spinae muscle, while the biceps are typical fast twitch muscle fibers. As shown in , in the glycolytic and aerobic characteristics, a ‘glycolytic’ process is when a muscle needs energy and when sugar is directly degraded and used. An ‘aerobic’ process is when mitochondria generate energy by utilizing oxygen. Given the many mitochondria, higher myoglobin rate and greater oxidative phosphorylation ability of the erector spinae muscle, the NIRS device for oxygen saturation could also measure the hemodynamic response [Citation25]. Therefore, this paper measured changes in the state of hemoglobin in the erector spinae muscle as a means by which to measure lower back fatigue.
Table 1. Characteristics of muscle fiber types.
NIRS data measurement
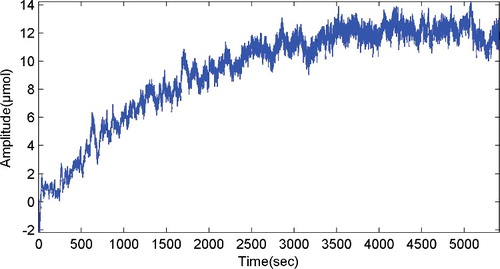
Hemodynamic measurements were conducted by a CW (continuous wave)-type NIRS system with two wavelengths of emitting light (PortaLite, Artnis medical system, the Netherlands). The optode has three pairs of light sources (transmitters, Tx) and photodetector (receiver, Rx), with the distance between the sources and the detector measuring 30, 35 and 40 mm. The light sources consist of three LEDs each emitting two wavelengths (760 and 850 nm; sampling rate = 10 Hz). The optode was connected to a computer through Bluetooth, and measurement data were processed using Oxysoft (http://www.artinis.com/oxysoft/). NIRS measurement sensors were attached to the center of the erector spinae at the level of L3 to measure the degree of lower-back fatigue (Probe size: 58 × 28 × 6 mm, Length x Width x Height). Our NIRS recording techniques procedures have been described fully elsewhere [Citation11–14]. The attenuated light strength corresponding to the variation in the oxygen concentration in the hemoglobin and myoglobin existing in the blood vessels, and muscles in the lower back can be measured by receivers. At this point, the relationship between the emitted light strength and the attenuated light strength is represented as a function of the oxygen concentration variation, and the continuous oxygen concentration variation could therefore be calculated mathematically with the modified Lambert-Beer (MLB) law [Citation26]. During a prolonged drive, the variation in the oxygen concentration was measured and calculated using the sensor installed in the lower-back area (erector spinae) in the manner shown in .
Figure 2. Oxygen concentration variation curve for the driver's lower back.
Survey
Referring to the evaluation values of Hirao et al. [Citation27] for physical discomfort, discomfort measurements (0–5) of eight physical body parts (neck, shoulder, back, lumbar, arm, buttock, ankle and knee) were made while the operator rode with the driver, taking the measurements at 10-min intervals while the driver was driving.
Driving posture
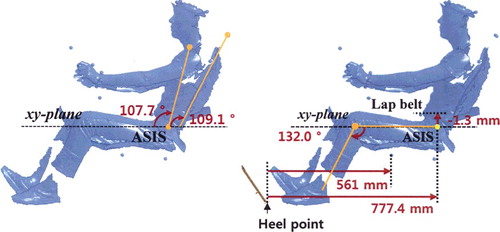
The driver's posture was based on the seating status of the average male body shape in South Korea (107.7° torso angle, 109.1° chair back angle, and 56.1 mm seat x-axis location), and the driver's posture before driving was measured using a 3D scanner (Artec Eva). presents the angle measurement result of the seating status as analyzed by utilizing Artec 3D Studio. Regarding the torso angle, the anterior superior iliac spine (ASIS) was adopted as the reference point, the angle between the x–y plane and the shoulder joint was measured, and the angle between the x–y plane and the back frame of the seat was measured with regard to the angle of the back of the chair. Regarding the distance to the driver's seat, the distance between the end of the footrest (heel point) and the point corresponding to the driver's ASIS was measured based on the x–y plane.
Figure 3. Driver's posture based on the seating status.
Data analysis
Spectral edge frequency (SEF)
In this paper, a SEF analysis using NIRS signals was implemented to analyze the relative discomfort of drivers while driving for a long period of time. In SEF, to quantify the variation in the power spectrum distribution to compute the SEF90 value, the frequency value corresponding to 90% of the cumulative power value was confirmed after calculating the cumulative power distribution normalized with the power spectrum [Citation28]. SEF90 was calculated by measuring the FFT at five-minute intervals with the NIRS data measured during long driving and the relative discomfort was analyzed in three ways.
In SEF90avg, after computing the mean of SEF90, which was calculated at 5-minute intervals, the analysis began by finding the time point at which the value of SEF90 became lower than the average value, after which the relative discomfort was analyzed in accordance with the postures. In SEF90Freq, the value of the time point that could be statistically distinguished best was determined (the lowest level for significance probability) from among the reference values, which had decreased from the reference by −0.01 Hz for the SEF90 value at the time point of 0–5 min, the relative discomfort was analyzed with this as the starting point. At SEF90Time, based on the SEF90 value in accordance with time, the value of the time point that could be statistically distinguished best was determined (the lowest point for significance probability), and the analysis of the relative discomfort started with this.
Time constant
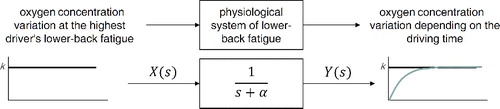
A mathematical model of lower-back fatigue can be formulated from the measured oxygen concentration variation curve. This curve can be approximated with the step response of the primary system [Citation29]. At this point, the value of the reference step input can be defined as the normal state value of the oxygen concentration variation; i.e. assuming that the oxygen concentration variation is highest when the driver's physiological lower-back fatigue is maximized, this value would be the reference step input value of the lower-back fatigue system. The oxygen concentration variation would increase when the lower back becomes tired over time upon driving. When the oxygen concentration variation reaches a specific level, the physiological lower-back fatigue is maximized. This can be expressed mathematically as shown in .
Figure 4. Mathematical model of lower-back fatigue.
To analyze the relative discomfort, the time constant was utilized, and the oxygen concentration variations (Time constantT1)/energy consumption (Time constantarea) corresponding to the time constant for the specific postures were determined as the reference values. The relative discomfort was then analyzed based on the driver's posture using the determined reference values.
The time response of the lower-back fatigue physiological system in is induced with the following formula:(1)
(1)
The time constant of the system, T = 1/α, can be calculated by utilizing the feature value α of the lower-back fatigue physiological system from Formula 1, which can also serve as the value representing the driver's lower-back fatigue in the lower-back fatigue physiological system. The time constant physically features the response speed in the system, referring to the time when the variation of the output signal reaches 63.2% of the normal status [Citation29]. Thus, the time constant value can be utilized as the basis for estimating the relative fatigue time in the variation curves of oxygen concentration.
Statistical analyses
The statistical analysis was implemented using SPSS (IBM SPSS Statistics 21) after a data-coding process for the questionnaire and the measured NIRS data when driving over time. To analyze the relationships between the questionnaire written by the subjects and the NIRS data (O2Hb, HHb and tHb), a Spearman correlation analysis was carried out.
To analyze the discomfort time when driving for a long time, the Mann–Whitney U test [Citation30] was implemented after classifying the values of SEF90avg and SEF90Freq according to their size and then dividing them into the data in the comfortable and uncomfortable sections or after sorting them into the comfortable and uncomfortable sections before and after the time corresponding to the time constant using the SEF90Time value.
To analyze the reliability of the analyzed data, the degree of consistency was assessed via an intraclass correlation coefficient (ICC) analysis between the SEF90 value calculated while driving over time and the survey results completed by the subjects while driving.
Results and discussion
Results of driving on highway for a long time
According to Ferrari et al. [Citation31], so far, different NIRS techniques (e.g. continuous-wave and spatially, time- and frequency-resolved spectroscopy) have been used for measuring muscle oxygenation during exercise. At the same time, Jones et al. [Citation32], and Bossie et al. [Citation33] reported that CW NIRS is a non-invasive, portable and relatively cheap way to measure local skeletal muscle O2 utilisation and delivery, which are both important determinants of functional capacity in exercising muscle. This provides the means to investigate pathophysiological mechanisms that limit exercise capacity as well as mechanisms of benefit resulting from exercise intervention [Citation32]. Similar to earlier studies, we quantified the driver fatigue using measured hemodynamic responses by CW NIRS.
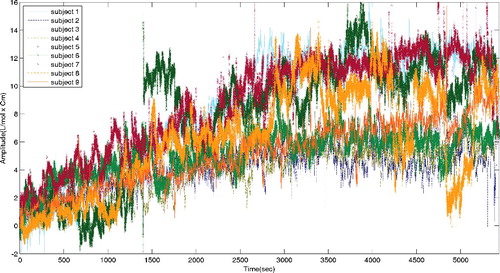
While driving for a long time, though the variation in the oxygen concentration may be constantly increasing, it reaches a specific level. At this point, the oxygen concentration variation curve can differ based on the driver and their posture. shows the oxygen concentration variation when nine drivers drove the same vehicle on a highway in the same posture for 90 min. The oxygen concentration variation curve trends for all of the drivers’ driving times were similar ,while the degrees of variation in the oxygen concentration and the times required to reach a normal state differed. Through this study, the relative levels of lower-back discomfort for drivers in the same car can be estimated.
Figure 5. Oxygen concentration variation curve for the drivers in this study.
As shown in , Spearman correlation analysis was conducted to investigate the correlation between the fatigue survey results as measured on a five-point Likert scale when performing the long-distance driving experiment and the NIRS data measured while driving. The data were from the seven O2Hb subjects, the three HHb subjects and the six tHb subjects. The findings were statistically significant (p < 0.05). The correlation coefficient exceeded 0.7, thus showing a strong correlation [Citation34].
Table 2. Result of the Spearman correlation analysis to investigate the correlation between the fatigue survey results and the NIRS signal results.
To analyze the fatigue time using SEF90avg, SEF90Freq and SEF90Time, the time at which the approximate significance probability was lowest was presumed to be the fatigue time are shown in . As a result of this analysis, the fatigue time was 20–40 min when it was based on SEF90avg, 20–50 min when based on SEF90Freq, and 15–45 min when based on SEF90Time, showing that it was difficult to find the fatigue time point.
Table 3. Results for the discomfort time point with the SEF90 value while driving for a long time.
However, as a result of the ICC statistical analysis, the discomfort time point from the data whose reliability exceeded 70% was 30–40 min when it was based on SEF90avg, 30–50 min when based on SEF90Freq, 30–45 min when based on SEF90Time, and 24–56 min when based on the time constant. This indicated that the fatigue time point for Posture A for the nine subjects could be presumed to be 30–40 min. This study is in agreement with Morita et al. [Citation35], who show that ΔHb after motion may be used as an indicator of skeletal muscle fatigue after motion which is difficult to observe by EMG.
Driving results in relation to posture
The proposed method validated that the relative lower-back discomfort degree for the drivers may be estimated from oxygen saturation analysis, and that it was statistically significant. Based on these results, we analyzed the relative lower-back fatigue in relation to the different postures for two drivers because the method of analysis using NIRS signals was statistically significant.
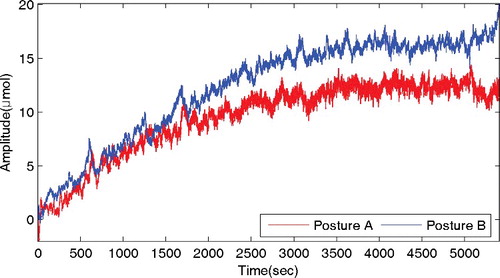
shows the oxygen concentration variation curve when the same driver (subject 10) drives in different postures. As confirmed earlier, there were differences in the degree of the oxygen concentration variation or the time to reach the normal condition; hence, based on the postures, it was expected that the relative lower-back fatigue in relation to the different postures could be estimated.
Figure 6. Oxygen concentration variation curve based on the driver's posture.
To analyze the relative discomfort time point based on the driver's postures using SEF90, the differences at the time points when the approximate significance probability was lowest were compared through Mann–Whitney U examination. As a result of analyzing the relative discomfort based on the values of SEF90avg, SEF90Freq and SEF90Time, it appeared that the discomfort time points of both participants were later for Posture B than they were for Posture A.
shows the results for the discomfort time points on the SEF90 value based on the driver's posture. As a result of analyzing the relative discomfort using the different values of SEF90 before and after driving (init–final) and the differences between the max–min values of SEF 90 while driving, Subject 10 (S10) showed a greater difference for Posture B than for Posture A, while Subject 11 (S11) showed a greater difference for Posture A than for Posture B. The analysis of relative discomfort based on the postures featured by SEF90 did not show consistency, meaning that this measure is inappropriate as reference for confirming discomfort.
Table 4. Results for the discomfort time points on the SEF90 value based on the driver's posture.
shows the mathematical models for lower-back fatigue based on the oxygen concentration variation for Postures A and B in . The information pertaining to the models for each posture by subject 10 (S10) is shown in .
Figure 7. Mathematical model of lower-back fatigue based on the driver's posture (Time constantT1).
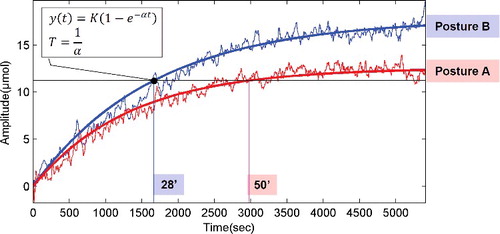
Table 5. Information pertaining to the mathematical model on lower-back fatigue (subject 10).
The comparison of the K values in shows that Posture B is relatively more tiring (by 41%) than Posture A. When setting the oxygen concentration variation at the time point corresponding to the time constant (T) of Posture B as the fatigue reference of Posture B, it can be presumed that the point in Posture A with the same degree of oxygen concentration variation as that in Posture B may have the same fatigue degree as Posture B. Therefore, lower-back fatigue in Posture A is likely to start 22 min later than that in Posture B ().
Table 6. Relative discomfort times in each posture for subject 10 (Time constantT1).
presents the mathematical models of lower-back fatigue based on the energy consumption for Postures A and B in , which shows the relative fatigue time point of Posture B based on the energy consumption of the time position corresponding to the time constant (T) of Position A.
Figure 8. Mathematical model of lower-back fatigue based on the driver's posture (Time constantarea).
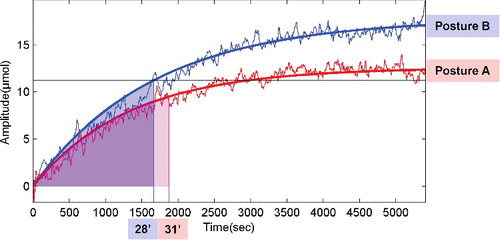
As the area of the oxygen concentration variation curve represents the total amount of oxygen consumed in the blood vessels and muscles while driving, it can be assumed to be the energy involved in lower-back fatigue. Hence, the area of the oxygen concentration variation curve (Σ) from the time driving started to the time point of the time constant of Position B (TB) may be the amount of corresponding metabolic energy consumption. The time point of Posture A with the same area amount as this based on the area of oxygen concentration variation at TB can be specified. Accordingly, it can be stated that lower-back fatigue in Posture A may start three minutes later than that in Posture B ().
Table 7. Times of relative discomfort in each posture for subject 10 (Time constantarea).
The results of analyzing the relative discomfort time points related to the drivers’ postures by utilizing the time constant are shown in . As a result of analyzing the relative discomfort time point based on the time constantT1, it was found that in Subject 10, discomfort appeared after 50 min in Posture A and 28 min in Posture B. In the follow-up interviews, the results coincided with the opinion that subject 10 (S10) would feel discomfort earlier in Posture B.
Table 8. Result of the relative discomfort time points on drivers’ postures.
In Subject 11, the discomfort time point appeared after 15 min in Posture A and 42 min in Posture B. In the follow-up interviews, the results coinciding with the opinion that subject 11 (S11) would feel discomfort earlier in Position A were identified.
As a result of analyzing the relative discomfort time point based on time constantarea, in Subject 10, the degree of discomfort arose after 31 min in Posture A and 28 min in Posture B. This allows the confirmation that the discomfort time point appeared earlier, as it was expected that the discomfort degree may be greater. In Subject 11, the discomfort time point appeared after 27 min in Posture A and 42 min in Posture B, and as with the result of the time constantT1, it was identified that the fatigue time point in Position A, which was a more uncomfortable position for this subject, was the earliest.
It can be seen that the earlier discomfort with the two driving postures is different depending on the driver. The results of the follow-up interviews and the analysis of NIRS signals were confirmed to be consistent. These results presumably indicate that the comfortable posture for each subject depends on the difference in the daily driving posture. Subject 10 (S10) felt greater discomfort in Posture B than in Posture A, whereas Subject 11 (S11) felt greater discomfort in Posture A than in Posture B. Therefore, we expect an objective fatigue assessment to be possible through NIRS signals analysis instead of using the subjective evaluation methods such as questionnaires.
We suggest that, as these interpretation methods for the relative discomfort and discomfort time point for each driving posture are based on data measured on an actual road and not in a simulation environment, they can be immediately applied in the field. In addition, bio-signal measurements are simple when using a portable near-infrared spectroscopy device in that such a device is less sensitive to noise from the surrounding environment compared to other bio-signal devices (e.g. EMG, EEG). Hence, it has potentially high usability and availability.
There are, however, some limitations to be considered for further work. The participants were rather small not to confirm the statistical evaluation of the mathematical model of lower-back fatigue. It is thought that an improvement of the model will be necessary through verification of the biophysical and physiological validity of the discomfort model by conducting an experiment with a larger number of subjects for interpretation research on the relative degree of discomfort and the discomfort time point for each driving posture and between different vehicles.
Conclusions
In this paper, a correlation between hemodynamic responses and fatigue was analyzed to establish the degree of driver fatigue experimentally when driving for a long time. The relative discomfort based on different driver postures was analyzed. As a result of the analysis, in the O2Hb signals, the highest positive correlation was observed, and in the data for which the reliability exceeded 70%, the fatigue time point of Posture A could be presumed to be 30–40 min. Analyzing the driver's postures using the time constant confirmed that the interpretation of the relative discomfort time point could be done based on the variation in the oxygen concentration at a specific time point. An interpretation of the relative discomfort time point was also possible based on the energy consumption in specific sectors. The existing methods to evaluate the degree of fatigue are subjective assessments, in which the differences appear in the evaluation results as the driving time increases. However, as the proposed method utilizes the change in the blood oxygen concentration, it is an objective assessment method, which increases the reliability and efficiency of driver fatigue assessments. Furthermore, with mathematical models of the lower-back fatigue physiological system, the relative fatigue degree and fatigue time point for each driving posture/vehicle type/driver could be estimated, and considering the differences in system models, time delays and other factors depending on the type of oxygen concentration variation curve, the system could be determined.
Acknowledgement
This work was supported by the DGIST R&D Program of the Ministry of Science, ICT and Future Planning under Grant 18–IT–02; HMC (Hyundai Motor Company).
Disclosure statement
No potential conflict of interest was reported by the authors.
Additional information
Funding
References
- Lindstrom L, Magnusson R, Petersen I. Muscular fatigue and action potential conduction velocity changes studied with frequency analysis of EMG signals. Electromyography. 1970;10(4):341–356.
- Lindstrom L, Kadefors R, Petersen I. An electromyographic index for localized muscle fatigue. J Appl Physiol. 1977;43(4):750–754.
- Mayer TG, Kondraske G, Mooney V, et al. Lumbar myoelectric spectral analysis for endurance assessment: a comparison of normals with deconditioned patients. Spine. 1989;14(9):986–991.
- Moritani T, Muro M, Takaishi T. Electromyographic analysis of low back pain. J Sport Med Sci. 1989;3:11–19.
- Roy SH, Luca CJD, Casavant DA. Lumbar muscle fatigue and chronic lower back pain. Spine. 1989;14(9):992–1001.
- Moritani T, Oda S, Shibata M, et al. Myoelectric signal characteristics in lumbar back muscle fatigue among adult males, females and pre-puberty boys. J Sports Med Sci. 1991;5(1):13–21.
- Bonato P, Roy SH, Knaflitz M, et al. Time-frequency parameters of the surface myoelectric signal for assessing muscle fatigue during cyclic dynamic contractions. IEEE T Bio-Med Eng. 2001;48(7):745–753.
- Oliveira CG de, Nadal J. Back muscle EMG of helicopter pilots in flight: effects of fatigue, vibration, and posture. Aviat Space Envir MD. 2004;75(4):317–322.
- Hostens I, Ramon H. Assessment of muscle fatigue in low level monotonous task performance during car driving. J Electromyogr Kines. 2005;15(3):266–274.
- Chen C, Cheng B, Wang Z, et al. Back muscle activity while operating a vehicle. in SAE-China, FISITA. Proceedings of the FISITA 2012 World Automotive Congress. 27th–30th Nov and Beijing, China. Berlin: Springer; 2013.
- Ferrari M, Mottola L, Quaresima V. Principles, techniques, and limitations of near infrared spectroscopy. Can J Appl Physiol. 2004;29(4):463–487.
- Vedsted P, Blangsted AK, Søgaard K, et al. Muscle tissue oxygenation, pressure, electrical, and mechanical responses during dynamic and static voluntary contractions. Eur J Appl Physiol. 2006;96(2):165–177.
- Yang G, Chany A-M, Parakkat J, et al. The effects of work experience, lift frequency and exposure duration on low back muscle oxygenation. Clin Biomech. 2007;22(1):21–27.
- Yoshitake Y, Ue H, Miyazaki M, et al. Assessment of lower-back muscle fatigue using electromyography, mechanomyography, and near-infrared spectroscopy. Eur J Appl Physiol. 2001;84(3):174–179.
- McGill SM, Hughson RL, Parks K. Lumbar erector spinae oxygenation during prolonged contractions: implications for prolonged work. Ergonomics. 2000;43(4):486–493.
- Albert WJ, Sleivert GG, Neary JP, et al. Monitoring individual erector spinae fatigue responses using electromyography and near infrared spectroscopy. Can J Appl Physiol. 2004;29(4):363–378.
- Blangsted A, Vedsted P, Sjøgaard G, et al. Intramuscular pressure and tissue oxygenation during low-force static contraction do not underlie muscle fatigue. Acta Physiol Scand. 2005;183(4):379–388.
- Kramer M, Dehner C, Hartwig E, et al. Intramuscular pressure, tissue oxygenation and EMG fatigue measured during isometric fatigue-inducing contraction of the multifidus muscle. Eur Spine J. 2005;14(6):578–585.
- van Dieën JH, Westebring-van der Putten EP, Kingma I, et al. Low-level activity of the trunk extensor muscles causes electromyographic manifestations of fatigue in absence of decreased oxygenation. J Electromyogr Kines. 2009;19(3):398–406.
- Lin J-H, Maikala RV, McGorry R, et al. NIRS application in evaluating threaded-fastener driving assembly tasks. Int J Ind Ergonom. 2010;40(2):146–152.
- Perrey S, Thedon T, Rupp T. NIRS in ergonomics: its application in industry for promotion of health and human performance at work. Int J Ind Ergonom. 2010;40(2):185–189.
- Taelman J, Vanderhaegen J, Robijns M, et al. Estimation of muscle fatigue using surface electromyography and near-infrared spectroscopy. In: LaManna J, Puchowicz M, Xu K, Harrison D, Bruley D. editors. Oxygen transport to tissue XXXII. Boston, MA: Springer; 2011. p. 353–359. ( Advances in Experimental Medicine and Biology, vol 701).
- Ferguson SA, Allread WG, Le P, et al. Shoulder muscle fatigue during repetitive tasks as measured by electromyography and near-infrared spectroscopy. Hum Factors. 2013;55(6):1077–1087.
- Callaghan JP, Gregory DE, Durkin JL. Do NIRS measures relate to subjective low back discomfort during sedentary tasks?. Int J Ind Ergonom. 2010;40(2):165–170.
- Brooke MH, Kaiser KK. Muscle fiber types: how many and what kind?. Arch Neurol. 1970;23(4):369–379.
- Jobsis FF. Noninvasive, infrared monitoring of cerebral and myocardial oxygen sufficiency and circulatory parameters. Science. 1977;198(4323):1264–1267.
- Hirao A, Kato K, Kitazaki S, et al. Evaluations of physical fatigue during long-term driving with a new driving posture. SAE Technical Paper; 2007.
- Drummond J, Brann C, Perkins D, et al. A comparison of median frequency, spectral edge frequency, a frequency band power ratio, total power, and dominance shift in the determination of depth of anesthesia. Acta Anaesthesiol Scand. 1991;35(8):693–699.
- Lipták BG. Instrument engineers' Handbook, volume two: process control and optimization. Boca Raton, FL: Taylor & Francis Group CRC Press; 2005.
- Corder GW, Foreman DI. Nonparametric statistics: a step-by-step approach. New Jersey: John Wiley & Sons; 2014.
- Ferrari M, Muthalib M, Quaresima V. The use of near-infrared spectroscopy in understanding skeletal muscle physiology: recent developments. Phil Trans R Soc A. 2011;369(1955):4577–4590.
- Jones S, Chiesa ST, Chaturvedi N, et al. Recent developments in near-infrared spectroscopy (NIRS) for the assessment of local skeletal muscle microvascular function and capacity to utilise oxygen. Artery Research. 2016;16:25–33.
- Bossie HM, Willingham TB, Schoick RAV, et al. Mitochondrial capacity, muscle endurance, and low energy in friedreich ataxia. Muscle Nerve. 2017;55(4):773–779.
- Wuensch KL. Straightforward Statistics for the Behavioral Sciences. J Am Stat Assoc. 1996;91(436):1750–1752.
- Morita M, Muramatsu Y, Kobayashi H. Quantitative evaluation of skeletal muscle fatigue in isometric contraction by near-infrared spectroscopy and electromyogram. Physiotherapy. 2015;101:eS1035–eS1035 .