
ABSTRACT
Gamma-aminobutyric acid (GABA) can be converted into 2-pyrrolidone, an intermediate in the synthesis of nylon 4 and agrochemicals, which has great potential for application in the chemical industry. The main aim of this work was to construct a simple and efficient process for industrial production of GABA from L-glutamic acid (L-Glu) by whole-cell bioconversion. The gene encoding glutamate decarboxylase (GAD) from Lactococcus lactis FJNUGA01 was overexpressed using the most available vector in Escherichia coli, pET-28a. GABA production was enhanced by optimizing the concentration of the catalyst isopropyl-β-D-thiogalactoside (IPTG), induction temperature and induction time. After optimization, GABA production reached 98.4 g L−1 with 96 mol% conversion within 6 h was achieved by whole-cell conversion using the cells induced with 1 mmol L−1 IPTG for 12 h at 30 °C. Furthermore, when the initial concentration of L-Glu was adjusted, 204.12 g L−1 GABA with 34 g L−1 h−1 productivity was reached using 2 mol L−1 L-Glu as the substrate. During the 6 h whole-cell bioconversion process, almost all L-Glu was converted to GABA with a conversion efficiency of ∼99%. The high conversion efficiency and high productivity made the GABA purification occur downstream, and the whole process is more simple and economical for industrial application.
Introduction
Gamma-aminobutyric acid (GABA) is a four-carbon free amino acid widely found in bacteria, plants and animals [Citation1]. In mammals, GABA is an inhibitory neurotransmitter with multiple uses, such as in blood pressure reduction, treatment of epilepsy and treatments for anxiety and depression, and is widely used in pharmaceuticals and functional foods [Citation2]. In the chemical industry, GABA can be converted into 2-pyrrolidone, which is an important monomer for nylon 4 with excellent mechanical properties and thermal properties [Citation3]. Compared to the small market in the fields of food and medicine, GABA has great potential for application in the chemical industry.
GABA is mainly produced by chemical synthesis or biosynthesis. The latter is preferred due to its high catalytic efficiency, mild conditions, environmental friendliness and low cost [Citation4]. So far, natural or recombinant microbes have been studied by direct fermentation to produce GABA: among them, lactic acid bacteria (LAB) recognized as safe strains have strong GABA production capacity [Citation5]. Isolated in natural lactic acid fermented foods such as Lactobacillus brevis NCL912, which was separated from kimchi, was capable of generating 103.5 g L−1 GABA by fermentation fed with 575 g glutamate within 36 h [Citation6]. Another good candidate for GABA production by LAB, L. buchneri WPZ001, isolated from Chinese fermented sausages, produces 70 g L−1 GABA in flask fermentations with xylose as the sole carbon source [Citation7]. Meanwhile, another safe microorganism, Corynebacterium glutamicum, which could reduce precursor costs and simplify production processes, is considered as a promising candidate for direct biosynthesis of GABA [Citation8]. When Shi et al. [Citation9] overexpressed two GadB proteins from Lb. brevis Lb85 in C. glutamicum, GABA production reached 26.32 g L−1 in 60 h by fed-batch fermentation. The overexpression of the phosphoenolpyruvate carboxylase-encoding gene or/and deletion of the malate dehydrogenase-encoding gene will further increase GABA production in C. glutamicum [Citation10]. Moreover, Zhang et al. [Citation11] produced 70.6 g L−1 GABA after 70 h fermentation without exogenous supplementation of the expensive PLP cofactor by developing an efficient direct biosynthesis route from glucose. In addition, Pham et al. [Citation12,Citation13] introduced the GABA pathway or GABA shunt enzymes by using synthetic scaffolds to produce GABA from glucose in E.coli; however, only 0.8–1.3 g L−1 GABA was obtained from 10 g L−1 of glucose. A recent study reported that 3.95 g L−1 GABA in flask cultivation was produced using xylose as the sole carbon source in E. coli [Citation14]. Because the downstream separation and purification was complex, the direct fermentation process was not suitable for industrial GABA production.
Currently, researchers produce GABA by purification or immobilization of glutamate decarboxylase (GAD) using monosodium glutamate (MSG) or glutamate (Glu) as the substrates [Citation4,Citation15–18]. When Glu was used instead of MSG, the production of GABA was significantly improved [Citation19]. Lammens et al. [Citation4] applied immobilized natural GadB from E. coli in a buffer-free system, which resulted in an average volumetric productivity of 35 kg m−3 h−1 GABA. Kang et al. [Citation17] used an engineered GAD from E. coli in the buffer-free reaction, and 1 mol L−1 GABA was produced in 3 h with a space-time yield of 34.3 g L−1 h−1. Lee et al. [Citation18] applied his-tag mediated immobilization of GADs to produce GABA, as a result, 223.8 g L−1 GABA was obtained in a 1 L reactor within 100 min, and 97.8% GABA from 50 mmol L−1 L-glutamate was achieved in a packed-bed bioreactor [Citation20,Citation21]. However, the enzyme purification and immobilization undoubtedly made the production process more complex and resulted in higher production costs. Recently, whole-cell bioconversion has become more popular due to its easily controlled catalytic process, high efficiency and simple downstream purification [Citation19,Citation22,Citation23]. Plokhov et al. [Citation24] used a recombinant E. coli strain as a whole-cell biocatalyst, and 138 g GABA was achieved from 200 g L-Glu at a conversion yield of 98.5%; Yamano et al. [Citation23] used E. coli NBRC 3806 as a whole-cell biocatalyst, and 303.7 g GABA was produced from 560 g of L-Glu via repeating 14 times. Ke et al. [Citation25] applied crude L-Glu as the substrate for GABA whole-cell bioconversion, and 614.15 g L−1 GABA with a molar yield over 99% was achieved by recombinant E. coli reused for three cycles. In addition, Lactobacillus brevis TCCC 13 007 cells could also be used as the whole-cell catalyst, resulting in 201.18 g L−1 GABA with 99.4mol% by 10 h bioconversion [Citation26].
In this study, we overexpressed an original GAD gene directly from the GABA-producer Lactococcus lactis FJNUGA01 in E. coli using the most available pET-28a vector. A series of factors such as IPTG concentration, induction temperature and induction time were optimized to acquire the appropriate GAD expression. Among them, the induction temperature was the key factor for GABA production, but not for soluble GAD expression. GABA production of 98.4 g L−1 was achieved with a 96 mol% conversion yield using the whole-cell bioconversion after optimization. Next, 2 mol L−1 L-Glu was selected as the initial substrate concentration for GABA production because it provided the highest productivity and almost 100% conversion efficiency. The entire system presented here offers a simple and accessible process for the industrial production of GABA from L-Glu.
Materials and methods
Bacterial strains and culture conditions
The strains used were Lactococcus lactis FJNUGA01, E. coli DH5a and E. coli BL21 harbouring a lambda derivative, DE3. pET-28a (Novagen, Madison, WI, USA) was used for overexpression of gadB from L. lactis FJNUGA01 in E. coli BL21 (DE3). L. lactis FJNUGA01 was cultivated in MRS broth at 30 °C. E. coli strains were cultivated with aeration in medium at 37 °C.
Cloning and overexpression of gadB in E. coli BL21
A gadB gene of L. lactis FJNUGA01 was amplified by using the primer pair of gadBF1 (5’-CGGGATCCATGTTATACGGAAAAGAAAATC-3’, BamH I) and gadBR1 (5’-ACGCGTCG ACTTAGTGAGTAAATCCATATG-3’, Sal I). The amplification conditions were: 94 °C for 5 min; 94 °C for 30 s; 58 °C for 30 s; 72 °C for 1.5 min; 72 °C for 10 min; 30 cycles (EasyCycler 96, Analytikjena, Germany). The amplified fragment was digested by BamH I and Sal I, and then ligated into the same restriction enzyme sites of pET-28a to yield pET-gadB. The pET-gadB was introduced into E. coli BL21 (DE3), and the transformants were designated BL21(DE3)-pET28a-gadB. DNA sequence analysis was done by using BLAST (http://blast.ncbi.nlm.nih.gov/Blast.cgi) and DNASTAR software (http://www.dnastar.com/).
Optimization of induction conditions
Recombinant E. coli BL21(DE3)-pET28a-gadB was cultivated in LB medium (10 g/L tryptone, 5 g/L NaCl and5 g/L yeast extract) containing 50 mg/L kanamycin with shaking at 200 r/min in 250 mL shake flask. Then, 1% of the culture was inoculated into fresh LB medium to obtain an exponentially growing culture. The optimum induction conditions for the expression of GAD in E. coli were investigated by single-factor experimental design, i.e. the recombinant cells induced by different concentrations of IPTG (0.4, 0.7, 1.0, 1.3 and 1.6 mmol L−1) added to the exponentially growing cells, different induction times (10, 12, 16, 18 and 20 h) and different induction temperatures (26, 28, 30, 32 and 34 °C). The single-factor experiments were conducted in triplicate for each group and mean values with standard deviations (±SD) were calculated for GABA production and cell density. Each group of three parallel factors determined the most suitable conditions for inducing the expression of GAD for GABA production.
Bioconversion conditions
After induction by IPTG for several hours, the recombinant cells were centrifuged at 8,000 × g for 10 min to collect cells for bioconversion. Wet cells at 25 g L−1 (OD600 of 30) were resuspended in deionized water (DW) with different concentrations of L-Glu (1, 2, 3 and 4 mol L−1) at 45 °C to detect the production of GABA [Citation25]. For GABA production by the supernatant of the cell lysate, the same number of cells (OD600 of 30) were disrupted by sonication, then centrifuged to collect the supernatant as the catalyst. Data of GABA production are averages of triplicate experiments (±SD) calculated from three independent experiments.
Analytical methods
The cell density was measured by spectrophotometer at 600 nm (OD600). Sodium dodecyl sulphate polyacrylamide gel electrophoresis (SDS-PAGE) in a 12% (w/v) gel was used to analyze the expression of recombinant GAD. The concentrations of GABA and L-Glu were measured using the phenyl isothiocyanate derivation method by high-performance liquid chromatography (HPLC; Agilent 1260, Hewlett–Packard, Wilmington, NC, USA) equipped with an Agilent Zorbax Eclipse amino acid analysis (AAA) column (4.6 × 150 mm, 3.5 μm). Analyses were performed at 40 °C using a linear gradient of acetonitrile and 50 mmol L−1 sodium acetate as the mobile phases at a flow rate of 0.5 mL min−1, and monitored at 254 nm [Citation25]. The standard curves for GABA and L-Glu (Sigma, Missouri, USA) were obtained using the same procedure.
Results and discussion
Cloning of gadB gene from L. lactis FJNUGA01
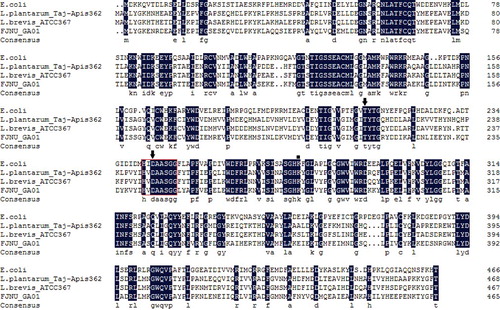
The gadB gene encoding a complete glutamate decarboxylase was amplified from L. lactis FJNUGA01. The gene contained 1,395 nucleotides, which could encode a protein of 465 amino acids with a calculated size of 53.77 kDa and an isoelectric point (pI) of 5.2 (NCBI No. KX382833). Alignment of the translated amino acid sequence of LlGAD with those of other GADs showed that LlGAD had the highest similarity to GAD from other L. lactis species (97% – 99%), followed by Lactococcus garvieae (92%) and Enterococcus avium (90%).
GAD is a pyridoxal 5’-phosphate (PLP)-dependent enzyme. Comparison of LlGAD with other GAD proteins showed LlGAD contained a highly conserved motif (HVDAAFGG) that belongs to the PLP-dependent decarboxylase superfamily [Citation15]. The domain includes a conserved lysine residue essential for PLP binding discovered in LlGAD (K277), and this lysine residue was located with the adjacent histidine residue [Citation16]. In addition, the active site residues involved in promoting decarboxylation were also present in LlGAD (T213 and D244) [Citation15] ().
Figure 1. Multiple alignments of L. lactis FJNUGA01 GadB with E. coli GadB, L. plantarum Taj-Apis362 and L. brevis ATCC 367 GadB.
Whole-cell bioconversion of GABA by recombinant E. coli
The recombinant plasmid pET28a-gad containing the gadB gene amplified from L. lactis FJNUGA01 was introduced into E. coli BL21 (DE3). After IPTG induction, a distinct band around 53 kDa was observed from the supernatant of the cell lysate, which matched well with the calculated size ((a)). The control strain harbouring pET-28a did not produce the desirable protein. The result indicated that the gadB genes were sufficiently expressed, and the GAD proteins were produced with high solubility. GABA production was detected using recombinant E. coli as the whole-cell biocatalyst in 1 mol L−1 L-Glu solution. Our previous study showed that the Glu solution supplied a better reaction environment for GABA production [Citation14]. When 30 OD recombinant E. coli was used, 100.68 g L−1 GABA with 98 mol% conversion was achieved within 7 h ((b)). During the process, 147.13 g of L-Glu (1 mol L−1) as the substrate was added to the system, only one-fourth of the substrate using L. brevis NCL912 as the cell factory, while the productivity was over five times higher than fermentation of L. brevis NCL912 [Citation6]. Interestingly, the trend of pH change was similar to the production curve of the GABA yield, thus the pH value increased gradually to near 6 within 7 h in the 1 mol L−1 L-Glu solution ((b)). When the pH value was higher than 6, GABA production was severely inhibited, due to the sharp decrease in activity of GAD at high pH values [Citation27]. In-depth relief of pH inhibition, such as expressing a mutated GAD with an expanded pH range, will be performed in further studies.
Figure 2. SDS-PAGE analysis of GAD overexpression and GABA production in recombinant E. coli by whole-cell bioconversion. (a) SDS-PAGE analysis of the expression of L. lactis FJNUGA01 GAD in E. coli. M, molecular weight markers; Lane 1, supernatant of the cell lysate from recombinant E. coli BL21 with the plasmid of pET-28a-llgadB; Lane 2, supernatant of the cell lysate from E. coli BL21 with the plasmid of pET-28a. (b) Time profiles of GABA production (square) and pH curve (triangle) of whole-cell bioconversion using 1 mol L−1 L-Glu solution as the substrate.
Determination of optimal IPTG concentration
The degree of GAD expression is controlled by varying the concentration of IPTG; therefore the induction of GAD expression in the recombinant E. coli was evaluated with different IPTG concentrations (from 0.4 to 1.6 mmol L−1). The SDS-PAGE result had no obvious effect on the soluble expression of GAD under different IPTG concentrations ((a)). For whole-cell bioconversion, GABA production after 3 h of conversion was evaluated to distinguish any differences, as complete conversion occurred within 7 h. The growth with concentrations of IPTG at 0.4 mmol L−1 resulted in low level production of GABA (50.8 g L−1) ((b)), while GABA production increased more than 40%, to 71.2 g L−1 when the culture was induced with 1.6 mmol L−1 IPTG. However, the OD was slightly decreased to approximately 3.42 when the concentration of IPTG increased to 1.6 mmol L−1 ((b)). This result is likely due to increased expression of GAD protein inhibiting cell growth. After evaluating cell growth and GABA production, 1.0 mmol L−1 IPTG was considered optimal concentration in all subsequent studies.
Figure 3. Effect of IPTG concentrations on GAD expression and GABA production. (a) SDS-PAGE analysis of GAD expression under different IPTG concentrations. M represents molecular weight markers; 1–5 represents supernatants of the cell lysate from different IPTG concentrations (0.4, 0.7, 1.0, 1.3 and 1.6 mmol l−1). (b) GABA production of whole-cell bioconversion (square) within 3 h and cell density (triangle) from different IPTG concentrations. The cells induced by different IPTG concentrations were applied as the catalysts for whole-cell bioconversion using 1 M L-Glu solution as the substrate at 45 °C. Data are presented as the mean ± SD values from three independent experiments.
Effect of induction temperature on GABA production
The capability of recombinant E. coli to produce GABA is related to GAD expression, especially of soluble GAD proteins with high activity. To evaluate the effect of induction temperature on the soluble expression of GAD, cultures were incubated at five different temperatures in the range of 25–37 °C for 16 h after induction with 1 mmol L−1 IPTG. The effect of temperature on the cell growth and the level of soluble GAD is clearly seen ((a)). The highest expression of soluble protein was achieved at 25 °C. The cell growth increased with an increase in temperature, while the soluble fraction of GAD was found to decrease with an increase in temperature.
Figure 4. Effect of induction temperatures on GAD expression and GABA production. (a) SDS-PAGE analysis of the GAD expression under different induction temperatures. M represents molecular weight markers; 1–5 represents supernatants of the cell extract from different induction temperatures (25, 28, 30, 33 and 37 °C). (b) GABA production of whole-cell bioconversion (square) and the supernatant of the cell lysate as the catalyst (diamond) within 3 h, and cell density (triangle) from different induction temperatures. The cells induced by different induction temperatures were applied as the catalysts for the bioconversion using 1 M L-Glu solution as the substrate at 45 °C. Data are presented as the mean ± SD values from three independent experiments.
For whole-cell bioconversion, GABA production peaked when the induction temperature was 30 °C, and the yield reached to 93.7 g L−1 within 3 h using 1 mol L−1 L-Glu as the substrate ((b)). To our surprise, although the soluble protein was highly expressed when the temperature was below 30 °C, GABA production was much lower at 30 °C. To determine the reason, we used the supernatant of cell lysate instead of the whole cell as the catalyst for GABA synthesis. Interestingly, the highest GABA production (89.4 g L−1) was achieved by the supernatant of cell lysate from the recombinant E. coli incubated at 26 °C, which was inconsistent with the production in the whole-cell bioconversion ((b)). The result indicated that the soluble GAD expression was generally proportional to GABA production; however, other GABA-synthesis essential proteins in the membrane, such as GadC, might be affected by the lower induction temperature. GadC regulates the transport of Glu and GABA into and out of cells [Citation28]. Therefore, 30 °C was found to be the optimum temperature, and further optimization efforts were performed at this temperature.
Determination of optimal IPTG induction time
Since induction time is another key factor to consider for GABA production, an IPTG-induction time course analysis of GABA synthesis by recombinant E. coli was performed. After the addition of 1 mmol L−1 IPTG, the culture was incubated at 30 °C and samples were evaluated at different induction times (from 10 to 20 h). The level of soluble GAD was determined by SDS–PAGE in the supernatant. As shown in (a), the levels of soluble GAD expression remained almost the same at different induction times. However, cell growth was much lower when the induction time was 10 h. The GABA yield was also detected using cells with different incubation times as the biocatalysts. The highest yield was achieved at 98.4 g L−1 when the induction time was 12 h ((b)). Increases in induction time resulted in slight decreases in GABA production. Therefore, the 12 h induction time was more applicable for whole-cell bioconversion.
Figure 5. Effect of induction times on GAD expression and GABA production. (a) SDS-PAGE analysis of GAD expression under different induction times. M represents molecular weight markers; 1–5 represents supernatants of the cell lysate from different induction times (10, 12, 16, 18 and 20 h). (b) GABA production of whole-cell bioconversion (square) within 3 h and cell density (triangle) from different induction temperatures. The cells induced by different induction times were applied as the catalysts for whole-cell bioconversion using 1 M L-Glu solution as the substrate at 45 °C. Data are presented as the mean ± SD values from three independent experiments.
Effect of substrate concentration on GABA production
After the optimization of the culture conditions for GAD expression, a series of L-Glu concentrations was applied as the substrate for whole-cell bioconversion to determine the optimal initial L-Glu concentration for GABA production. Time profiles of GABA production revealed that the GABA yield and productivity of the first hour increased with the higher initial L-Glu concentration (). The highest GABA production (316.16 g L−1) was achieved using 4 mol L−1 L-Glu as the substrate within 7 h; however, only 76.6% L-Glu was converted to GABA (). Incomplete conversion (84.5 mol%) was also observed when 3 mol L−1 L-Glu was used within 7 h and the conversion time was prolonged to > 10 h so almost all the L-Glu could be consumed (). The impurity of GABA mixed with L-Glu would negatively affect the following procedures of separation and purification, so we preferred the high production achieved by consuming as much as L-Glu as possible. When the initial L-Glu concentration decreased to 2 mol L−1, 204.11 g L−1 GABA was achieved, and the reaction conversion was successfully enhanced to 99% within 6 h. The productivity reached 34 g L−1 h−1, which was higher than the productivity when using 1, 3 or 4 mol L−1 L-Glu as the substrate, and almost no L-Glu remained. In the previous work, the highest efficiency of GABA production by using immobilized GAD or purified engineered GAD was about 35 g L−1 h−1 [Citation4,Citation17], whose efficiency was not very different from ours (34 g L−1 h−1). Notably, the steps of purification and immobilization, as well as the complicated feeding equipment and the complex engineered process were not necessary in our system. Furthermore, our space-time yield (34 g L−1 h−1) was higher than the best E. coli catalyst (25.75 g L−1 h−1) or LAB bioconversion (20.12 g L−1 h−1) in one round [Citation25,Citation26]. In our strategy, we used L-Glu instead of MSG as the substrate to keep the activity of GadC, while Le Vo et al. [Citation29] overexpressed GadC to improve the transportation of MSG. Furthermore, we screened the enzyme GAD from L. lactis with high decarboxylation activity and optimized our system. Although the synthetic protein complex was not applied in our case, the production yield reached 99% within 6 h. Whether our strain can be reused in our buffer-free system remains to be determined; thus further investigations should be conducted. In addition, our system was simple to operate, able to be widely substituted with different GAD genes, and simplified the purification step for downstream treatment.
Figure 6. Time profiles of GABA production during whole-cell bioconversion in different L-Glu concentrations. Bioconversions were performed at 45 °C using 25 g wet cell per liter (OD600 of 30). The cells induced by 1.0 mM IPTG at 30 °C for 12 h were used as the catalysts. Square, circle, up triangle and down triangle represent the concentrations of L-Glu (1, 2, 3 and 4 M), respectively. Data are presented as the mean ± SD values from three independent experiments.
Conclusions
In this work, a simple and highly efficient process of GABA production from L-Glu was developed. The most commonly used plasmid, pET-28a, was applied as the expression vector for overexpression of L. lactis GadB in E. coli. After optimizing the IPTG concentration, induction temperature and induction time, the recombinant E. coli was cultivated to be the most suitable whole-cell catalyst. Using the optimal concentration of 2 mol L−1 glutamic acid as the substrate, 204.11 g L−1 GABA was achieved by whole-cell bioconversion without the addition of co-factor PLP. The productivity reached 34 g L−1 h−1, and reaction conversion was successfully improved to 99% within 6 h. This whole-cell biocatalytic system simplified the former complex GABA-producing system, which results in a more cost-effective process for industrial GABA production.
Conflict of interest
The authors declare no financial or commercial conflict of interest.
Acknoeledgements
We are grateful for the support of the Natural Science Foundation of Fujian Province (2016J05074 and 2014J01037).
Additional information
Funding
References
- Diana M, Quilez J, Rafecas M. Gamma-aminobutyric acid as a bioactive compound in foods: a review. J Funct Foods. 2014;10:407–420.
- Wong CG, Bottiglieri T, Snead OC. 3rd. GABA, gamma-hydroxybutyric acid, and neurological disease. Ann Neurol. 2003;54(Suppl 6):S3–12.
- Kawasaki N, Nakayama A, Yamano N, et al. Synthesis, thermal and mechanical properties and biodegradation of branched polyamide 4. Polymer. 2005;46:9987–9993.
- Lammens TM, De Biase D, Franssen MCR, et al. The application of glutamic acid alpha-decarboxylase for the valorization of glutamic acid. Green Chem. 2009;11:1562–1567.
- Kook MC, Cho SC. Production of GABA (gamma amino butyric acid) by Lactic Acid Bacteria. Korean J Food Sci An. 2013;33:377–389.
- Li HX, Qiu T, Huang GD, et al. Production of gamma-aminobutyric acid by Lactobacillus brevis NCL912 using fed-batch fermentation. Microb Cell Fact. 2010 [cited 2017 Oct 10];9:85. DOI: 10.1186/1475-2859-9-85.
- Zhao AQ, Hu XQ, Pan L, et al. Isolation and characterization of a gamma-aminobutyric acid producing strain Lactobacillus buchneri WPZ001 that could efficiently utilize xylose and corncob hydrolysate. Appl Microbiol Biot. 2015;99:3191–3200.
- Xu N, Wei L, Liu J. Biotechnological advances and perspectives of gamma-aminobutyric acid production. World J Microb Biot. 2017 [cited 2017 Oct 10];33:64. DOI: 10.1007/s11274-017-2234-5.
- Shi F, Jiang JJ, Li YF, et al. Enhancement of gamma-aminobutyric acid production in recombinant Corynebacterium glutamicum by co-expressing two glutamate decarboxylase genes from Lactobacillus brevis. J Ind Microbiol Biot. 2013;40:1285–1296.
- Shi F, Zhang M, Li YF. Overexpression of ppc or deletion of mdh for improving production of gamma-aminobutyric acid in recombinant Corynebacterium glutamicum. World J Microb Biot. 2017 [cited 2017 Oct 10];33:122. DOI: 10.1007/s11274-017-2289-3.
- Zhang RZ, Yang TW, Rao ZM, et al. Efficient one-step preparation of gamma-aminobutyric acid from glucose without an exogenous cofactor by the designed Corynebacterium glutamicum. Green Chem. 2014;16:4190–4197.
- Pham VD, Somasundaram S, Park SJ, et al. Co-localization of GABA shunt enzymes for the efficient production of gamma-aminobutyric acid via GABA shunt pathway in Escherichia coli. J Microbiol Biotechn. 2016;26:710–716.
- Pham VD, Somasundaram S, Lee SH, et al. Efficient production of gamma-aminobutyric acid using Escherichia coli by co-localization of glutamate synthase, glutamate decarboxylase, and GABA transporter. J Ind Microbiol Biot. 2016;43:79–86.
- Zhao A, Hu X, Wang X. Metabolic engineering of Escherichia coli to produce gamma-aminobutyric acid using xylose. Appl Microbiol Biot. 2017;101:3587–3603.
- Rodrigues RC, Ortiz C, Berenguer-Murcia A, et al. Modifying enzyme activity and selectivity by immobilization. Chem Soc Rev. 2013;42:6290–6307.
- Dinh TH, Ho NAT, Kang TJ, et al. Salt-free production of gamma-aminobutyric acid from glutamate using glutamate decarboxylase separated from Escherichia coli. J Chem Technol Biot. 2014;89:1432–1436.
- Kang TJ, Ho NAT, Pack SP. Buffer-free production of gamma-aminobutyric acid using an engineered glutamate decarboxylase from Escherichia coli. Enzyme Microb Tech. 2013;53:200–205.
- Lee S, Ahn J, Kim YG, et al. Gamma-aminobutyric acid production using immobilized glutamate decarboxylase followed by downstream processing with cation exchange chromatography. Int J Mol Sci. 2013;14:1728–1739.
- Park SJ, Kim EY, Noh W, et al. Synthesis of nylon 4 from gamma-aminobutyrate (GABA) produced by recombinant Escherichia coli. Bioproc Biosyst Eng. 2013;36:885–892.
- Lee JY, Jeon SJ. Characterization and immobilization on nickel-chelated Sepharose of a glutamate decarboxylase A from Lactobacillus brevis BH2 and its application for production of GABA. Biosci Biotech Bioch. 2014;78:1656–1661.
- Zhang Y, Song L, Gao Q, et al. The two-step biotransformation of monosodium glutamate to GABA by Lactobacillus brevis growing and resting cells. Appl Microbiol Biot. 2012;94:1619–1627.
- De Carvalho CCCR. Whole cell biocatalysts: essential workers from Nature to the industry. Microb Biotechnol. 2017;10:250–263.
- Yamano N, Kawasaki N, Takeda S, et al. Production of 2-Pyrrolidone from Biobased Glutamate by Using Escherichia coli. J Polym Environ. 2013;21:528–533.
- Plokhov AY, Gusyatiner MM, Yampolskaya TA, et al. Preparation of γ-Aminobutyric Acid Using E. coli Cells with High Activity of Glutamate Decarboxylase. Appl Biochem Biotech. 2000;88:257–265.
- Ke CR, Yang XW, Rao HX, et al. Whole-cell conversion of l-glutamic acid into gamma-aminobutyric acid by metabolically engineered Escherichia coli. SpringerPlus. 2016 [cited 2017 Oct 10];5:591. DOI: 10.1186/s40064-016-2217-2.
- Shi XF, Chang CY, Ma SX, et al. Efficient bioconversion of L-glutamate to gamma-aminobutyric acid by Lactobacillus brevis resting cells. J Ind Microbiol Biot. 2017;44:697–704.
- Shi F, Xie YL, Jiang JJ, et al. Directed evolution and mutagenesis of glutamate decarboxylase from Lactobacillus brevis Lb85 to broaden the range Of its activity toward a near-neutral pH. Enzyme Microb Tech. 2014;61-62:35–43.
- Kanjee U, Houry WA. Mechanisms of Acid Resistance in Escherichia coli. Annu Rev Microbiol. 2013;67:65–81.
- Le Vo TD, Ko JS, Park SJ, et al. Efficient gamma-aminobutyric acid bioconversion by employing synthetic complex between glutamate decarboxylase and glutamate/GABA antiporter in engineered Escherichia coli. J Ind Microbiol Biotechnol. 2013;40(8):927–933.