
 ?Mathematical formulae have been encoded as MathML and are displayed in this HTML version using MathJax in order to improve their display. Uncheck the box to turn MathJax off. This feature requires Javascript. Click on a formula to zoom.
Abstract
Metallic gold nanoparticles (AuNPs) were prepared and stabilised with henna (Lawsonia inermis) extract. The synthesis of AuNPs was characterised by ultraviolet-visible (UV-Vis) spectrophotometry, transmission electron microscopy (TEM), scanning electron microscopy (SEM) coupled with energy dispersive X-ray spectroscopy (EDS), dynamic light scattering and Fourier-transform infrared spectroscopy (FTIR). This study also investigated the degradation of dichlorodiphenyltrichloroethane (DDT) using AuNPs. The initial concentration of DDT was either 10 or 20 mg/L. In our study, the highest percentage of DDT degradation was obtained when the initial DDT concentration was 20 mg/L. It reached a maximum of 64.1% at 10 mg/L and 77.4% at 20 mg/L after 72 h. DDT degradation was determined using UV-Vis spectrophotometry, FTIR and gas chromatography-mass spectrometry (GC/MS). The GC/MS spectra displayed five peaks related to the DDT degradation products: DDT, dichlorodiphenyldichloroethene (DDE), dichlorodiphenyldichloroethane (DDD), dichlorodiphenylmethane (DDM) and dichlorophenylethane (DCE). Our results indicate that AuNPs had high degradation rates for DDT, which implies that they have potential applications as metal nanoparticles for environmental clean-up.
Introduction
Organochlorine pesticides are a major public health concern and pose an enormous challenge for safe treatment. The polychlorinated structures tend to be slightly soluble in water and also exhibit moderate-to-strong sorption potential, which results in the accumulation of the pesticides in the adipose tissues of humans and animals. They can mimic estrogen and the resulting metabolite, dichlorodiphenyldichloroethene (DDE), acts as an androgen antagonist [Citation1, Citation2]. DDT is amongst the foremost widely used primarily organochlorine based pesticides in the world since the late 1930s [Citation3]. To date, large quantities of DDT have been used round the world. Currently, several countries have banned this chemical due to its harmful health effects [Citation4], but others, e.g. some tropical countries, still allow its use [Citation5]. The United States Environmental Protection Agency (EPA) has classified DDT as a persistent organic pollutant and its metabolites, DDD (dichlorodiphenyldichloroethane) and DDE (dichlorodiphenyldichloroethene) as harmful in nature [Citation6]. Moreover, industrial DDT soil pollution could be a serious problem in many countries. Therefore, it is important to develop safe and economical techniques for the treatment of DDT-contaminated soil. In this respect, nanotechnology offers efficient, eco-friendly and economic solutions to rectify the problem of environmental pollution [Citation7–9]. Phytochemicals, which are compounds present in plants, have different biological activities and can be used for the synthesis of metal nanoparticles. They play important roles in both stabilisation and reduction of the nanoparticles. The focus of the present work was to synthesise gold nanoparticles (AuNPs) using the extract from the leaf powder of Lawsonia inermis (belonging to the Lythraceae family) as a stand-alone reducing and capping agent. Nanoparticles have novel properties due to their distinct morphology, size, ionic state and distribution. Due to their small size, nanoparticles have a high surface area-to-volume ratio, and also exhibit excellent electrical, catalytic, optical and magnetic properties [Citation10]. The use of metal nanoparticles for environmental clean-up is a new area of research in which only limited progress has been achieved thus far [Citation7–9]. Few reports on the degradation of halocarbons by nanoparticles are available in the literature [Citation11–13]. To the best of our knowledge, there have been no reports on the degradation of DDT using AuNPs. The present work focuses on the synthesis of AuNPs using the extracts of L. inermis, and on the use of these AuNPs for the degradation of DDT.
Materials and methods
Preparation of L. inermis (henna) aqueous extract
Dried henna obtained from a local market in Al-Riyadh was used as the reducing and capping agent. The extract was prepared by boiling 5 g of henna powder in 50 mL deionised water for 15 min. The extract was then centrifuged (Helmle, model Z326) at 2000 g for 15 min after which the supernatant was collected and filtered (Whatman no. 1).
Synthesis of gold nanoparticles
Fifty millilitres of the henna aqueous extract were mixed with 10 mL of tetrachloroauric acid (HAuCl4·3H2O) (0.001 mol/L) and stirred at 200 rpm at room temperature for 24 h. A change in the colour of the reaction medium indicated the formation of AuNPs [Citation14, Citation15].
Characterisation of the gold nanoparticles
The reduction of AuNPs was confirmed using a double beam ultraviolet visual (UV-Vis) spectrophotometer (Victoria, Australia) in the wavelength range of 200–1000 nm. Subsequently, the AuNPs were subjected to different analytical techniques to further characterise them. To analyse the particle size and shape, 1 mL of the AuNPs solution was placed on carbon-coated copper grids, air dried, and viewed at 100 kV on a transmission electron microscope (TEM, JEM 1400). The size distribution of the nanoparticles was determined using the ImageJ 1.45s software and the data were plotted as histograms.
Scanning electron microscopy (SEM) was performed using a QUANTA 250 instrument equipped with an energy dispersive X-ray spectroscope (EDS). Thin films of the sample were prepared by placing a few drops of the solution on a carbon coated copper grid and drying it under a mercury lamp for 5 min. The thin films thus formed were examined using the SEM. EDS analysis was performed to analyse the elemental composition of the AuNPs. Differential light scattering (DLS) was conducted on a ZEN 3600 HT Laser Malvern Zetasizer Nano series instrument (Malvern Instruments, UK) to measure the particle size and zeta potential. For Fourier transform infrared spectroscopy (FTIR) measurements, the nanoparticles were diluted using potassium bromide in a 1:100 ratio and freeze-dried. The spectra were recorded on a FTIR instrument (Nicolet 6700 spectrometer, Thermo Electron Corporation, USA) with a resolution of 4 cm−1 in the wavenumber range of 400–4000 cm−1.
Preparation of the DDT stock solution
DDT stock solution (1000 mg/L) was prepared by dissolving DDT in acetone [Citation16]. Lower concentrations were made by diluting a sample of the stock solution with water–acetone ratio of 9:1.
Catalytic degradation of DDT
About 10 mg of the biosynthesised AuNPs was added to 100 mL of the DDT solution (10 and 20 mg/L initial concentration) for carrying out the degradation reaction. In the control sample, no nanoparticles were added. The reaction mixture was vigorously stirred by magnetic stirring for 72 h. At specific time intervals, aliquots (2–3 mL) of the suspension were filtered and used to estimate the degradation of DDT.
DDT biodegradation analysis
UV-Vis spectrophotometry
The absorbance of the supernatant was measured using a UV-Vis spectrophotometer at various wavelengths. The degradation of DDT was estimated according to the following equation [Citation17]:
where A0 is the initial absorbance and At is the absorbance after time t at the wavelength corresponding to the peak maximum.
Fourier transformed infrared spectroscopy
The biodegradation of DDT was determined by comparing the FTIR peak profiles of degraded DDT samples and the control sample. The FTIR spectra were generated on a Nicolet 6700 spectrometer (Thermo Electron Corporation, USA) with a resolution of 4 cm−1 in the wavenumber range of 400–4000 cm−1.
Gas chromatography-mass spectrometry
The metabolites formed during the degradation of DDT were identified using a QP2010 GC-MS system (Shimadzu, Japan). Gas chromatography was conducted in the temperature programming mode with a Restek column (0.25 mm, 60 m; XTI-5). The oven temperature program included several steps: the initial temperature of 100 °C was held for 1.0 min, increased at a rate of 15 °C/min to 250 °C and held for 2.0 min, then increased at a rate of 10 °C/min to 280 °C and held there for 12.0 min; the total run time was 28.0 min. The helium carrier gas flow rate was 1.0 mL/min. The degradation products were identified by a comparison of the retention times and fragmentation patterns, as well as with the mass spectra in the NIST spectral library stored in the computer software (version 1.10 beta; Shimadzu) of the GC-MS system.
Results and discussion
Characterisation of the gold nanoparticles
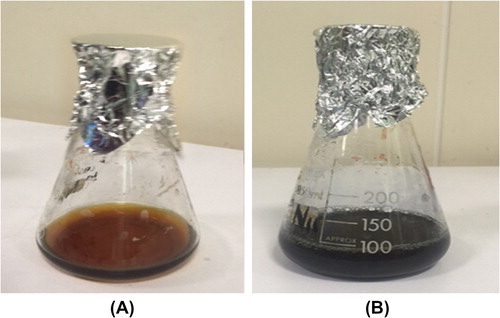
shows that addition of L. inermis to 10−3 mol/L aqueous HAuCl4 resulted in a change of the solution colour to blue, indicating AuNPs formation [Citation18]. The change of colour is an indication of the reduction of the chloroaurate ions by the proteins present in the plant extract [Citation19].
Figure 1. L. inermis extract (a) and aqueous solution of 10 − 3 mmol/L AuCl3 with L. inermis (b).
UV-Vis spectrophotometry
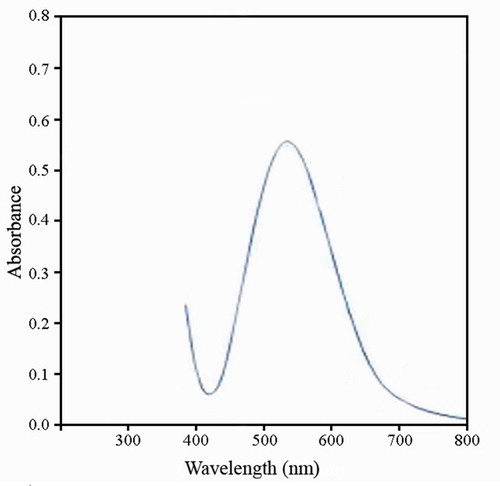
The presence of AuNPs in the solution was confirmed by UV-Vis spectrophotometry (). The results showed a sharp peak at 533 nm, indicating the formation of AuNPs. The obvious colour change took place within 24 h [Citation20–22].
Figure 2. UV-Vis absorbance bands at 533 nm for AuNPs forms using L. inermis extract.
Transmission electron microscopy
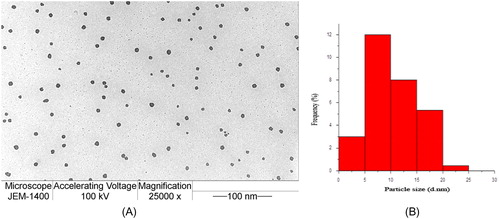
The morphology and particle size of the synthesised AuNPs were investigated using TEM (). In , there was no aggregation observed in the spherical AuNPs; tiny nanoparticles (5–10 nm) could be observed in . The small particle size of the AuNPs synthesised using L. inermis was due to the presence of a large number of nucleation sites for AuCl4 complexation. Furthermore, L. inermis components can effectively prevent the aggregation of the nanoparticles. This observation is in agreement with earlier reports [Citation23], in which AuNPs were synthesised using green tea, zimbro tea and green coconut water. Besides, AuNPs were synthesised using the flower extract of Plumeria alba [Citation24].
Figure 3. TEM image of the AuNPs forms using L. inermis extract at magnification of 25,000 × (a) and the histogram of the particle size distribution of the AuNPs (b).
Scanning electron microscopy
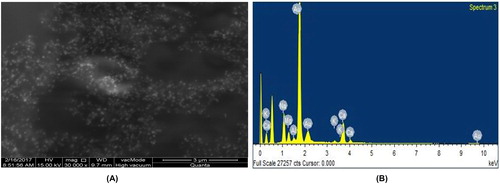
The SEM images of the synthesised AuNPs are presented in . At room temperature, the synthesised nanoparticles had a small size and spherical shape.
Figure 4. SEM images of AuNPs (a) and EDS spectrum of AuNPs synthesised using L. inermis (b).
Electron dispersive X-ray spectroscopy
The EDS analysis was conducted to detect the amount of AuNPs in the sample. The EDS spectrum () showed strong signals of AuNPs in three different places of the sample, confirming their presence, while weak signals which correspond to other elements were also present in the spectrum. These results reveal that proteins, enzymes and salts were present in the plant extract [Citation25].
Zeta potential analysis
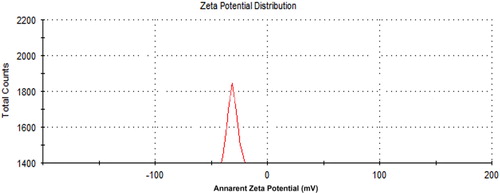
The surface charge property of the nanoparticles was characterised by the zeta potential analysis. It reflects the electrical potential of the particles. Nanoparticles with a zeta potential either greater than +30 mV or lesser than −30 mV are considered to be stable in a suspension, as the surface charge prevents the aggregation of the particles [Citation26, Citation27]. The zeta potential of the AuNPs synthesised with L. inermis was −33 mV (), which indicates their stability and not agglomeration.
Figure 5. Zeta potential of AuNPs synthesised using L. inermis.
Fourier-transform infrared spectroscopy
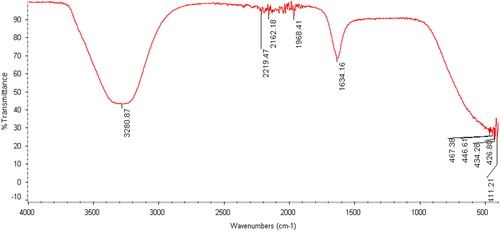
The synthesised AuNPs were subjected to FTIR analysis to detect the bioactive compounds associated with the nanoparticles in the range of 400–4000 cm−1. The FTIR spectrum of formation AuNPs by L. inermis is shown in . A number of functional bonds were related to the stability of the capped nanoparticles. The peak at 1634.16 cm−1 corresponds to the C = O bond, while the peaks at 2162.18 and 2219.47 cm−1 are ascribed to the C–N bond (). Besides, the peak at 3280.87 cm−1 is ascribed to the N–H and H–O bonds, whereas the peak at 1968.41 cm−1 is related to the aromatic ring. Similar results have been observed in other studies [Citation25, Citation28–30].
Figure 6. FTIR spectrum of AuNPs synthesised using L. inermis.
Catalytic degradation of DDT
UV-Vis spectrophotometry
The catalytic activity of the AuNPs on the degradation of DDT (Online Supplemental Scheme 1) was mapped at different time periods by following the intensity of the DDT absorption peak at 270 nm. shows that the intensity of the absorption peak at 270 nm for DDT gradually decreased with an increase in the exposure time, which indicates that degradation has taken place. Meanwhile, the absorption by AuNPs intensified at 533 nm. The degradation reaction was estimated to be completed when the absorption peak approached the baseline. DDT might have been degraded due to dechlorination or by sorption onto the AuNPs’ surfaces [Citation31]. This result was in good agreement with a previous study [Citation32], in which the catalytic degradation of methylene blue dye by silver nanoparticles was described. The data in and show the percentage of degradation efficiency of AuNPs as a function of the DDT concentration (10 and 20 mg/L); the data obtained indicate that the amount of DDT degraded increased when the initial DDT concentration was increased. This observation is in agreement with earlier reports [Citation33]. In our results, the highest percentage of DDT degradation was obtained when the initial DDT concentration was 20 mg/L. After 72 h, the degradation percentage reached a maximum of 64.1% and 77.4% at DDT concentrations of 10 and 20 mg/L, respectively.
Figure 7. Absorption spectra of aqueous solutions of DDT treated with 20 mg/L of AuNPs synthesised using L. inermis at different time points.
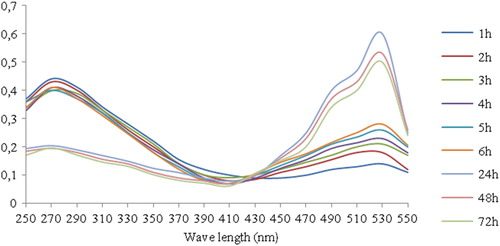
Figure 8. Percentage of DDT degradation by 10 and 20 mg/L of synthesised AuNPs at different time points.
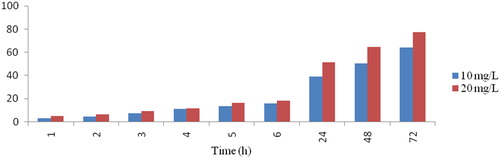
Table 1. DDT degradation (%) at 10 and 20 mg/L of DDT by synthesised gold nanoparticles.
Fourier-transform infrared spectroscopy
The FTIR spectra of pure DDT and AuNPs degraded DDT are presented in . The absorption band of the aromatic C–C in-ring stretching in DDT is located at 1587.25 cm−1 and it disappeared completely upon treatment with the AuNPs. The appearance of a new absorption band at 2351.33 cm−1 is ascribed to the degradation products. In addition, the 2927.27 cm−1 peak of pure DDT shifted to 2944.1 cm−1 in the DDT/AuNPs system; the increase in the absorption intensity may be due to the oxidation of aromatic rings into quinones or phenols [Citation34]. The small peak present in pure DDT at 605.33 cm−1 due to the alkyl halides [Citation32] shifted to 630.49 cm−1, thus indicating the degradation of DDT.
Figure 9. FTIR spectra of pure DDT (a) and DDT treated with AuNPs (b).
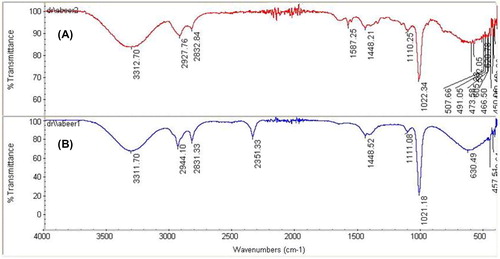
The observed peak broadening is attributed to the formation of degradation products with slightly shifted absorption bands that are superimposed on those of carbonyl and aromatic functional groups of the parent compound [Citation35]. The peaks at 507.66, 582.05, 491.05, 473.58, and 466.50 cm−1 ascribed to the C–C skeleton vibrations [Citation36] were absent in the FTIR spectrum of the DDT/AuNPs system. This may be due to the smash bonds.
Gas chromatography-mass spectrometry
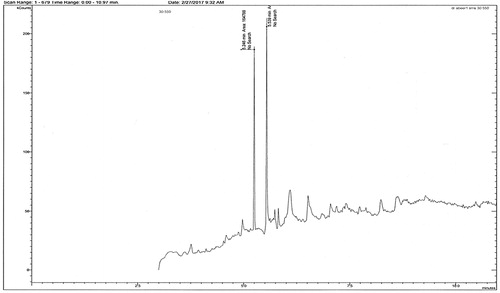
DDT can be transformed into DDE by the dehydrochlorination pathway and by hydrodechlorination to DDD, DDM and DCE. The GC/MS spectra of DDT treated with AuNPs synthesised using L. inermis are presented in . The peaks at 20.33, 20.11, 18.24, 14.35, and 8.26 Rt correspond to DDT, DDD, DDE, DDM and DCE, respectively. In the studied conditions, the loss of aromatic chlorine in DDT was not observed since it may require higher temperatures [Citation37]. The hydrodechlorination pathway takes place under acidic or neutral conditions using zero-valent metals and bimetallic systems [Citation6, Citation16]. The dehydrochlorination is almost impossible in alkaline aqueous solutions without either alcohols or heating [Citation38]. However, in our work, the dehydrochlorination apparently occurred under acidic conditions in the water–acetone medium, which could be due to the enhancement function of Au. shows that almost 77.4% of the DDT was degraded within 72 h. It was adsorbed onto the surfaces of the nanoparticles where the C–Cl bond was broken and the chlorine atom was replaced by hydrogen [Citation39]. There are five factors that impact the rate of dechlorination by zero-valent metal systems: (i) ionisation potential of the zero-valent metal, (ii) solubility of the metal hydroxide formed following the corrosion of the metal, (iii) presence of oxygen, (iv) availability of protons, and (v) solubility of the target compound [Citation16]. A number of scientists have reported the successful dechlorination of compounds like chlorinated methanes, polychlorinated biphenyls (PCBs), DDT, chlorinated ethylene, and chlorophenols by metals. For example, the dechlorination of chlorophenol by using Fe0/Pd has been demonstrated [Citation40] and also by Mg0/Pd [Citation16, Citation41]. Elsewhere, the dechlorination of PCBs and DDT by the sequential addition of Fe0/Pd and Mg0/Pd has been reported. Fe0/Pd was used initially to partially dechlorinate the principal compounds and Mg0/Pd was subsequently used to complete the dechlorination under acidic conditions using water–acetone as the reaction phase [Citation42]. Moreover, the excellent degradation rates of DDT using zero valent iron nanoparticles [Citation6, Citation43] and bimetallic Ni/Fe nanoparticles were reported [Citation39].
Figure 10. GC/MS of DDT treated with AuNPs synthesised using L. inermis.
Conclusions
Green biosynthesised AuNPs were prepared and stabilised with henna (Lawsonia inermis) extract. The synthesis of AuNPs was characterised by UV-Vis spectrophotometry, TEM, SEM, EDS and FTIR. To assess the potential environmental application of these AuNPs nanoparticles, we studied the degradation rate of the pesticide DDT. The highest percentage of DDT degradation was obtained when the initial DDT concentration was 20 mg/L. It reached a maximum of 77.4% after 72 h by using AuNPs nanoparticles. Our results indicate that AuNPs had high degradation rates for DDT, which implies that they have potential applications as metal nanoparticles for environmental clean-up.
Supplemental Material
Download PDF (81.1 KB)Acknowledgements
This research project was supported by a grant from the ‘Research Center of the Female Scientific and Medical Colleges’, Deanship of Scientific Research, King Saud University.
Disclosure statement
No potential conflict of interest was reported by the authors.
Additional information
Funding
Related Research Data
References
- Kennish MJ, Ruppe BE. DDT contamination in selected estuarine and coastal marine finfish and shellfish of New Jersey. Arch Environ Cont Toxicol. 1996;31:256–262.
- Kelce WR, Stone CR, Laws SC, et al. Persistent DDT metabolite p,p'-DDE is a potent androgen receptor antagonist. Nature. 1995;375:581–585.
- Anfossi L, Giraudi G, Tozzi C, et al. Development of a non-competitive immunoassay for monitoring DDT its metabolites and analogues in water samples. Anal Chim Acta. 2004;506:87–95.
- Bochkareva AE, Fini F, Eremin S, et al. Development of a heterogeneous chemiluminescent flow immunoassay for DDT and related compounds. Anal Chim Acta. 2002;453:43–52.
- Foght J, April T, Biggar K, et al. Bioremediation of DDT-contaminated soils: a review. Bioremediat J. 2001;5:225–246.
- Sayles GD, You G, Wang M, et al. DDT, DDD, and DDE dechlorination by zero-valent iron. Environ Sci Technol. 1997;31:3448–3454.
- Mohamed EF. Nanotechnology: Future of environmental air pollution control. Environ Manage Sustain Dev. 2017;6:429–454.
- Corsi I, Winther-Nielsen M, Sethi R, et al. Ecofriendly nanotechnologies and nanomaterials for environmental applications: key issue and consensus recommendations for sustainable and ecosafe nanoremediation. Ecotoxicol Environ Saf. 2018;154:237–244.
- Linhai B, Shengnan T, Qinghuan M. Green synthesis, characterization and application of proanthocyanidins-functionalized gold nanoparticles. Nanomaterials. 2018;8:53. DOI:10.3390/nano8010053
- Christof MN. Nanoparticles, proteins and nucleic acids: biotechnology meets materials science. Angew Chem Int Ed Engl. 2001;40:4128–4158.
- Nair AS, Pradeep T. Halocarbon mineralization and catalytic destruction by metal nanoparticles. Curr Sci. 2003;84:1560–1564.
- Nair AS, Tom RT, Suryanarayanan V, et al. ZrO2 bubbles from core–shell nanoparticles. J Mater Chem. 2003;13:297–300.
- Ananpattarachai J, Kajitvichyanukul P. Photocatalytic degradation of p,p-DDT under UV and visible light using interstitial N-doped TiO2. J Environ Sci Health B. 2015;50:247–260.
- Starnes D. In planta “green engineering” of variable sizes and exotic shapes of gold nanoparticles: An integrative eco-friendly approach. [Masters’ Thesis]. Nashville (TN): Belmont University; 2018.
- Pattanayak M, Muralikrishnan T, Nayak PL. Green synthesis of gold nanoparticles using Daucus carota (carrot) aqueous extract. World J Nano Sci Technol. 2014;3:52–58.
- Gautam SK, Suresh S. Studies on dechlorination of DDT (1,1,1-trichloro-2,2- bis(4-chlorophenyl) ethane) using magnesium/palladium bimetallic system. J Hazard Mater. 2007;139:146–153.
- Aguilar T, Navas J, Alcantara R, et al. A route for the synthesis of Cu doped TiO2 nanoparticles with very low band gap. Chem Phys Lett. 2013;571:49–53.
- Vijayakumar R, Devi V, Adavallan K, et al. Green synthesis and characterization of gold nanoparticles using extract of anti-tumor potent Crocus sativus. Physica E. 2011;44:665–671.
- Kumar P, Singh P, Kumari K. A green approach for the synthesis of gold nanotriangles using aqueous leaf extract of Callistemon viminalis. Mater Lett. 2011;65:595–597.
- Coman C, Leopold LF, Ruginǎ OD, et al. Green synthesis of gold nanoparticles by Allium sativum extract and their assessment as SERS substrate. J Nanopart Res. 2014;16:2158. DOI: 10.1007/s11051-013-2158-4
- Elavazhagan T, Arunachalam KD. Memecylon edule leaf extract mediated green synthesis of silver and gold nanoparticles. Int J Nanomedicine. 2011;6:1265–1278.
- Nath D, Banerjee P. Green nanotechnology – a new hope for medical biology. Environ Toxicol Pharmacol. 2013;36:997–1014.
- Geraldes AN, da Silva AA, Leal J, et al. Green nanotechnology from plant extracts:synthesis and characterization of gold nanoparticles. Adv Nanopart. 2016;5:176–185.
- Mata R, Bhaskaran A, Sadras SR. Green-synthesized gold nanoparticles from plumeria alba flower extract to augment catalytic degradation of organic dyes and inhibit bacterial growth. Particuology. 2016;24:78–86.
- Gurunathan B, Bathrinarayanan PV, Muthukumarasamy VK, et al. Characterization of intracellular gold nanoparticles synthesized by biomass of Aspergillus terreus. Acta Metall Sin Engl. 2014;27:569–572.
- Mukherjee S, Sushma V, Patra S, et al. Green chemistry approach for the synthesis and stabilization of biocompatible gold nanoparticles and their potential applications in cancer therapy. Nanotechnology. 2012;23:455103–455116.
- Sonavanea G, Tomodaa K, Makinoa K. Biodistribution of colloidal gold nanoparticles after intravenous administration: effect of particle size. Colloids Surf B. 2008;66:274–280.
- Ankita S, Bhanu S, Arvind G. Synthesis and characterization of dodecanethiol-stabilized gold nanoparticles. Indian J Pure Appl Phys. 2014;52:93–100.
- Ankamwar B, Chaudhary M, Sastry M. Gold nanotriangles biologically synthesized using tamarind leaf extract and potential application in vapor sensing. Synth React Inorg M. 2005;35:19–26.
- Abd El-Aziz ARM. Eco-friendly biosynthesis of silver nanoparticles by Aspergillus parasiticus. Dig J Nanomater Biostruct. 2014;9:1485–1492.
- Kim YH, Carraway ER. Dechlorination of pentachlorophenol by zero valent iron and modified zero valent irons. Environ Sci Technol. 2000;34:2014–2017.
- Vanaja M, Paulkumar K, Baburaja M, et al. Degradation of methylene blue using biologically synthesized silver. Nanoparticles 2014;2014:742346. DOI: 10.1155/2014/742346
- Borja JQ, Cangco LM, Belinda MC, et al. Degradation of dichlorodiphenyltrichloro-ethane (DDT) using zero-valent iron. Paper presented at: De La Salle University Research Congress 2013; 2013 Mar 7–9; Manila, Philippines. Available from: http://www.dlsu.edu.ph/conferences/dlsu_research_congress/2013/_pdf/SEE/SEE-V-040.pdf
- Sibanda MM, Focke WW, Labuschagne FJ, et al. Degradation of insecticides used for indoor spraying in malaria control and possible solutions. Malaria J. 2011;10:307. DOI: 10.1186/1475-2875-10-307
- Segal-Rosenheimer M, Dubowski Y. Photolysis of thin films of cypermethrin using in situ FTIR monitoring: products, rates and quantum yields. J. Photochem Photobiol A. 2008;200:262–269.
- Baudot C, Tan CM, Kong JC. FTIR spectroscopy as a tool for nano-material characterization. Infrared Phys Technol. 2010;53:434–438.
- Piechocki W, Gryglewicz GY, Gryglewicz S. Hydrodechlorination of DDT and chloroalkanes over carbon-supported Ni–Mo catalyst. J Hazard Mater. 2009;163:1397–1402.
- Ukisu Y. Complete dechlorination of DDT and its metabolites in an alcohol mixture using NaOH and Pd/C catalyst. J Hazard Mater. 2008;152:287–292.
- Tian H, Li J, Mu Z, et al. Effect of pH on DDT degradation in aqueous solution using bimetallic Ni/Fe nanoparticles. Sep Purif Technol. 2009;66:84–89.
- Graham LJ, Jovanovic G. Dechlorination of p-chlorophenol on a Pd/Fe catalyst in a magnetically stabilized fluidized bed, implication for sludge and liquid remediation. Chem Eng Sci. 1999;54:3085–3093.
- Engelmann MD, Doyle JG, Cheng IF. The complete dechlorination of DDT by Mg0/Pd bimetallic particles. Chemosphere. 2001;43:195–198.
- Engelmann MD, Hutcheson R, Henscheid K, et al. Simultaneous determination of total PCB and DDT by dechlorination with Fe/Pd and Mg/Pd bimetallic particles and FIDG. Microchem J. 2003;74:19–25.
- Eggen T, Majcherczyk A. Effects of zero-valent iron (Fe0) and temperature on the transformation of DDT and its metabolites in lake sediment. Chemosphere. 2006;62:1116–1125.