
 ?Mathematical formulae have been encoded as MathML and are displayed in this HTML version using MathJax in order to improve their display. Uncheck the box to turn MathJax off. This feature requires Javascript. Click on a formula to zoom.
Abstract
In this paper, we study an extracellular process of a biochemical system such as batch ethanol fermentation system by considering an unstructured kinetic model with four different well-known models for the specific growth rate of the yeast cells. Then, we fit the unstructured models to the experimental data for determining the appropriate model that can capture the dynamic behaviour of the batch ethanol fermentation experimental data. The fitting procedure is proceeded by minimising a least-squared error between the model solutions and the experimental data using a direct search method. Our simulations show that the unstructured model with Aiba-type structured model for the specific growth rate of the yeast cell has the best approximating ability to describe the dynamic of the batch ethanol fermentation data.
Introduction
Renewable energy has become an increasingly interesting research topic in recent years. It plays an important role in providing alternative energy sources with a guarantee of sustainability. Bioethanol is one of the highly recommended energy sources, as it is a renewable and environmentally friendly alternative [Citation1–4]. As one of the renewable and sustainable energy sources, bioethanol has become a potential candidate for replacing fossil fuels, which have greatly contributed to generating high levels of pollution. Along with the development of bioethanol production, optimal production processes and economic feasibility of the ethanol industry are needed. Therefore, optimisation studies through operating the variable design are a common practice in the bioethanol industry, which has an unfeasible complexity.
In studying the optimal production of ethanol, several aspects are investigated, including the fermentation process of the sugars to ethanol performed by yeast. This is a key process in the bioethanol industry where generating a fermentation process with stable performance becomes the biggest challenge for all researchers due to the dependency of the system on the operating variables. Besides that, producing rapid fermentation also becomes the main concern in the ethanol industry.
Several mathematical models have been proposed to investigate the optimal growth of the yeast cells [Citation5–15]. Among the models, the unstructured model is the simple model proposed to describe the growth of yeast cells. A suitable design for the operating parameters of the system can be identified when appropriate models are applied to study the biochemical system. The suitable models are quantified whether they correctly reproduce the dynamic behaviour of the biochemical system. More deeply, the model should fit the experimental data generated from an experimental process. In this research, several models were investigated to find the best model that can capture the behaviour of the experimental data. Four well-known unstructured models were considered to study our batch ethanol fermentation data. We assumed that the yeast cells are entities in solution which interact with the environment in a way that the biomass is described only by its concentration. The four studied models are Monod [Citation15], Tiessier, Aiba [Citation16] and Tyagi [Citation17] model type for the growth of the yeast cells. Our goal was to carry out a comprehensive analysis of the four mathematical expressions for modelling our batch ethanol fermentation data. This study also aims to understand the impact of some modelling assumptions underlying the system and to provide estimation values for the unknown model parameter values.
Materials and methods
Batch ethanol fermentation data
Pretreatment and hydrolysis of the alga Spirogyra
The raw material used in the batch fermentation process was the freshwater alga Spirogyra (carbohydrate content 64%) collected from a pond located in Makassar, Indonesia. The Spirogyra algae were identified under a light microscope (Olympus, Japan; objective 20×, eye-piece 10×) with the help of authoritative literature [Citation18], then dried in an oven at 80 °C for 24 h. Following this, the biomass was crushed and sieved through a 40-mesh size sieve. The dried algal biomass was then hydrolysed by using alpha-amylase enzyme (Novozyme, Denmark).
Fermentation process
The fermentation process was carried out under anaerobic conditions. Anaerobic conditions were ensured using the Hungate technique, namely by injecting nitrogen gas or hydrogen gas into the fermentor. The fermentor was closed with a rubber stopper and then the gas (nitrogen or hydrogen) was supplied for 2 min. After that, the fermentation was carried out without agitation, for a duration according to the study design. After the period of incubation (0, 24, 48 or 72 h), the amount of Saccharomyces cerevisiae biomass, the pH, the reducing sugar concentration and the ethanol concentration were measured. S. cerevisiae was obtained from Indonesian Culture Collection (InaCC), Indonesian Institute of Science, with strain reference number InaCC Y655. Fermentation conditions were inoculum concentration 10% (OD600nm = 0.5), temperature fermentation 30 °C, fermentor volume 100 mL with 50 mL space fermentor, pH 5, initial sugar concentration 10%.
Measurement of Saccharomyces cerevisiae biomass
S. cerevisiae cell biomass measurements were performed using the dry cell weight (DCW) method. The DCW was calculated by first centrifuging 50 mL of fermentation medium at a speed of 9056 g for 10 min. After centrifugation, the supernatant was removed by gentle aspiration using a pipette. After that, the pellet was washed by adding 0.1 mol/L phosphate buffer to the cell pellet, which was centrifuged again at 9056 g for 5 min. The pellets were suspended in distilled water and then aspirated using a pipette and transferred to filter paper with a pore size of 0.47 μm, which had previously been heated in an oven until a constant weight was obtained (W1). Filter papers that contained pellets were then dried in an oven at a temperature of 80 °C for 24 h and weighed (W2). DCW was calculated as the difference between the final weight of the filter paper and the initial filter paper weight (W2−W1), which was expressed as the DCW (g/L).
Measurement of total reducing sugars
Total reducing sugar measurements were performed using the Luff-Schoorl method. Reducing sugars were determined by the reaction of the water-soluble portion of the sample with an excess of standard copper sulphate in alkaline tartrate (Fehling’s solution) under controlled conditions of time, temperature, reagent concentration and composition. The reducing sugar concentration was estimated by the iodometric determination of the unreduced copper remaining after the reaction.
Measurement of ethanol concentration
Measurement of the ethanol concentration was performed using the specific gravity method and gas chromatography method. The fermentation culture was distilled before its specific gravity was measured using a glass pycnometer at room temperature (30 °C). The specific gravity method was used to measure the ethanol content based on the ratio of the density of a substance (distilled fermentation culture) to the density of a reference substance (distilled water). The specific gravity was then determined using a specific gravity table from the Association of Official Analytical Chemists and the ethanol percentage was calculated. From these experimental procedures we obtained the batch fermentation data depicted in .
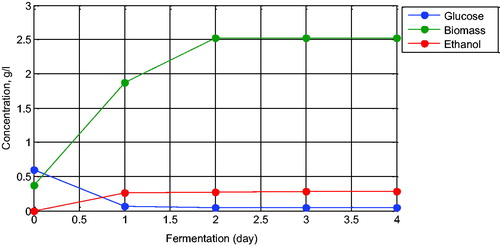
Figure 1. Batch ethanol fermentation data using Saccharomyces cerevisiae over four days of observation.
Kinetic model formulation
We formulated an unstructured model for the yeast cell growth by taking into consideration the glucose concentration, the biomass and the ethanol concentration as the system variables. Our model, in line with the model formulated by Kasbawati et al. [Citation14], did not consider the acetate product. If X defines the concentration of the yeast cells (in g/L) then the cell growth rate can be modelled as follows:
(1)
(1)
where
defines the specific growth rate of the yeast cell. The first bracket in EquationEquation (1)
(1)
(1) represents the logistic growth of the yeast cell with maximum density
(in a population model we may call it a carrying capacity [Citation19]). The second and the third brackets in EquationEquation (1)
(1)
(1) , respectively, represent the inhibition effects of substrate glucose (G) and product ethanol (E) where
and
, respectively, define the measurable saturated concentrations of glucose and ethanol with
and
(see [Citation14] for detailed discussion about the measurable saturated concentrations). For the specific growth rate
, there are several kinds of mathematical expressions known by far that were applied for modelling the specific growth rate of the yeast cells. Some of them are models that were formulated by Monod, Tiessier, Aiba and Ghose & Tyagi [Citation16–18]. Their models are given in . The four models have different formulation terms which were based on their own assumptions.
Table 1. Mathematical expressions for the specific growth rate of the yeast cell ().
The mathematical models for the rate of substrate consumption and the rate of product formation are formulated using the definition of yield coefficients. The yield factor describes the maximum possible yield of yeast cells X and ethanol E with the given glucose concentration G during the observation period. It is mathematically expressed as
(2)
(2)
(3)
(3)
where
and
, respectively, represent the yield coefficients for biomass and ethanol. We assume that there exists a specific uptake rate of substrate and product for maintenance of the yeast cellular processes with the constant uptake rates
and
(in 1/day). Then, by using EquationEquations (1–3) we get the dynamics of the substrate glucose and the product ethanol as follows:
(4)
(4)
(5)
(5)
Therefore from Equations (Equation1(1)
(1) , Equation4
(4)
(4) , Equation5
(5)
(5) ) we have a simultaneous differential equation that describes the dynamics of a batch ethanol fermentation process as follows:
(6)
(6)
with
,
, the specific growth rate
given in and initial concentrations taken from the experimental data X(0) = 0.37 g/L, G(0) = 0.6 g/L and E(0) = 0 g/L.
Estimation procedures
We used an estimation procedure to fit the unstructured model (EquationEquation 6(6)
(6) ) to the batch ethanol fermentation data presented in . The data are fitted using the unstructured models given in EquationEquation (6)
(6)
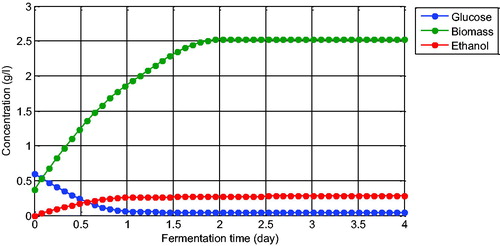
(6) and the equations presented in . Before the estimation procedure, we extrapolate the data with 50 data points such that they are presented smoothly (see ).
Figure 2. Extrapolated ethanol fermentation data with 50 data points.
Solving the fitting problem is similar to solving an estimation of kinetic parameters of the models. The estimation problem involves an optimisation problem whose solutions can be found numerically. To handle the optimisation problem, we then formulate an objective function that will be optimised. It is defined as
(7)
(7)
where xm defines a state vector which consists of the solutions of model [Citation6], xd defines the experimental data vector, and p is a vector of kinetic parameters that will be estimated. The formulated objective function J simply represents the least square error of the data and the model where
is an Euclid norm. The feasible region D for p is defined as
(8)
(8)
where n is the number of estimated kinetic parameters and
are the lower and the upper bound vectors of p, respectively.
Here, the optimisation problem (EquationEquation 7(6)
(6) ) is solved numerically using a direct search method. One of the well-known direct search methods is the Nelder–Mead simplex algorithm [20]; it was provided in Matlab as a toolbox fminsearch function. This algorithm uses a simplex of n + 1 points for n-dimensional vectors x. The algorithm first makes a simplex around the initial guess
by adding 5% of each component
to
, and using these
vectors as elements of the simplex in addition to
. The method is described in detail in [Citation20].
Results and discussion
First, we present the simulation results that describe the fitting results. The four unstructured kinetic models are fitted to the experimental data by estimating their kinetic parameters. presents the estimation results where nine kinetic parameters are estimated for Monod and Tiessier models, ten kinetic parameters are estimated for Aiba model and eight kinetic parameters are estimated for the Ghose and Tyagi kinetic model. We can observe that Monod and Aiba models produce small errors with almost similar error magnitudes. Among the four models, Aiba has the smallest error compared with the other three models with an objective function value around 0.0062. This result indicates that Aiba’s type of specific growth rate model is the best model that can be used to imitate the studied fermentation data. This model successfully captured the behaviour of the fermentation system.
Table 2. Parameter estimation results for the four unstructured fermentation models.
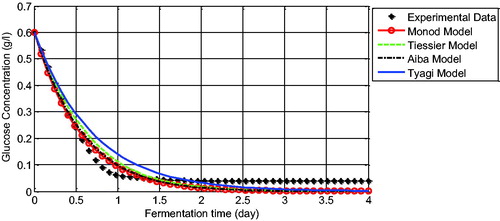
We compared the experimental data and the model solution for glucose concentration (). We can observe that the four glucose models give a good approximation and have captured the experimental data correctly. The unstructured glucose models formulated using Monod, Tiessier and Aiba models have solutions that coincide each other. Conversely, the solution of the Tyagi model for glucose is not so close to the data. However, this model is also successful in capturing the trend of the glucose data.
Figure 3. Comparison between experimental data and the model solution for glucose concentration.
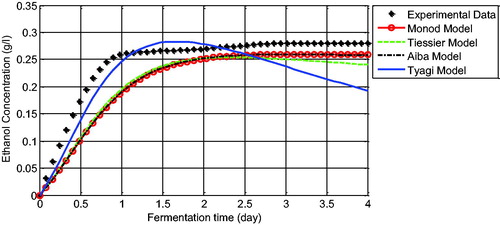
The graphs of the comparison of the biomass concentration data with the unstructured model solutions show that the solutions of the models present a similar behaviour in which they have successfully captured the dynamics of the yeast cell growth with small errors (). Different simulation results are found at the comparison of the ethanol data with ethanol model solutions. In , almost all models are not exactly in line with the data. However, the errors of each model can still be tolerated since they can capture the behaviour of the ethanol data except for Tyagi’s model, which is really different at the end of the fermentation time (see the solid blue line at ). Tyagi’s model failed to imitate the characteristics of the ethanol data after 1.5 days (36 h) of observation. This is probably due to the growth inhibition by the product that influences the solution of Tyagi’s model. This effect was also observed by Kostov et al. [Citation21] where Tyagi’s model was not suited to their yeast cell data, which may also be influenced by product inhibition. This observation illustrates that some mathematical models are successfully used in approximating experimental data but others are not. For instance, the cell growth model formulated by Monod successfully described the experimental data in this study as well as the experimental data reviewed by Kostov et al. [Citation21]. On the other hand, Aiba’s growth model successfully approached our experimental data, whereas in Kostov et al. [Citation21], it was only able to follow the trend of their experimental data. These results indicate that generating a mathematical model for the ethanol fermentation system should adopt the specific conditions of the system, such as any inhibition effects and limiting growth rate of the yeast cells. Therefore, the ability of Aiba’s growth model in approximating the dynamics of our batch ethanol fermentation data allows us to study further the optimal design of the operating parameters for control of the batch fermentation system such that maximal ethanol concentration can be produced. The operating parameters can be refer to the initial concentration of glucose and the length of the fermentation time. These will be subject to the future research.
Figure 4. Comparison between experimental data and the model solution for biomass concentration.
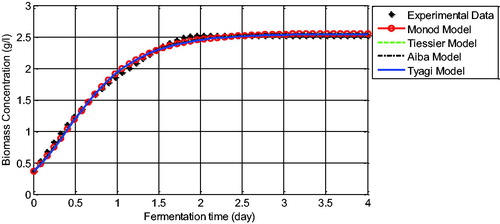
Figure 5. Comparison between experimental data and the model solution for ethanol concentration.
Conclusions
We generated four unstructured kinetic models for a fermentation system with different specific growth rates of the yeast cells. Four specific growth rate models, Monod model, Tiessier model, Aiba model and Tyagi model, were fitted to the batch fermentation experimental data. The four models are well-known models in studying the growth of yeast cells in a fermentation system. Using an optimisation procedure, we estimated the kinetic parameters of the model and we found that among the four models, the Aiba model was the best model in approximating the dynamic behaviour of the experimental data for glucose, biomass and ethanol concentration. These results provided the basis for more comprehensive studies for optimisation of the production of ethanol as the main product in the fermentation process. This study also provided the estimation values for the set of kinetic parameters of the batch fermentation system.
Disclosure statement
No potential conflict of interest was reported by the author(s).
Additional information
Funding
References
- Bai FW, Anderson W, Moo-Young M. Ethanol fermentation technologies from sugar and starch feedstocks. Biotechnol Adv. 2008;26:89–105.
- Lin Y, Tanaka S. Ethanol fermentation from biomass resources: current state and prospects. Appl Microbiol Biotechnol. 2006;69:627–642.
- Mussatto SI, Dragone G, Guimarães PM, et al. Technological trends, global market, and challenges of bio-ethanol production. Biotechnol Adv. 2010;28(6):817–830.
- Sulfahri, Nímatuzahroh, Manuhara SW. Studies on the Hungate technique for ethanol fermentation of algae Spirogyra hyalina using Saccharomyces cerevisiae. Biofuels. 2017;8(3):367–372.
- Birol G, Doruker P, Kirdar B, et al. Mathematical description of ethanol fermentation by immobilised Saccaromyces cerevisiae. Process Biochem. 1998;33(7):763–771.
- Lei F, Rotboll M, Jorgensen SB. A biochemically structured model for Saccharomyces cerevisiae. J Biotechol. 2001;88(3):205–221.
- Mhaskar P, Hjortsø M, Henson M. Cell population modeling and parameter estimation for continuous cultures of Saccharomyces cerevisiae. Biotechnol Prog. 2002;18:1010–1026.
- Henson MA. Dynamic modeling and control of yeast cell populations in continuous biochemical reactors. Comput Chem Eng. 2003;27(8-9):1185–1199.
- Walther T, Reinsch H, Grosse A, et al. Mathematical modeling of regulatory mechanisms in yeast colony development. J Theor Biol. 2004;229(3):327–338.
- Paz Astudillo IC, Cardona Alzate CA. Importance of stability study of continuous systems for ethanol production. J Biotechnol. 2011;151(1):43–55.
- Jia G, Stephanopoulos G, Gunawan R. Ensemble kinetic modeling of metabolic networks from dynamic metabolic profiles. Metabolites. 2012;2(4):891–921.
- Kasbawati, Gunawan AY, Hertadi R, et al. Effects of time delay on the dynamics of a kinetic model of a microbial fermentation process. ANZIAM J. 2014;55(4):336–356.
- Kasbawati, Gunawan AY, Hertadi R, et al. Metabolic regulation and maximal reaction optimization in the central metabolism of a yeast cell. AIP Conf Proc. 2015;1651:75–85.
- Kasbawati, Gunawan AY, Sidarto KA. Washout and non-washout solutions of a system describing microbial fermentation process under the influence of growth inhibitions and maximal concentration of yeast cells. Math Biosci. 2017;289:40–50.
- Monod J. The growth of bacterial cultures. Ann Rev Microbiol. 1949;3:371–394.
- Aiba S, Shoda M, Nagatani M. Kinetics of product inhibition in alcoholic fermentation. Biotechnol Bioeng. 1968;11:846–864.
- Ghose T, Tyagi R. Rapid ethanol fermentation of cellulose hydrolysate. II. Product and substrate inhibition and optimization of fermentor design. Biotechnol Bioeng. 1979;21:1401–1420.
- Zarina A, Hasana MU, Shameel M. Diversity of the genus Spirogyra (Zygnemophyceae shameel) in the North-Eastern areas of Pakistan. Proc Pakistan Acad Sci. 2007;44(4):225–248.
- Kargi F. Re-interpretation of the logistic equation for batch microbial growth in relation to Monod kinetics. Lett Appl Microbiol. 2009;48:398–401.
- Lagarias JC. Convergence properties of the nelder-mead simplex method in low dimensions. SIAM J Opt. 1998;9(1):112–147.
- Kostov G, Popova S, Gochev S, et al. Modeling of batch alcohol fermentation with free and immobilized yeasts Saccharomyces cerevisiae 46 EVD. Biotechnol Biotechnol Equip. 2012;26(3):3021–3030.