
Abstract
Leucocalocybe mongolica (S. Imai) X.D. Yu &Y.J. Yao is an endemic mushroom with a distribution in Mongolian Plateau. It is an important edible and medicinal mushroom which is often collected unscrupulously. Wild L. mongolica is facing an unprecedented threat and is in a critically endangered state. Exploration of the genetic diversity and population structure of L. mongolica is important for conservation biology. The main distribution areas were investigated. In total, 402 alleles of 223 individuals from 17 wild geographical populations were obtained based on the eight simple sequence repeat loci. The total number of alleles from each population ranged from 11 to 31 with an average of 24 per population. The average observed heterozygosity (HO) and expected heterozygosity (HE) ranged from 0.300 to 0.875 and from 0.188 to 0.621, respectively. Analysis of molecular variance (AMOVA) indicated that 14.19% of the total molecular variance could be attributed to differences between populations (p <.001), whereas 85.81% to differences within populations. The mean genetic distance (FST) value of 0.171 suggested low genetic differentiation among populations. The UPGMA dendrogram generated from the SSR data suggested that the 17 populations separated into three main sister clusters on the Nei's genetic identity coefficient 0.8. The 223 L. mongolica individuals were divided into three groups by STRUCTURE analysis. Keeping and enriching the population diversity is crucial for the conservation of L. mongolica. The data about the population structure and genetic diversity obtained in this study will facilitate the establishment of conservation measures.
Abbreviations
AMOVA: analysis of molecular variance; Dest: estimator of actual differentiation; EST-SSR: Expressed sequence tag- simple sequence repeats; Fis: Inbreeding coefficient; Fit: total inbreeding coefficient; Fst: fixation index; GST coefficient of gene differentiation; G’ST: standardized measure of genetic differentiation; HE: expected Heterozygosity; H0: observed heterozygosity; HS: mean genetic diversity within populations; HT: total genetic diversity for species; I: Shannon’s diversity index; km: kilometer; L. mongolica: Leucocalocybe mongolica; N: sample size; NA: number of average alleles; NE: number of effective alleles; Nm: gene flow; NP: number of private alleles; NR: allelic richness; NT: number of total alleles; PCoA: principal coordinate analysis; PIC: polymorphism information content; PPB: Percentage of polymorphic loci; TP-M13-SSR: tailed primer M13; UHE: unbiased expected Heterozygosity
Introduction
Leucocalocybe mongolica (S. Imai) X.D. Yu &Y.J. Yao is an endemic species in Mongolian Plateau. Photographs of its ecological environment are shown in Supplementary Figure S1. Leucocalocybe mongolica is distributed in the steppe of Inner Mongolia of China, Mongolia. It can be used to make delicacies and has high popularity throughout East Asia. Leucocalocybe mongolica was once called Tricholoma mongolicum S. Imai [Citation1]. The genus of Leucocalocybe was established because of some peculiarities in the morphological and molecular characteristics of L. mongolica [Citation2, Citation3]. As the only member of a mono-species genus, L. mongolica is of great value. At the same time, the basidiocarp is used as a folk medicine by Mongolians and Evenks believe that the basidiocarps can be used in the treatment of botulism and wounds, detoxification and anesis of blood-heat syndrome [Citation4]. Natural products of potential pharmaceutical value have been extracted from basidiocarps or fermentation mycelia of L. mongolica, such as ergosterol, ergosterol peroxide, polysaccharide and lectins, which have been tested for biological activity, with some encouraging results [Citation5–14].
Owing to its special habitat, L. mongolica has a restricted area of distribution [Citation15]. Lacking a substantial breakthrough in its artificial domesticated cultivation, the sustainable use of resources has been seriously restricted. Leucocalocybe mongolica forms fruitbody only within a short timeframe, from June to September, accompanied by copious rainfall. Because the habitat is grassland and belongs to the arid or semiarid areas, the precipitation here does not meet the demand for fruiting. The habitat of L. mongolica is facing severe challenges, such as grassland degradation for overgrazing and grassland desertification [Citation16]. In addition, L. mongolica is constantly being gathered by the local people and petty dealers, as the L. mongolica is in short supply and cannot meet the demand in a commercial trade. Leucocalocybe mongolica faces an unprecedented threat with scarcer and scarcer wild resources. The mushroom is now extremely endangered.
Exploration of the genetic diversity and population structure is a key step in conservation biology towards accelerating the development of a reasonable conservation strategy. However, to our knowledge, few efforts in this direction have been made in L. mongolica. In this study, we used microsatellites, or simple sequence repeats (SSRs), to study the population structure and genetic diversity of L. mongolica. As molecular markers, SSRs possesses the advantages of high polymorphism, abundant informativeness, simplicity and presence throughout the genome. Here, we used a set of SSRs identified and characterized in our previous work [Citation16].
Materials and methods
Ecological investigation and sample collection
This study included 223 L. mongolica samples from 17 wild geographical populations. The geographical populations were separated from one to another by at least 40 km, except for population 5 (ZK). The geographic distance between the central points of the 17 populations is presented in Supplementary Table S1). The geographic distance between the central points of pop5 (ZK) and pop4 (XL) is 28.41 km. Pop5 is a special sampling site, because it is located in the Inner Mongolia Grassland Ecosystem Research Station of the Chinese Academy of Sciences and as an isolated sample plot for continuous scientific research. All samples were collected in China and Mongolia from July 2015 to August 2017 () and preserved in the Herbarium of Mycology of Jilin Agriculture University (HMJAU), under the Engineering Research Center of Chinese Ministry of Education for Edible and Medicinal Fungi in Jilin Agricultural University. The closest distance between individuals was supposed to be greater than 30 m.
Table 1. Sampling information for Leucocalocybe mongolica wild populations.
DNA extraction and PCR amplification
Genomic DNA of basidiocarps was extracted using the Rapid Fungi Genomic DNA Isolation Kit (Sangon Biotech Shanghai Co. Ltd). A Quawell micro volume spectrophotometer Q5000 was used for detecting the DNA concentration and purity. DNA integrity was analysed through electrophoresis on 1.2% agarose gels. The DNA quality requirements included optical density of OD260/280≥1.8, an electrophoresis result with a clear band and DNA concentration of 4 ng/mL or more.
Previously, 1860 SSRs were identified as molecular markers for L. mongolica by de novo assembly of the transcriptome [Citation16]. One hundred and eight SSRs were selected randomly from 1860 SSRs. Eight EST-SSR primers that showed polymorphism were developed () from 108 alternative EST-SSR primers. The 8 EST-SSR primers were designed according to the eight sequences (Supplementary Table S2).
Table 2. Characteristics of eight microsatellite loci used in the study.
SSRs with a tailed primer M13 (TP-M13-SSR) [Citation17–19] were used in detecting the size of the PCR products. The PCR amplification system and program of fluorescence primer are described in . The PCR products were analyzed by ABI 3730xl DNA analyzer (capillary type: ABI 4331246,50 cm,96 channels).
Table 3. PCR amplification system with fluorescent primer.
Table 4. PCR amplification program with fluorescent primer.
Data analysis
The parameters related to genetic diversity, including NA (number of average alleles), NE (number of effective alleles), I (Shannon's diversity index), HO (observed heterozygosity), HE (expected heterozygosity), UHE (unbiased expected heterozygosity), Fis (inbreeding coefficient), Fit (total inbreeding coefficient), Fst (fixation index), PPB (percentage of polymorphic loci), HS (mean genetic diversity within populations), HT (total genetic diversity for species), GST (coefficient of gene differentiation), G'ST (standardised measure of genetic differentiation), Dest (estimator of actual differentiation) were calculated using GenAlEx v6.5 [20]. NT (number of total alleles) and NP (number of private alleles) were calculated by Arlequin V3.5.2.2 [Citation21]. NR (allelic richness) was calculated by ADZE [Citation22]. Pic (polymorphism information content) was determined using Cervus3.0.7 [Citation23]. Gene flow (Nm) was computed by using the formula Nm = (1–FST)/4FST. Eight loci were used to test whether they were suitable for the linkage disequilibrium and Hardy–Weinberg equilibrium in GENEPOP Web Version 4.0.10 [Citation24,Citation25]. Microchecker software was used to detect null alleles and typographic errors.
Principal coordinate analysis (PCoA) was implemented by software GenAlEx v6.5 [Citation20]. Mantel test between genetic distance (Fst) and geographical distance (Km) was performed by GenAlEx v6.5 [Citation20]. Analysis of molecular variance (AMOVA) was performed in Arlequin V3.5.2.2 [Citation21].
The genetic structure of 17 populations was analysed by STRCTURE 2.3.4 [Citation26] with the admixture mode. K-values ranging from 2 to 11 were tested by setting the length of burnin period at 100,000 and the number of MCMC reps after burnin at 10000. The deltaK method [Citation27] was implemented in Structure Harvester and the results were processed by CLUMPP [Citation28]. The optimal clusters of populations were reflected on the map by the Pie function of R language.
Furthermore, Nei's genetic identity coefficient between all pairs of populations was determined by POPULATIONS Version 1.2.31 (http://bioinformatics.org/∼tryphon/populations/). The dendrogram of the genetic relationship among the 17 populations was acquired based on Nei's genetic identity by applying the unweighted pair group method with arithmetic means (UPGMA) using NTSYSpc v2.2 [Citation29].
The mantel test between genetic distance (FST) and geographical distance was performed using Arlequin V3.5.2.2 [Citation21]. Population average pairwise differences were determined by Arlequin V3.5.2.2 [Citation21]. Genetic structure indices at estimating weighted FST statistics over all loci [Citation30,Citation31] were used.
Results and discussion
Index of genetic diversity
The genetic parameters for Leucocalocybe mongolica wild populations are shown in . In total, 402 alleles of 223 individuals from 17 wild populations were obtained based on 8 microsatellite loci. The numbers of total alleles per population ranged from 11 (DW) to 31 (EQ) with an average of 24 per population. The average number of private alleles was 0.412. Populations BK and CQ both had two private alleles, HT, WS and MG each had only one, while the rest of the populations had none. On account of the population size differences, three biodiversity indices: allelic richness (NR), number of average alleles (NA) and number of effective alleles (NE), should more accurately reflect the genetic diversity of the 17 populations. From the three-index perspective, DW was the population with the lowest genetic diversity. But the population with the highest genetic diversity levels was different depending on each of the three indices: the highest NR was 3.495 (WS), the highest NA was 3.875 (EQ and HS) and the highest NE was 2.724 (ZQ). Shannon's information index (I) varied from 0.26 to 1.087 with a mean of 0.815. The observed heterozygosity (HO) ranged from 0.300 to 0.875 with an average of 0.514 and the expected heterozygosity (HE) ranged from 0.188 to 0.621 with an average of 0.477. All quantitative values of the unbiased expected heterozygosity (UHE) showed an overall trend similarly to the expected heterozygosity (HE). The coefficient of inbreeding (FIS) ranged from –1 to 0.187. The percentage of polymorphic loci (PPB) can be used as a marker to reflect the genetic diversity richness: DW, AB, XL and ZK were with lower richness than the average value 92.6%.
Table 5. Genetic parameters for Leucocalocybe mongolica wild populations.
The characteristics on the eight microsatellite loci are given in . The numbers of total alleles per locus ranged from four (S11 and S87) to eight (S08) with an average of five per locus. The locus S08 had two private alleles; S03, S05, S09, S32 and S87 each had only one, while S11 and S59 had none. S08 had the highest average number of alleles (NA), number of effective alleles (NE) and Shannon's information index (I). Whereas HO ranged from 0.343 (S87) to 0.733 (S11), HE ranged from 0.359 (S32) to 0.577 (S08) and UHE ranged from 0.373 (S32) to 0.603 (S08). The inbreeding coefficient (FIS) ranged from –0.276 to 0.198; the total inbreeding coefficient (FIT) ranged from –0.135 to 0.299; the fixation index (FST), which reflects the degree of genetic differentiation, ranged from 0.109 to 0.259 with an average of 0.171 per locus, indicating a lower level of genetic diversity.
Table 6. Genetic parameters of eight SSR marks in L. mongolica.
The genetic diversity reflects the adaptiveness of each species to environmental changes. High level of genetic diversity implies higher survivability to harsh natural circumstances. Individuals with more abundant variation will have greater variability of alleles associated with adaptation to the environmental changes. With changing environmental conditions, the population will spread on account of the individuals with more variation [Citation32–34]. The mean Fst value of 0.171based on 8 loci in L. mongolica suggests low genetic difference among the 17 populations. It is lower than that of Armillaria luteovirens (Fst = 0.176) in Qinghai-Tibet plateau [Citation35] and much lower than that of Laccaria amethystina (Fst = 0.416) between Japanese populations and European populations [Citation36].
Nm at at each locus ranged from 0.716 (S32) to 2.04 (S59), with an average of 1.372 per locus. The highest polymorphism information content (PIC) was 0.693 (S08), and the lowest value was 0.385 (S05). The mean genetic diversity within populations (HS) ranged from 0.359 to 0.577 with an average of 0.477 per locus. The average total genetic diversity of species (HT) was 0.575. The coefficient of gene differentiation (GST), standardised measure of genetic differentiation (G'ST), estimator of actual differentiation (Dest) were introduced to assess the level of genetic differentiation; their average values were, respectively, 0.135, 0.284 and 0.165, indicating a lower level of genetic divergence.
Genetic structure of populations
The genetic structure analysis based on the clustering algorithm by STRUCTURE suggested a possible sectionalisation was K = 3 (), which justified by the fact that the 223 individuals were divided into three groups (). The integral distributional situation of the three groups was mapped to the 17 geographic populations on the map ().
Figure 1. Distribution of DeltaK ranging from 2 to 11 by STRUCTURE analysis.
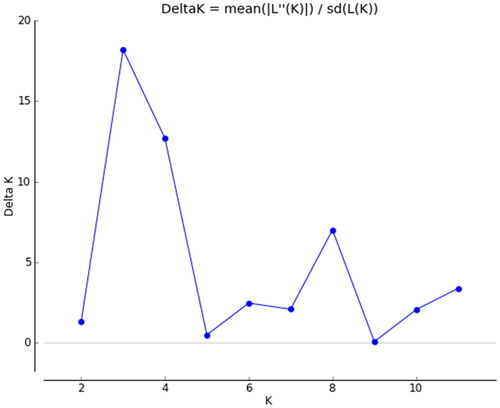
Figure 2. Clusters of individuals by STRUCTURE analysis at K = 3.
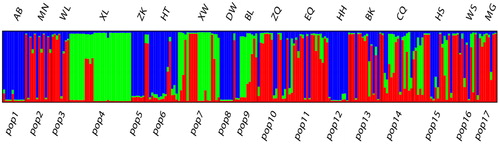
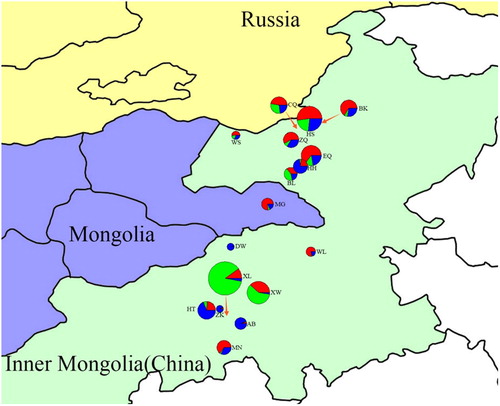
Figure 3. Clusters of populations on the map by STRUCTURE analysis at K = 3. The area of pie graphs is proportional to the sample size of the population. Source : National earth system science data sharing infrastructure (URL: http://www.geodata.cn/).
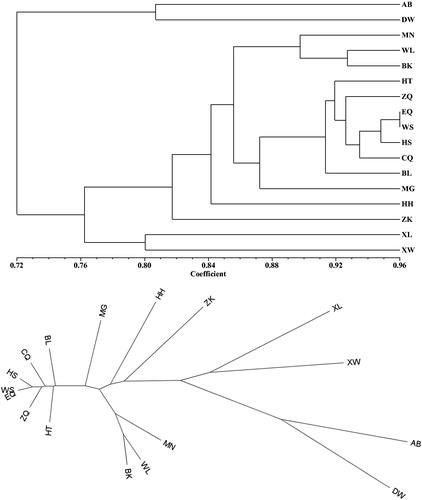
The genetic identity coefficient between populations varied from 0.5249 (AB,XW) to 0.9641 (EQ,WS). The UPGMA dendrogram () indicated that the 17 populations were divided into three main sister clusters based on Nei's genetic identity coefficient 0.8. The first cluster contained the populations AB and DW. The lowest value of Shannon's information index (I) was attributed to population DW (0.260) and AB (0.442). In addition, the unbiased expected heterozygosity (UHE) also had the lowest value in these two populations (DW 0.205 and AB 0.284). They are marginal populations on the boundary of the distribution area in Xilin Gol grassland. Although the sample collection plan was designed so as the closest individual distance to be greater than 30 m, the sampling regions of the geographic populations AB and DW are quite restricted. They are isolated and small. The phenomenon of habitat fragmentation emerged. The population AB situated on the edge of Otindag sandy land, is also frequently plagued by ecological stress. The population DW located on the edge of Ujimqin flat grassland, suffers from stresses such as drought and overgrazing. Habitat fragmentation is mostly depicted as a landscape-scale process concerning both habitat loss and the division of habitat. Empirical studies so far reveal that habitat loss has significant, continuingly negative impacts on biodiversity. On the contrary, habitat fragmentation has relatively lesser effects on biodiversity [Citation37].
Figure 4. UPGMA dendrogram based on Nei's genetic identity among 17 populations in L. mongolica. Rectangular (A) and radial (B) tree layout.
The second cluster contained populations XL and XW. They are geographically neighboring populations with a similar population structure; their main distribution area is Xilin Gol grassland. This cluster occupied a larger area in the pie graphs (). Wild individuals from the same geographic origins possess similar genetic components [Citation38].
The remaining 13 populations could be roughly assigned into a cluster by Nei's genetic identity coefficient 0.8 and the 13 populations can also be divided into 5 subclusters by Nei's genetic identity coefficient 0.89. The 5 subclusters were respectively as follows: (1) ZK; (2) HH; (3) MN, WL and BK; (4) MG; and (5) HT, ZQ, EQ, WS, HS, CQ and BL. We conducted further analysis on the 5 subclusters. Subcluster (1) has a habitat of a special area surrounded by a fence for scientific research, so it can be considered as a peculiar small population. The living environment of subcluster (2) and (3) suffered various ecological threats or ecological disturbance. There is an open pit mine, attracting a large number of immigrants. Despite the high genetic diversity of the population BK, the clustering analysis indicated that it grouped with populations MN and WL. The habitat of MN is undergoing slight land sandification. Furthermore, WL’s habitat suffers from grassland degradation. Subclusters (4) and (5) possess a suitable habitat. That was regarded as the centre of genetic diversity of L. mongolica.
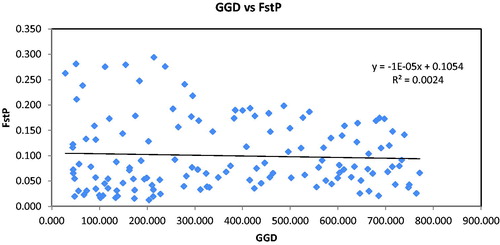
As another method to explore the relationships among the 17 populations, we conducted principal coordinate analysis (PCoA). The two principal axes explained 49.05% and 82.18% of the total variance, respectively (). The Mantel test () revealed no statistical significance between the genetic distance (FST) and geographical distance (r = 0.049, p =.28); in other words, the genetic distances (FST) were not correlated with the geographical distances between the populations of L. mongolica. According to the UPGMA dendrogram (), the clusters of populations poorly corresponded to the geographical distance. However, the genetic diversity, population structure and habitat conditions are considered more relevant. When the habitats of L. mongolica are in a state of destruction, ecological stress can cause changes of population structure. Some allele loss may occur under the influence of unfavourable environmental conditions. Ecological stress plays a vital role in founder effect when habitat degradation causes ecological fragmentation. This will accelerate the change of population structure. We speculate that such environmental change can drive natural evolution in fungi as previously reported in annual plants [Citation39].
Figure 5. Principal coordinate analysis (PCoA) of 17 populations of L. mongolica based on 8 SSR markers.
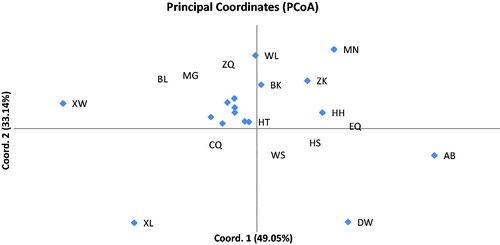
Figure 6. Mantel test between genetic distance (FST) and geographical distance (km) among 17 populations of L. mongolica based on “Isolation by Distance” analyses (r = −0.049; p = 0.28).
Likewise, AMOVA analysis grouped by lineages indicated that 11.57% of the molecular variance was between groups and only 7.9% was between populations. For total populations, 14.19% of the total molecular variance was attributable to variance between populations (p < 0.001), whereas the rest (85.81%) was due to differences within populations (Supplementary Table S3). A similar proportion was observed in Tricholoma matsutake: 80% and 20% of the overall genetic variation were respectively partitioned within and among populations [Citation40]. The vast majority of total molecular variance existed within populations. It could be because of a relatively greater gene flow (Nm = 1.375) between L. mongolica populations (geographic distance between populations of 28.41–771.29 km). The distribution range of L. mongolica is limited. In this region, the basidiospores of L. mongolica are competent for transport by wind and living beings, so as to decrease the genetic differences among populations. That could further explain why the genetic distances (FST) were not correlated with the geographical distance of the populations in our study. Figure S2 shows the average pairwise differences in the populations.
Macrofungi, due to their distinctive life cycle, grow for the larger part of their life cycle in the form of mycelium in deep, humus-rich soil form. It is difficult to make a clear-cut distinction between the population and an individual. The macroscopical basidiocarp occurs only for a brief period, for the purpose of sexual reproduction. Dicaryophytic mycelium growth and the dissemination of basidiospores, all contribute to the growth of mushroom populations [Citation41]. The definition of a population and an individual mushroom is a pendent challenge in mycology. In our survey, the sampling scheme was developed in such a way that the closest basidiocarp distance was supposed to be greater than 30 m. However, since most of the fungal thallus consists of a network of anastomosing hyphae embedded in the substratum, the clonal “individual” is difficult to define [Citation42]. After studying the natural population of the Oyster Mushroom Pleurotus ostreatus, the basidiospore dispersal genetic mechanism needs further studies to determine the extent of different mating patterns between individuals in the population [Citation43].
Conclusions
In this study, out of 108 SSRs, 8 polymorphic SSRs were detected by acrylamide gel electrophoresis. The products amplified by 8 polymorphic SSR primers were separated by capillary electrophoresis as a more accurate test method suitable for the size of PCR products. The EST-SSRs were successfully applied to reveal genetic diversity and population structure of Leucocalocybe mongolica. Keeping and enriching the population diversity is crucial for the conservation of L. mongolica. The obtained data will accelerate the establishment of appropriate conservation measures.
Acknowledgements
The authors would like to express their gratitude to Professor Mei Ya and Doctor Liang Guo (Xilin Gol Institute of Bioengineering) ; Professor Zhengfeng Wang (South China Botanical Garden, Chinese Academy of Sciences) ; Lan Mu and Richa Hu (Keshikten Banne); Bixirile Gao (Mongolia National Middle School of East Ujimqin Banner); Nayuan Wang and Shuyang Bian (Baiyinxile Ranch, Xilinhot); Xiaohui Sun (West Ujimqin Banner); Baoquan Wang and Hashenchaolu (Wubuerbaolige Sumu, New Barag Left Banner); Xi Hong (53 Ranch, New Barag Right Banner); Kaihua Bao (Manzhouli).
Disclosure statement
No potential conflict of interest was reported by the authors.
Additional information
Funding
References
- Imai S. On an edible mongolian fungus “Pai-mo-ku.”. Proc Imper Acad Tokyo. 1937;13(7): 280–282.
- Yu XD, Deng H, Yao YJ. Leucocalocybe, a new genus for Tricholoma mongolicum (Agaricales, Basidiomycota). Afr J Microbiol Res. 2011;5(31):5750–5756.
- Dong D, Bau T. A study on the taxonomic position of Tricholoma mongolicum. J Fungal Res. 2013;11(3):172–5175.
- Wu N, Chun L, Khasbagan. Ewenki folk medicinal plants and its comparison with Mongolian medicine. Chin J Ethnomed Ethnopharm. 2009;17:156–158.
- Bao L, Bai HP, Sa CF, et al. Antioxidant activity and vascular protecting effect of Tricholoma mongolicum polysaccharide. J Inner Mongolia Univ. 2014;45:498–501.
- Wang HX, Ng TB, Ooi VEC. Lectin activity in fruiting bodies of the edible mushroom Tricholoma mongolicum. Iubmb Life. 1998;44(1):135–141.
- Yao QZ, Wang F, Qu ZZ, et al. Study on the extraction technology of lectins from the mycelium produced by submerged fermentation of Tricholoma mongolicum. Acta Agr Boreali-Sinica. 2007;22:79–82.
- Wang HX, Liu WK, NgTB, et al. The immunomodulatory and antitumor activities of lectins from the mushroom Tricholoma mongolicum. Immunopharmacology. 1996;31:205–211.
- Liu F, Ng TB, Wang HX, et al. Lectin from Tricholoma mongolicum S. Imai (Agaricomycetideae) mycelia stimulates gene expression of immunomodulating cytokines in mouse peritoneal macrophages and splenocytes. Int J Med Mushroom. 2005;7:243–248.
- Wang HX, Ooi VEC, Chang ST, et al. A polysaccharide–peptide complex from cultured mycelia of the mushroom Tricholoma mongolicum with immunoenhancing and antitumor activities. Biochem Cell Biol. 1996;74:95–100.
- Wang HX, Ng TB, Ooi VEC, et al. Actions of lectins from the mushroom Tricholoma mongolicum on macrophages, splenocytes and life-span in sarcoma-bearing mice. Anticancer Res. 1997;17:419–424.
- Wang HX, Ng TB, Liu WK, et al. Isolation and characterization of two distinct lectins with antiproliferative activity from the cultured mycelium of the edible mushroom Tricholoma mongolicum. Int J Pept Res Ther. 1995;46:508–513.
- Wang HX, Ooi VEC, Ng TB, et al. Hypotensive and vasorelaxing activities of a lectin from the edible mushroom Tricholoma mongolicum. Pharmacol Toxicol.1996;79:318–323.
- Zhao YX, Wu XL, Huang SZ. Advance on chemical constituents and bioactivity of the medicinal fungi in China. Guizhou Sci. 2013;31(1):18–27.
- Lu T, Bau T, Ohga S. Physiological study of the wild edible mushroom Leucocalocybe mongolica. J Fac Agr Kyushu U. 2017;62(1):1–8.
- Lu T, Bau T. De novo assembly and characterization of the transcriptome of a wild edible mushroom Leucocalocybe mongolica and identification of SSR markers. Biotechnol Biotechnol Equip. 2017;31(6):1148–1159.
- Oetting WS, Lee HK, Flanders DJ, et al. Linkage analysis with multiplexed short tandem repeat polymorphisms using infrared fluorescence and M13 tailed primers]. Genomics. 1995;30(3):450–458.
- Schuelke M. An economic method for the fluorescent labeling of PCR fragments. Nat Biotechnol. 2000;18(2):233–234.
- Ma K H, Lee G A, Lee S Y, et al. Development and characterization of new microsatellite markers for the oyster mushroom (Pleurotus ostreatus). J Micopbiol Biotechn. 2009;19(9): 851–857.
- Peakall R, Smouse PE. GenAlEx 6.5: genetic analysis in Excel. Population genetic software for teaching and research—an update. Bioinformatics. 2012;28(28):2537–2539.
- Excoffier L, Lischer H. Arlequin suite ver 3.5: a new series of programs to perform population genetics analyses under Linux and Windows. Mol Ecol Resour. 2010;10(3):564.
- Szpiech Z A, Jakobsson M, Rosenberg N A. ADZE: a rarefaction approach for counting alleles private to combinations of populations. Bioinformatics. 2008;24(21): 2498–2504.
- Slate J, Marshall T, Pemberton J. A retrospective assessment of the accuracy of the paternity inference program CERVUS. Molecular Ecology. 2000;9(6): 801–808.
- Raymond M, Rousset F. GENEPOP (Version 1.2): Population genetics software for exact tests and ecumenicalism. J Heredity. 1995;83:239.
- Rousset F. genepop’007: a complete re-implementation of the genepop software for Windows and Linux. Mol Ecol Res. 2008;8(1):103–106.
- Pritchard J K, Stephens M, Donnelly P. Inference of population structure using multilocus genotype data. Genetics.2000;155(2):945–959.
- Evanno G, Regnaut S, Goudet J. Detecting the number of clusters of individuals using the software STRUCTURE: a simulation study. Mol Ecol. 2005;14(8):2611–2620.
- Jakobsson M, Rosenberg N A. CLUMPP: a cluster matching and permutation program for dealing with label switching and multimodality in analysis of population structur. Bioinformatics. 2007;23(14):1801–1806.
- Rohfl F J. Phylogenetic models and reticulations. J Classification. 2000;17(2):185–189.
- Weir B S, Cockerham C C. Estimating F-statistics for the analysis of population structure. Evolution. 1984;38(6):1358–1370.
- Michalakis Y, Excoffier L. A generic estimation of population subdivision using distances between alleles with special reference for microsatellite loci. Genetics. 1996;142(3):1061–1064.
- Avise, J.C., Hamrick, J L. Conservation genetics: Case history from nature. 1st ed. New York (USA): Chapman & Hall, New York; 1996
- Groom MJ, Meffe GK, Carroll CR. Principles of conservation biology. 3rd ed. Sunderland, MA (USA): Sinauer Associates Inc; 2006.
- Sahney S, Benton MJ, Ferry PA. Links between global taxonomic diversity, ecological diversity and the expansion of vertebrates on land. Biol Lett. 2010;6(4):544.
- Xing R, Gao Q, Zhang F, et al. Genetic diversity and population structure of Armillaria luteo-virens (Physalacriaceae) in Qinghai-Tibet Plateau revealed by SSR markers. Biochem Ssyt Ecol. 2014;56:1–7.
- Vincenot L, Nara K, Sthultz C, et al. Extensive gene flow over Europe and possible speciation over Eurasia in the ectomycorrhizal basidiomycete Laccaria amethystina complex. Mol Ecol. 2012;21(2):281–299.
- Fahrig L. Effects of habitat fragmentation on biodiversity. Annu Rev Ecol Evol S. 2003;34(2):487–515.
- Xiao BL, Bang F, Jing L, et al. Genetic diversity and breeding history of Winter Mushroom (Flammulina velutipes) in China uncovered by genomic SSR markers. Gene. 2016;591(1):227–235.
- Yakub M, Tiffin P. Living in the city: urban environments shape the evolution of a native annual plant. Global Change Biol. 2017;23(5):2082–2089.
- Zeng DF, Chen B. Genetic variability and bottleneck detection of four Tricholoma matsutake populations from northeastern and southwestern China. Environ Microbiol. 2015;17(8):2870–2881.
- Liang Y, Guo L, Ma K. Genetic structure of a population of the ectomycorrhizal fungus Russula vinosa in subtropical woodlands in southwest China. Mycorrhiza. 2004;14(4): 235–240.
- Anderson J B. The fungus Armillaria bulbosa is among the largest and oldest living organisms. Nature. 1992;356(6368):428–431.
- Kay E, Vilgalys R. Spatial distribution and genetic relationships among individuals in a natural population of the oyster mushroom Pleurotus ostreatus. Mycologia. 1992;173–182.