
 ?Mathematical formulae have been encoded as MathML and are displayed in this HTML version using MathJax in order to improve their display. Uncheck the box to turn MathJax off. This feature requires Javascript. Click on a formula to zoom.
Abstract
In this study, we measured the physiological response such as relative growth rate (RGR), relative water content (RWC), chlorophyll index, net photosynthetic rate and relative electrical conductivity of Tiger lily leaves periodically, under different concentrations of salt. We isolated LiMAPK mRNA (including the 5′ UTR and 3′ UTR) (GenBank accession number JQ437268) under treatment at salt threshold concentrations by rapid amplification of cDNA ends polymerase chain reaction (RACE–PCR). The relative expression levels of LiMAPK under salt stress were analyzed by real-time fluorescence quantitative PCR. The results showed that the salt threshold concentration of Tiger Lily was 1.09 mg/mL, and the LiMAPK gene covered 1291 bp, coded 306 amino acids and the conservative domain was 627 bp long. There was a highly conserved domain (TRWYRAPE) present in the amino acid sequence of MAPK. Comparative analysis using NCBI BLASTp showed that this conservative domain was a catalytic domain in the MAPK super family. The LiMAPK expression levels in the leaves were significantly increased within 2 h after initiation of stress treatment with salt threshold concentrations and continued to rise in the next 2 h, reaching a maximum at 4 h and decreasing in the next 4 h. After 12 and 24 h of salt stress, the LiMAPK expression levels were basically stable, but still twice as high as those in the control. The results indicated that the LiMAPK gene was up-regulated by salt stress, which might be closely related to the salt-tolerance mechanism in Tiger lily.
Introduction
Lilium lancifolium Thunb., also known as Tiger lily, belonging to the genus Lilium of the family Liliaceae, is a perennial bulbous herb occurring mainly in East Asia, Europe, North America and other temperate regions of the Northern Hemisphere [Citation1]. With strong drought resistance and saline-alkaline resistance, Tiger lily is an excellent parental basis for developing drought-resistant lily varieties. Non-biological stresses, especially extremely high or low temperatures, and also high salinity and alkalinity seriously affect plant growth and development, reduce product quality and even limit the geographic distribution. Tiger lily has played an important role in the research of stress tolerance, disease resistance and modification of flower colour in breeding [Citation2,Citation3]. Abiotic stresses, such as drought, high salinity and temperature variation, impair the productivity of all major crops. These environmental factors influence plant yield and quality by affecting various cellular and whole-plant processes. Plants have developed sophisticated defense mechanisms to deal with diverse unfavourable environmental stress [Citation4].
The mitogen-activated protein kinase (MAPK) cascade is a signalling pathway generally present in eukaryotes, which is involved in different processes of plant growth and development, and plays an important role in response to various biological and non-biological stresses [Citation5]. This pathway includes MAPKKK, MAPKK and MAPK, each of which can carry out phosphorylation to amplify and transmit signals to the nucleus, in order to activate the expression of specific genes in response to external stimuli. The sequential activation of the MAPK cascade eventually results in the activation of transcription factors, phospholipases, cytoskeletal and microtubule-associated proteins, and the expression of specific sets of genes in response to various stimuli [Citation6–8]. The first MAPK gene was isolated in 1993. Since then, the components of the MAPK cascade have been obtained from Arabidopsis thaliana, tobacco, corn and other plants. In the Arabidopsis thaliana genome, there are reportedly 20 known MAPK, 10 MAPKK and 80 MAPKKK; and three of the MAPKs, MPK3, MPK4 and MPK6, are by far the most studied [Citation9].
MAPK genes have been cloned from Arabidopsis thaliana [Citation10], mulberry [Citation11], rice [Citation12], corn [Citation13], wheat [Citation14], Fragaria vesca [Citation15] etc., with their functions subject to a preliminary analysis. It has been reported that the MAPK gene is closely related to saline tolerance in plants [Citation16–18]. But to our knowledge, there are no reports about the cloning and functional analysis of this gene in the lily family. Lily is extremely sensitive to salt and has strict requirements for the salinity and alkalinity of its soil. So far, there is no lily variety resistant to salinity and alkalinity, thus severely affecting its cultivation and development in some northern areas having a high degree of salinity; therefore, developing salinity resistant lily varieties is a very important part of breeding [Citation19]. This study attempted to clone lily MAPK genes and analyze their expression characteristics at different concentrations of salt, laying a foundation for further study of the molecular mechanisms underlying the role of the MAPK gene of lily plant in salt resistance.
Materials and methods
Experimental materials
Tiger lily was obtained from Kaiyuan City, Liaoning Province of China. Bulbs were cultured in cultivation pots with MS-based nutrient medium. These pots were placed in a greenhouse for growth (conditions: photo-period 12 h and temperature 25 ± 3 °C).
DL2000 DNA Marker, RNase H, and TdT were procured from Takara; deoxynucleoside triphosphate (dNTP), M-MLV and T4 ligase were obtained from Promega; TagDNA, RNApreppure Plant Total RNA Isolation Kit, M-MLVReverse Transcriptase Kit, PGM-T Cloning Kit, DNA Gel Extraction Kit, ampicillin (Amp), RNasin, RNaseA, X-gal, and IPTG (isopropyl β-D-1-thiogalactopyranoside) were all purchased from Tiangen Biotech (Beijing, China). All other chemicals used were of analytical grade.
Screening of salt threshold concentrations and determination of physiological indices
Seedlings cultured for 60 d were taken from the green house and were irrigated with a sodium chloride solution at different concentrations (0, 3, 6, 9, 12 and 15 mg/mL) for 42 days. A refined treatment at 12, 13, 14 and 15 mg/mL was performed and physiological indices were determined weekly after ceasing the salt treatment, continuously for 6 weeks. These results were used in screening and determining the salt threshold concentrations in Tiger lily.
Cultivation of tissue-cultured seedlings
We took the outer scales from Tiger lily bulbs, brushed away the soil from these scales with a soft brush and rinsed with tap water. After that soaked them in 75% ethanol for 15 s on an ultra-clean bench, and rinsed with sterilized distilled water three times. We disinfected with 0.1% HgCl2 solution for 10 min, shaking constantly and replacing the HgCl2 disinfectant once. Then we rinsed three times with sterile distilled water and placed the scales in a culture dish covered with filter paper, absorbing excess water. We inoculated the scales in minimal MS medium and cultured them under conditions: 23 ± 3 °C, light 14 h, and light intensity of 1000 ∼ 1200 lx. After secondary and enriched cultures, RNA was extracted from tissue-culture seedlings treated at salt threshold concentrations [Citation19].
Determination of growth rate
A ruler was used to measure the vertical growth (height) of Tiger lily. Salt resistance was compared according to the following formula [Citation20,Citation21]:
where H is the relative growth (height), Ht is the relative growth rate (RGR) (height) of the plants treated with salt and Hc is the RGR (height) of the control plants. The heights (growth rates) were calculated as mean values from three plants. The RGR was determined by measuring the height (H) at time t1 and t2, as follows: RGR(H)=(H2 − H1)/(t2 − t1).
Determination of relative water content
We weighed the leaves (fresh weight, Wf) and soaked them in distilled water for 5 h. Then we weighed them again (saturated weight, Wt) and placed the leaves in an oven at 105 °C for 30 min, dried them at 80 °C for 24 h and weighed them again (Wd). Finally, we calculated the relative water content (RWC) by the following formula [Citation22,Citation23]: RWC (%) = [(Wf −Wd)/ (Wt − Wd)] × 100.
Determination of chlorophyll index
The chlorophyll index was measured with a SPAB-502 hand-held chlorophyll metre.
Determination of net photosynthetic rate
The net photosynthetic rate was measured with a LI-6400XT photosynthetic metre.
Determination of membrane permeability
We added 10 mL of deionized water to the test-tube already rinsed with deionized water. The initial measured conductivity was denoted by S0. We took leaves from Tiger lily plants that were treated with salt, cut them into 1 cm2 segments and placed them in the aforesaid test-tube, and soaked them for 1 h. A DDS-320 digital conductivity metre (manufactured by Shanghai DAPU Instrument Co., Ltd, China) was used to measure leaf exosmosis conductivity (S1). We sealed the tube orifice and placed it in boiling water for 10 min. After that we removed the tube, cooled it down to room temperature and measured the conductivity (S2). The relative conductivity (L) was calculated by the following formula [Citation22,Citation23]:
Determination of the salt tolerance threshold
We determined the growth and physiological indices of Tiger lily treated with salt for 42 d. The salt tolerance threshold was defined as the salt concentration that caused a decrease of 50% for the index of interest screened under salt stress [Citation22,Citation24–27].
Cloning and sequencing in conservative domains of the MAPK gene
Extraction of total RNA
The total RNA was extracted from tissue-cultured seedlings treated with NaCl solution at salt threshold concentrations according to the RNAPlant Plant Total RNA extraction kit according to the manufacturer’s instructions. Then the total RNA was stored at −80 °C.
Primer design and cloning of MAPK gene in conservative domains
Information on the MAPK gene sequence is publicly available in Plant EST libraries and GenBank. A sequence alignment analysis was made using Primer 5.0 software combined with Blastn. Degenerate primers MF1, MR1, MF2 and MR2 were designed for the MAPK gene () [Citation16]. The total RNA was reverse-transcribed into cDNA using the M-MLV Reverse Transcriptase kit. MF1 and MR1 were used as upstream and downstream primers for the first round of polymerase chain reaction (PCR) amplification. The amplification steps were as follows: the first step was 94 °C 5 min; 94 °C 30 s, 55 °C 45 s, 72 °C 60 s, the second step was 94 °C 30 s followed by 37 cycles and the third step was 72 °C for 10 min. Using the product of the first round of PCR amplification as a template and MF2 and MR2 as nested primers, the nested PCR amplification was used to obtain the middle segments. PCR was performed in a thermocycler (BIO-RAD S1000 Thermal Cycler, BIO-RAD, California, USA).The product was detected using 1% agarose gel electrophoresis. Purified fragments were recovered using the gel extraction kit, which was connected to the PGM-T vector and transformed into Escherichia coli Top10 competent cells. The blue-white screening was made on a plate containing IPTG and X-gal. The positive colony was inoculated into 10 mL LB broth containing 50 mg/L Amp and incubated at 37 °C at an agitation speed of 180 rpm for 12–16 h [Citation28]. After that, 2 µL of sample was taken for colony PCR. Positive clones were sequenced by Tiangen Biotech (Beijing).
Table 1. Primers used in the amplification of MAPK.
3′ RACE (rapid amplification of cDNA ends)
Primers were designed for 3′ RACE (MAPK 3-1 and MAPK 3-2), and 3′ RACE adapter primer (PCR-G), according to the middle conservative domain of the cloned MAPK gene (). With total RNA as a template and Oligo dT as a primer, the first strand of cDNA was synthesized using M-MLV Reverse Transcriptase from Promega. With the 3′ end of the first strand of cDNA as the template, the nested amplification was made for MAPK1, MAPK2 and 3′ RACE Adapter. The amplification conditions used were: 94 °C 5 min; 94 °C 30 s, 60 °C 30 s, 72 °C 60 s; 94 °C 30 s, 34 cycles; and 72 °C 5 min. Single clear 3′ target fragments were obtained. PCR products were resolved on 1% agarose gel electrophoresis. Target bands were excised from the gel, then cloned and sequenced.
5′ RACE (rapid amplification of cDNA ends)
We designed 5′ primers (R1, R2, R3, R4 and R5), abridged anchor primers AAP-G and abridged universal amplification primer PCR-T according to the middle fragments and 3′ fragments of the cloned gene (). With R1 and R2 as primers, RT-PCR was used to obtain two bands of first-strand cDNA. The difference between the cDNA strands obtained from the two primers was 25 bp. We then took 25 μL of the first strand cDNA and removed the residual RNA via RNase H to obtain purified cDNA. The TdT kit was used to add polyC at the 5′ end of cDNA. With R2 and R3 as specific primers, the first-step amplification of AAP-G was made. With the resulting product as a template, the nested PCR amplification was run for R3, R4, R5 and PCR-T to obtain the 5′ end of the gene. The amplification conditions used were as follows: in the first step, denaturation at 94 °C for 5 min; in the second step, amplifications at 94 °C 30 s, 60 °C 90 s, 72 °C 90 s, 34 cycles; in the third step, extension at 72 °C for 50 min; finally, single clear 3′ target fragments were obtained. The PCR products were resolved in a 1% agarose gel electrophoresis. The target bands were excised from the gel, ligated to a PGM-T vector, transformed into E. coli and sequenced. Recycling 3′ RACE and 5′ RACE PCR amplification products were extracted using the gel extraction kit, connected to pGEM2Teasy vector and transformed into E. coli Top 10 competent cells. The blue-white screening was performed to obtain positive colonies, which were grown in the LB medium. Plasmids were extracted as a template for PCR testing. Then, the identification was made using EcoRI restriction enzyme digestion. After being identified as positive clones, they were sequenced by Tiangen Biotech (Beijing, China) [Citation20]. DNASTAR software was used to search and remove vector sequences. The 5′ RACE and 3′ RACE sequencing results were spliced with DNAMAN. The sequences obtained were compared using NCBI Blast.
Quantitative real-time PCR
Total RNA was extracted from the frozen leaves in liquid nitrogen, removed from seedlings which treated with salt threshold concentrations for 0, 2, 4, 6, 8, 12, 24, 48 and 72 h, using an RNA extraction kit (Bioteke, China) according to the manufacturer’s instructions. Reverse transcription was performed using MMLV reverse transcriptase (Promega, USA) with the Oligo-dT primer (TaKaRa, China). Quantitative real-time PCR was performed for cDNA amplification on ABI PRISM 7000 Sequence Detection System using ABI SYBR Select Master Mix (Invitrogen ABI, Inc., USA) and primers shown in , according to the manufacturer’s instructions and applied international standards. The PCR reaction consisted of 12.5 μL of SYBR Green PCR Master Mix, 300 nm of forward and reverse primers, and 1.0 μL of 1:10-diluted template cDNA in a total volume of 25 μL. Cycling was performed using the default conditions of the ABI Prism 7000 SDS Software 1.0. The thermal cycling conditions consisted of an initial denaturation step at 95 °C for 30 s and 40 cycles of the following 3 steps: denaturation at 95 °C for 5 s, annealing at 60 °C for 30 s, and elongation at 72 °C for 30 s. Actin was used as the internal control.
Statistical analyses
SAS software was used for factor analysis of variance and Duncan’s new multiple range test (SSR method) (p < 0.05) for data processing.
Results and discussion
Effect of salt stress on the growth rate of Tiger lily
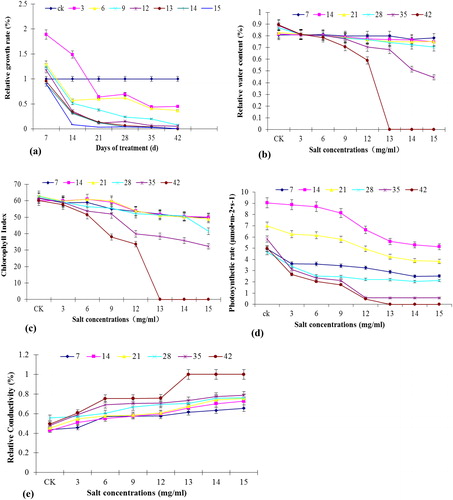
The RGR of Tiger lily grown under salt stress is shown in . Statistical analysis revealed that the interaction between salt concentration and period was negligible. The comparison with the control group (without salt stress) shows that the difference of the RGR in 7 d was not significant. The RGR in both the experimental group and the control group decreased significantly in 14 d, and became stable in 21 d. As the concentration of salt increased, the relative growth of Tiger lily decreased; as the number of treatment days increased, the RGR based on the same concentration also decreased. Growth is an important index of salt tolerance in plants [Citation29,Citation30]. In many studies, the salt tolerance threshold is standardized as the salt concentration in the case where the amount of plant growth or biomass is decreased by 50% [Citation26,Citation31].
Figure 1. Effect of different NaCl concentrations on the physiology of Tiger lily. Relative growth rate (a); RWC (b); chlorophyll index (c); photosynthetic rate (d); relative conductivity (e). The treatment duration was 7, 14, 21, 28, 35 and 42 days.
Effect of salt stress on the leaf RWC of Tiger lily
The analysis of the leaf water content of Tiger lily under different salt concentrations () showed that the control Tiger lily plants had a RWC of 84.9%. With the increase in salt concentration and treatment time, the RWC gradually decreased. There was no significant difference in the RWC between the leaves under 3, 6 and 9 mg/mL of salt concentrations as compared to control leaves. After 35 d, there was a significant decrease in the water content in leaves under 12, 13, 14 and 15 mg/mL of salt concentration. After 42 d, the RWC of the leaves under 12 mg/mL dropped to 59%; and was zero under salt concentration of 13, 14 and 15 mg/mL.
Effect of salt stress on the chlorophyll index of Tiger lily
The change in the chlorophyll index of Tiger lily leaves under different salt concentrations is presented in . The chlorophyll index of control lily was 61.507. With the increase in salt concentration and time, the chlorophyll content gradually decreased. There was no significant difference between the leaves under salt concentrations of 3, 6 or 9 mg/mL and the control leaves; but there was a significant difference between the leaves under salt concentrations of 12, 13, 14 and 15 mg/mL as compared to the control leaves. After 42 d, the chlorophyll index of the leaves under salt concentrations of 13, 14 and 15 mg/mL was zero.
Effect of salt stress on the net photosynthetic rate
The net photosynthetic rate under different salt concentrations on day 14 and day 21 was nearly 2 and 1.5 times that on day 7, respectively, the difference being significant (). With the increase in salt concentration, this rate gradually decreased. After 42 d, when the concentration was 13, 14 or 15 mg/mL, the photosynthetic rate decreased to zero.
Effect of salt stress on the leaf membrane permeability of Tiger lily
The relative conductivity of Tiger lily under different salt concentrations increased with stress time (). The control Tiger lily had relative conductivity of 47.5%. The difference between 21 d and 7 d was significant. At 35 d, some tiger lilies under salt concentrations of 12, 13, 14 or 15 mg/mL began to die, with relative conductivity as high as 68.4%, and seriously damaged membranes. In 42 d, the relative conductivity peaked and all the plants died under salt concentrations of 13, 14 or 15 mg/mL.
Salt stress has a significant influence on a plant’s growth and development in many respects, including the damaging of the integrity of the membrane system, inhibiting enzyme activity, increasing nutrient demand, undermining chloroplast function and causing metabolic disorders, etc. [Citation32–36]. This type of stress can lead to harm similar to that caused by high heat and drought [Citation37–39]. Zhao et al. [Citation38,Citation39] used Lanzhou lily seedlings grown in pots and tubes to perform a stress test for a period of 30 days using different concentrations of NaCl (0.2%, 0.4%, 0.6%, 0.8% NaCl aqueous solution). The study found that as the NaCl concentration increased, the lily leaf shoots pumping rate, number of leaves and plant height were significantly reduced, reducing multiple differentiations and aggravating the salinity injuries, hence affecting the plantlet biological yield. The biomass yield of plantlets shows a significant positive correlation with the xylem flow rate, leaf number, plant height and reduction of multiple differentiation.
NaCl stress causes a reduction in the amount of root growth, slows down the growth in height and deteriorates the flower quality. At the same time, the biomass yield of the plant components (roots, bulbs, stems and leaves) will also decrease. Besides, NaCl stress leads to an increase in the lily’s leaf cell membrane permeability and proline content, but the chlorophyll content decreases and the soluble sugar content has a decreasing trend. Lanzhou lily can be resistant to 0.4% NaCl stress. The growth of the lily is seriously impaired when the NaCl concentration becomes higher than 0.6% and lily plantlets cannot grow if it is larger than 0.8%, where most plants will die from browning. These results are consistent with previous reports [Citation37–42].
Determination of threshold tolerance
To determine the tolerance threshold, we analyzed the growth and physiological indices at 42 d of salt treatment. For five indices screened under salt stress, the salt tolerance threshold showed a decrease of 50% when compared to the control. The RWC of the leaf had a minimum tolerance threshold (), indicating that it was reliable to take the salt concentration (when the RWC decreased by 50%) as the tolerance threshold. Thus, the salt tolerance threshold of Tiger lily was 1.09 mg/mL.
Table 2. Linear regression of the studied indices in Lilium lancifolium.
Hua’s [Citation43] experiment came to the conclusion that 8 mg/mL NaCl concentration is the salt tolerance threshold of Shexiang lily plantlets. The plantlets’ roots and malondialdehyde (MDA) content and conductivity when treated with NaCl 8 g/L are significantly higher than those in the control, and the MDA content is lower than that in the blades, but the proline (Pro) concentration does not show significant changes. Due to salt stress over a prolonged period, superoxide dismutase (SOD), peroxidase enzyme (POD), catalase (CAT) and ascorbate peroxidase (APX) will first increase and then decrease, but the root system activity change is much lower than the blades. At the same time, the salt stress also reduces the ascorbic acid (ASA) content of the lily’s leaves and roots, yet the roots’ ASA decreases less than that of the leaves. These results indicate that, compared with the blades, lily root has a stronger ability to resist salt. In addition, the MDA concentration and stable conductivity can be used as indicators of lily salt evaluation, rather than Pro.
Hua [Citation44] irrigated Lilium oriental Sorbonne and Lilium auratum cv. Prato, respectively, with different saline concentration gradients to study the change in physiological and biochemical indices and the morphological index of two varieties under different salinity stress and different growth stages. The plant height growth rate of Sorbonne and Prato became slow, the stem diameter growth was inhibited, the net photosynthetic rate dropped significantly, the transpiration rate decreased, the activity of CAT and POD increased at first, then decreased, and the change in the soluble protein content and Pro content seemed inconsistent. However, compared with Prato, there were few blades that changed in the late Sorbonne growing, the chlorophyll content and CAT activity decreased significantly, POD activity and the transpiration rate increased and the MDA content was significantly higher than for the control. Also, SOD activity fluctuations very large throughout the sampling period. This suggests that Prato resisting salt capacity is stronger than for Sorbonne.
Cloning and sequencing of conservative domain in the MAPK gene of Tiger lily
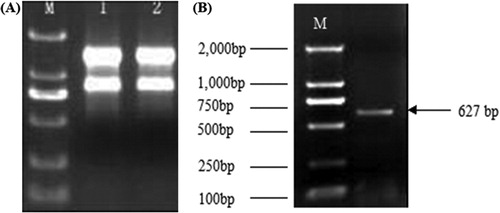
A fragment of about 700 bp was obtained from the middle conservative domain in the amplified MAPK gene (). Sequencing results showed that this fragment was actually 627 bp in length, encoding 209 amino acids. The comparison using NCBI BLAST showed that this sequence was highly homologous with the MAPK genes of other species detected in the database, so it was at the 3′ end of the MAPK gene in Tiger lily.
Figure 2. Agarose electrophoresis of total extracted RNA (a) and amplified MAPK conserved sequence (b) from Tiger lily (L. lancifolium). Note: M:DL 2, 000TM DNA molecular size marker.
Cloning and sequencing of 3′ and 5′ ends of the MAPK gene
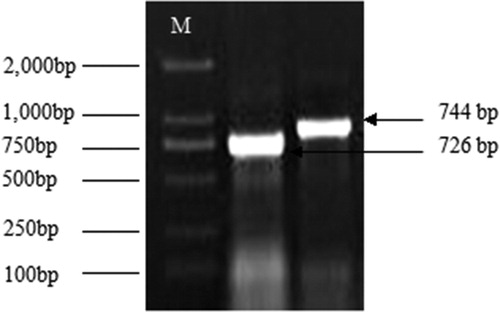
Two fragments of about 800 bp were obtained (). The sequencing results showed that, among four samples of two fragments, two samples (744 bp and 726 bp, respectively) encode 79 amino acids, while the alternate sample (741 bp) encodes 79 amino acids. The comparison showed that three groups of fragments have homology of 80.79%, and may belong to the MAPK gene family. The comparison using NCBI BLAST showed that this sequence was highly homologous with the MAPK gene of other species detected in the database, so it was present at the 3′ end of the MAPK gene in Tiger lily.
Figure 3. Agarose electrophoresis of amplification of MAPK 3′ end sequence from Tiger lily (L. lancifolium). M:DL 2, 000TM DNA Marker.
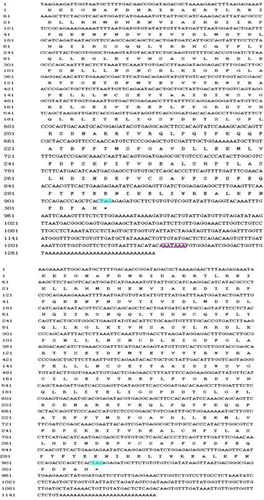
Two samples of the middle segment were spliced with three samples of the 3′ end using DNAMAN software to obtain two fragments: identity of 98.89% (1160/1173), gap of 9.14% (118/1291). The deduced amino acid sequence () contained a stop codon and polyadenylation signal recognized (transcription termination), showing that the 373 bp 3′ UTR domain was complete.
Figure 4. Conserved 3′ nucleotide sequence and deduced amino acid sequences of MAPK from Tiger lily (L. lancifolium).
Homologous analysis of MAPK amino acid sequence in Tiger lily
For homology analyses, Clustalx 1.83 software was used to search the GenBank database (http://www.ncbi.nlm.nih.gov), and obtain an amino acid sequence of the gene having higher homology with the lily MAPK gene. Using DNAMAN Biology Software to perform NCBI BlastP homology analysis for the amino acid sequence predicted in the MAPK gene of Tiger lily. The results showed that the amino acid sequence predicted from the MAPK gene sequence has similarity of 55.95–71.58% to the MAPK sequences in other plants. Specifically, the similarity from within M. hupehensis Rehd was 71.05–71.58%, followed by corn, midget crabapple, alfalfa, Chorispora bungeana etc. ().
Figure 5. Partial amino acid comparison between Tiger lily (L. lancifolium) and other species. Note: Zea mays (DQ422149), maize; Medicago sativa (X82270), alfalfa; Malus hupehensis (EF427897), Malus; Malus micromalus (AF435805), crabapple; Chorispora bungeana (AY805424), Alpine ion mustard. Note: Phosphorylation motif (TEY) site (in red box).
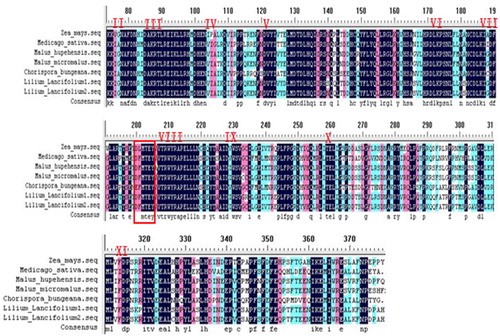
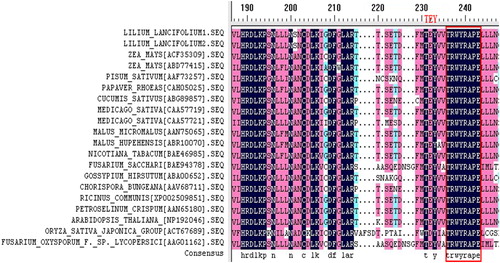
The sequence analysis combined with homology comparison initially showed that this sequence was the MAPK cDNA sequence of Tiger lily and has been recorded in NCBI (GenBank accession number: JQ437268). The comparison with plants with known MAPK homology showed that it should contain 11 relatively conserved serine/threonine-specific protein kinase domains (including I–XI, currently II–XI cloned) and domains with both ends being variable. T rings of the VII–VIII catalytic domains have a characteristic phosphorylation motif site (TEY) (). There was a highly conserved domain (TRWYRAPE) in the amino acid sequence of MAPK, and the analysis using BLASTp NCBI showed that this conservative domain was a catalytic domain in the MAPK superfamily (). A variety of extracellular stimuli (including plant growth, pathogen invasion, mechanical injury, touch, drought, low temperature, high salinity, osmotic stress, reactive oxygen stress etc.) can trigger the stress-regulated protein kinase cascade, and ultimately activate target proteins through the TEY group in the activation ring of phosphorylated kinase.
Figure 6. Alignment of deduced amino acid sequences from 20 plants’ MAPK cDNAs. Note: Catalytic domain in the MAPK superfamily (in red box).
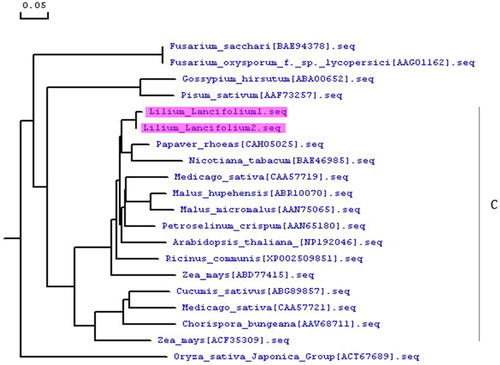
To investigate the relationships between the MAPK protein gene of Tiger lily and that in other plants, MEGA5.0 software was used to construct a phylogenetic tree using amino acid sequences predicted in MAPK protein (). The results showed that plant MAPK can be divided into four categories, of which LiMAPK belongs to Class C MAPK with high homology, with its gene expression being induced by abiotic stress.
Figure 7. Phylogenetic relationship of Tiger lily (L. lancifolium) MAPK with other plant MAPKs.
LiMAPK expression pattern analysis
Real-time quantitative PCR reactions were performed using fresh young leaves from tube seedlings to detect relative differential expressions of LiMAPK gene under NaCl stress with salt threshold concentrations, in order to understand the expression pattern of LiMAPK gene from leaves of Tiger lily, so as to further reveal its function and mechanism of action in salt-resistance.
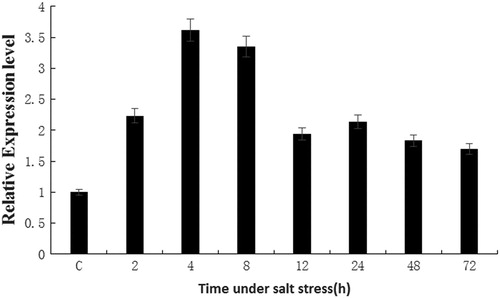
The results showed significant accumulation of LiMAPK transcripts in the leaves within 2 h from the initiation of treatment with salt threshold concentrations. The LiMAPK expression levels continued rise over the next 2 h and reached a maximum at 4 h. Then the expression level began to decrease, which was more pronounced over the next 4 h. After 12 and 24 h salt stress, the LiMAPK expression levels were basically stable, but still twice higher than in the control (). The results indicated that the LiMAPK gene was up-regulated by salt stress, which might be closely related to the salt-tolerance mechanism in Tiger lily.
Figure 8. Relative expression levels of LiMAPK in leaves of Tiger lily under NaCl stress with salt threshold concentrations. Note: C, control.
MAPKs belong to the serine/threonine (Ser/Thr) protein kinase family and are found in all eukaryotes [Citation45]. They play an important regulatory role in cell cycle progression and gene expression through the Ser/Thr phosphorylation modification, which can transfer upstream signals to downstream ones [Citation46,Citation47]. The MAPKs signalling pathway in plants is closely related to abiotic stresses (such as drought, high salinity and temperature variation, etc.). The plants respond to stress through the corresponding receptors on the cell membrane, through the corresponding MAPK signalling pathway to stimulate the signal further transmitted to the nucleus, mobilization of related gene expression, production of the corresponding protein and regulating the cell physiology (metabolism), to deal with the impact of external stimuli. It was confirmed that MAPK plays an important role in the stress signal transduction in plants. Many results show that MAPK is associated with salt stress signal transduction in a range of plants [Citation48–51]. Therefore, the study of the MAPK signalling pathway has become a hot topic in the study of various stress response mechanisms. The role of MAPK in plant resistance to various adversities has attracted widespread attention. At present, a large number of MAPK proteins have been found in many organisms. However, there are few reports about the MAPK proteins in lilies, and most of the MAPK protein functions and molecular mechanisms are not clear [Citation52,Citation53]. Therefore, the study of the molecular mechanism of lily protein kinase (MAPK) will be useful supplement to the molecular pathways of salt stress.
Conclusions
In recent years, the research on MAPK has focused on Arabidopsis and other model plants, but less on lily. In this study, we extracted RNA from Tiger lily under salt stress and report the first successful attempt to clone the MAPK gene from Tiger lily by RT-PCR and RACE. Real-time quantitative PCR was also used to analyze the effect of high-salt stress, which laid the foundation for further study of the function and mechanism of the protein kinase in Lily. Protein sequence comparison and phylogenetic analysis showed that the similarity between MAPK in Tiger lily and M. hupehensis is highest, followed by corn, midget crabapple, alfalfa, Chorispora bungeana etc. It was demonstrated that the gene cloned is a MAPK gene of Tiger lily (LiMAPK). The MAPK gene amino acid sequence homology was higher in plants having closer genetic relationships and similar sensitivities. The real-time quantitative PCR results indicated that the LiMAPK gene was up-regulated by salt stress, which might be closely related to the salt-tolerance mechanism in Tiger lily.
Disclosure statement
No potential conflict of interest was reported by the authors.
Additional information
Funding
Related Research Data
References
- Gao J, Zhang T, Jin ZY, et al. Structural characterisation, physicochemical properties and antioxidant activity of polysaccharide from Lilium lancifolium Thunb. Food Chem. 2015;169:430–438.
- Bray EA, Bailey SJ. Responses to abiotic stresses (chapter 22). In: Gruissem W, Buchannan B, Jones R, editors. Responses to abiotic stresses. Rockville (MD): American Society of Plant Physiologists; 2000. p. 1158–1249.
- Kaoru U, Yukio K, Motoaki S, et al. ‘Omics’ analyses of regulatory networks in plant abiotic stress responses. Curr Opin Plant Biol. 2010;13:132–138.
- Wang XW, Vinocur B, Altman A. Plant responses to drought, salinity and extreme temperatures: towards genetic engineering for stress tolerance. Planta. 2003;218:1–14.
- Boller T. Chemoperception of microbial signals in plant cells. Annu Rev Plant Physiol Plant Mol Biol. 1995;46:189–214.
- Neill S, Desikan R, Hancock J. Hydrogen peroxide signalling. Curr Opin Plant Biol. 2002;5:388–395.
- Popescu SC, Popescu GV, Bachan S, et al. MAPK target networks in Arabidopsis thaliana revealed using functional protein microarrays. Genes Dev. 2009;23:80–92.
- Taj G, Agarwal P, Grant M, Kumar A. MAPK machinery in plants: recognition and response to different stresses through multiple signal transduction pathways. Plant Signal Behav. 2010;5(11):1370–1378.
- Ichimura K, Shinozaki K, Tena G, et al. Mitogen-activated protein kinase cascades in plants: a new nomenclature. Trends Plant Sci. 2002;7(7):301–308.
- Mizoguchi T, Ichimura K, Irie K, et al. Identification of a possible MAP kinase in Arabidopsis thaliana based on pairwise yeast two-hybrid analysis and functional complementation tests of yeast mutants. FEBS Press. 1998;473(1–2):56–60.
- Wei CJ. [Bioinformatics analysis and functional study of mulberry MAPK gene family] [master’s thesis]. Chongqi City (China): Southwest University. 2014. Chinese.
- Lieberherr D, Thao NP, Nakashima A, et al. A sphingolipid elicitor-inducible mitogen-activated protein kinase is regulated by the small GTPase OsRac1 and heterotrimeric G-protein in rice. Plant Physiol. 2005;138:1644–1652.
- Lalle M, Visconti S, Marra M, et al. ZmMPK6, a novel maize MAP kinase that interacts with 14-3-3 proteins. Plant Mol Biol. 2005;59:713–722.
- Takezawa D. Elicitor- and A23187-induced expression of WCK-1, a gene encoding mitogen-activated protein kinase in wheat. Plant Mol Biol. 1999;40:921–933.
- Zhou HY, Ren SY, Han YF, et al. Identification and analysis of mitogen-activated protein kinase (MAPK) cascades in Fragaria vesca. Int J Mol Sci. 2017;18(8):1766–1784.
- Jonak C, Okresz L, Bogre L, Hirt H. Complexity, cross talk and integration of plant MAP kinase signaling. Curr Opin Plant Biol. 2002;5:415–424.
- Singh R, Lee MO, Lee JE, et al. Rice mitogen-activated protein kinase interactome analysis using the yeast two-hybrid system. Plant Physiol. 2012;160:477–487.
- Chen HY, Feng SD, Liu XG, et al. [Expression pattern of MAPKs gene in Sorghum bicolor under stresses of NaCl and Na2CO3]. J Jilin Univ. 2012;50(1):39–146. Chinese.
- Yang YH, Yin LR, Ge H, et al. [Overexpression of a novel member of ERF transcription factor JERF3 in lily enhances the tolerance to salt]. Acta Horticul Sinica. 2007;34(6):1485–1490. Chinese.
- Chen LJ, Ge L, Li HG, et al. [Change in glycerol- 3-phosphate acyltransferase activity of Lilium dauricum Ker Grawl. and cloning of its conserved cDNA region under cold stress]. Acta Agriculturae Boreali-Sinica. 2011;26(5):34–39. Chinese.
- Poorter H., Remkes C. Leaf area ratio and net assimilation rate of 24 wild species differing in relative growth rate. Oecologia.1990;83(4):553–559.
- Alshammary SF, Qian YL, Wallner SJ. Growth response of four turfgrass species to salinity. AgriWater Manag. 2004;66(1):97–111.
- Liu YM, Cheng FZH, Wang Q, et al. Salinity stress responses and tolerance thresholds in four warm-season turfgrasses. Acta Prataculturae Sinica. 2009;18(3):192–199.
- Rajinder SD, Pamela PD, Trevor AT. Leaf senescence: correlated with increased levels of membrane permeability and lipid peroxidation, and decreased levels of superoxide dismutase and catalase. J Exper Bot. 1981;32(1):93–101.
- Qian YL, Fu JM. Response of creeping bentgrass to salinity and mowing management: carbohydrate availability and ion accumulation. Hort Sci. 2005;40:2170–2174.
- Qian YL, Wilhelm SJ, Marcum KB. Comparative responses of two Kentucky bluegrass cultivars to salinity stress. Crop Sci. 2001;41:1895–1900.
- Suplick-Ploense MR,Qian YL, Read JC. Relative NaCl tolerance of Kentucky bluegrass, Texas bluegrass and their hybrids. Crop Sci. 2002;42(6):2025–2030.
- Zhao W, Xu WR, Xu Y, et al. [Cloning full length cDNA of Chinese wild vitis novel gene and sequence analysis]. Acta Bot Boreali-Occidentalia Sinica. 2007;27(5):0859–0863. Chinese.
- Maas EV. Salt tolerance of plants. Appl AgriRes. 1986;1:12–26.
- Kuiper PJC, Kuiper D, Schuit J. Root functioning under stress conditions: an introduction. Plant Soil. 1988;111:249–258.
- Levitt J. Responses of plants to environmental stresses. Vol.2, Water, radiation, salt and other stresses. New York (NY): Academic Press; 1972.
- Hasegawa PM, Bressanra J, Zhu K, et al. Plant cellular and molecular responses to high salinity. Annu Rev Plant Physiol Plant Mol Biol. 2000;51:463–499.
- Munns R. Genes and salt tolerance: bringing them together. New Phytol. 2005;67(3):645–663.
- Apse MP, Blumwald E. Engineering salt tolerance in plants. Curr Opin Biotechnol. 2002;13(2):146–150.
- Yamaguchi T, Blumald E. Developing salt-tolerant crop plants: challenges and opportunities. Trends Plant Sci. 2005;10(12):615–620.
- Zhu JK. Plant salt tolerance. Trends Plant Sci. 2001;6(2):66–71.
- Bartels D, Sunkar R. Drought and salt tolerance in plants. Crit Rev Plant Sci. 2005;24(1):23–58.
- Zhao XM, Liu F. [Effects of NaCl stress on the growth of tube seedlings of Lilum davidii var unicolor cotton]. Jiangsu AgriSci. 2007;6:168–170. Chinese.
- Zhao XM, Dong T, Liu F, et al. [Effect of NaCl stress on the growth and development of Lilium davidii unicolor cotton]. AgriRes Arid Areas. 2008;26(2):17. Chinese.
- Huang YR, Lin WX, Nie S, et al. [Changes of antioxidant metabolism and organic solute accumulation of Pittosporum pentandrum and Koelreuteria elegans seedlings under salt stress]. Chinese J Ecol. 2014;33(12):3176–3180. Chinese.
- Lutts S, Kinet JM, Bouharmont J. NaCl-induced senescence in leaves of rice (Oryza sativa L.) cultivars differing in salinity resistance. Annals Bot. 1996;78:389–398.
- Liu Y, Cheng F, Wang Q, et al. [Salinity stress responses and tolerance thresholds in four warm-season turfgrasses]. Acta Pratacul Sinica. 2009;18(3):192–199. Chinese.
- Hua ZR. [Physiology effects of lilium under salt stress and salt-resistance identification of transformed lilium with S6PDH gene] [master’s thesis]. Yangling (China): Northwest A&F University; 2007. Chinese.
- Hua, ZR. [Studies on salt-tolerant mechanism and genetic diversity in Lilium ssp]. [dissertation]. Beijing (China): China Agricultural University; 2005. Chinese.
- Irniger S, Sarikaya-Bayram Ö, Bayram Ö. 6 Fungal MAP-kinase-mediated regulatory pathways. Biochem Mol Biol. 2016;3:97–117.
- Seger R, Krebs EG. The MAPK signaling cascade. FASEB J. 1995;9(9):726–735.
- Zhang W, Liu HT. MAPK signal pathways in the regulation of cell proliferation in mammalian cells. Cell Res. 2002;12(1):9–18.
- Zhang SQ, Klessig DF. MAPK cascades in plant defense signaling. Trends Plant Sci. 2001;6(11):520–527.
- Pitzschke A, Schikora A, Hirt H. MAPK cascade signaling networks in plant defense. Curr Opin Plant Biol. 2009;112(4):421–426.
- Yang CG, Wang RN, Gou LZ, et al. Overexpression of Populus trichocarpa mitogen-activated protein kinase kinase 4 enhances salt tolerance in tobacco. Int J Mol Sci. 2017;18(10):2090–2104.
- Liu CY, Wei CJ, Zhang M, et al. Mulberry MnMAPK1, a group C mitogen-activated protein kinase gene, endowed transgenic Arabidopsiswith novel responses to various abiotic stresses. Plant Cell Tiss Org Cult. 2017;131(1):151–162.
- Jiménez C, Berl T, Rivard CJ, et al. Phosphorylation of MAP kinase-like proteins mediate the response of the halotolerant alga Dunaliella viridis to hypertonic shock. Biochim Biophys Acta. 2004;1644(1):61–69.
- Berman SA, Wilson NF, Haas NA, et al. A novel MAP kinase regulates flagellar length in Chlamydomonas. Curr Biol. 2003;13(13):1145–1149.