
 ?Mathematical formulae have been encoded as MathML and are displayed in this HTML version using MathJax in order to improve their display. Uncheck the box to turn MathJax off. This feature requires Javascript. Click on a formula to zoom.
Abstract
Aspergillus awamori and Aspergillus oryzae were cultivated on wheat bran in newly designed single circular tray solid state bioreactor (SSB) systems. The effect of aeration arrangements on moisture content, oxygen (O2) supply, carbon dioxide (CO2) evolution during solid state fermentation (SSF) was investigated. The purpose was to study the effect on oxygen uptake rate (OUR) and carbon dioxide evolution rate (CER), of operating variables, fermentation on the perforated base tray and internal moist air circulation under natural and forced aeration. Temperature, O2 and CO2 were measured continuously on-line. Final moisture content was also measured. A direct technique of establishing a correlation among fungal growth, CER and OUR were proven successful in this work. The information obtained from CER and OUR led to the estimation of respiratory quotient (RQ). RQ describes the state of the fungal population in the tray SSB and gives an indication of fungal metabolic behaviour. RQ values <1 were obtained from 14 experiments using single circular tray SSB system for the two fungi. A Gompertz model was used to fit the integrated CO2 data and predict the quantity of CO2 evolution in all experiments. A correlation was found between the RQ and CO2 evolution. The aeration strategies and arrangements applied in these studies exceeded the optimum requirements and allowed accurate measurements of gas composition, temperature, moisture content and fungal biomass gradients. The model system developed in this study may provide an excellent system for further investigations of mass transfer and possibly for large scale operation.
Introduction
In any aerobic bioprocess within any type of bioreactor, there are five basic factors that may limit the performance of the fermentation process: moisture content, O2 transfer, carbon dioxide (CO2) transfer, heat transfer and the bioreactor design itself [Citation1]. The heat, which is generated during the fermentation process, can consequently directly affect the metabolic activities of the microorganism causing, amongst others, moisture loss [Citation2]. Removal of heat can be problematic and it can adversely affect the microbial activity [Citation3,Citation4]. Moreover, if temperature control and aeration fail, the selectivity of the biosynthesis process towards product formation could be lost, potentially even causing the process to fail completely [Citation5]. A good strategy is therefore needed to effectively remove the heat from the system. Direct aeration is the principal operation that results in O2 transfer, heat removal and CO2 removal. Cooling of the fermented bed by forced aeration, is another strategy than can be applied in the static SSF process and is very effective to overcome temperature and moisture gradients [Citation6–9]. Moisture content, heat transfer and CO2 transfer requirements are strongly linked to O2 transfer rates in aerobic processes [Citation10]. A complication in SSF is that such effects are increased by high biomass concentrations in combination with the filamentous fungi. SSF processes and the design of bioreactors along with biological aspects have received significant attention from researchers. However, results from previous and recent bioreactor designs are inconclusive regarding their effectiveness. This is surprising because SSF is one of the oldest biotechnological processes known. In order to gain a greater understanding, greater efforts are required not only in the taxonomic and engineering fields, but particularly in the microbial physiology and bioreactor conditions. Solid state bioreactor (SSB) design greatly depends on the solid substrate and the bioreactor is the core of the biological process [Citation11]. There are four major roles of the bioreactor: (i) to contain the substrate, (ii) to contain the process microorganism, (iii) to protect the process microorganism against contamination, (iv) to control environmental conditions to optimise growth and product formation. In SSF or submerged fermentation (SmF) processes, the bioreactor provides suitable environment for microorganism growth and biological activity [Citation12]. Bioreactors must be able to hold the media and be sealed well which prevents harmful environment substances from entering into the bioreactor. At the same time, bioreactor systems should be capable of operating under sterile conditions [Citation13]. However, in the case of SSF bioreactor, sterile conditions are not always necessary for every bioprocess. Various types of bioreactor system have been developed and used in SSF processes. The most important benefit has been greater understanding of the biological system of the microorganism and the biological processes in SSF [Citation14,Citation15]. Research has found that temperature, pH, O2, CO2 and heat removal need to be controlled and optimised [Citation8,Citation9]. SSB design should carefully consider design and operating variables, especially aeration transfer, temperature control (including cooling system), effective diffusion of O2 in gas phase and coefficient for heat transfer through bioreactor wall [Citation16,Citation17]. In SSF, O2 transfer can often be inefficient in some designs. The problems are complicated, affecting the temperature and the water content of the solid medium, which both need to be controlled tightly [Citation18]. Effective bioreactors have high biological reaction rates including growth performance, substrate consumption, product formation and by-products synthesis rates [Citation19]. It is very important to understand which criteria provide the best bioreactor performance so that bioreactors can be designed effectively. In SSF, matching a specific bioreactor to certain bioprocesses needs a balanced consideration of many factors. These include O2 transfer, mixing/agitation, aeration, temperature control, moisture gradients, operational stability and reliability, scale-up and cost [Citation20]. Selected bioreactor must have features and mode of operation that will optimise the results. Importantly, every selected bioreactor operation will increase the biological processes and factors involved [Citation11,Citation21]. The aim of this study was, therefore, to investigate the biological constraints of SSF on bioreactor design, which are, arguably, the major challenges within SSF processes. Many of these constraints are under investigation, as efforts to develop processes for renewable resource utilization consider the possible use of SSF, may not be possible to overcome. Simultaneous measurements of bed temperature, oxygen uptake rate (OUR), carbon dioxide evolution rate (CER) and moisture content for Aspergillus awamori and Aspergillus oryzae, fungi growing actively on wheat bran, were carried out. At the same time, bed temperature, OUR and CER will be observed as indirect techniques for biomass estimation. Strategies on applicability of air flow rate for moisture, gas respiration and bed temperature in single circular tray SSB were proposed and compared.
Materials and methods
Microorganisms
Aspergillus awamori and A. oryzae, obtained from the School of Chemical Engineering and Analytical Science, Faculty of Engineering and Physical Science, University of Manchester, were used throughout this study. Fungal spores were stored at 4 °C in agar slopes of solid sporulation medium containing 5% (w/v) whole wheat flour and 2% (w/v) agar (Sigma-Aldrich, Suffolk, UK) as a stock culture and they were sub-cultured at a time interval of every two months. A. awamori and A. oryzae produce compact colonies with huge spores and accumulate large quantities of black and green pigments during growth in the form of mycelium, respectively.
Fungal inocula preparation
In the petri dish, the spores were washed by lightly scrapping with wire loop in 10.0 mL of sterile 0.1% (v/v) Tween 80. 0.5 mL of the spore suspension was further transferred onto the surface of 100.0 mL of the same sporulation medium in 500.0 mL Erlenmeyer flask and incubated for another 7 days at 30 °C. After the incubation period, 50.0 mL of a sterile 0.1% (v/v) Tween 80 solution and several sterile glass beads (4-mm diameter) were added to the flask. The spores were suspended by shaking the flask gently and collected in one bottle as a spore suspension. The concentration of the spore suspension was measured by haemocytometer. Spores suspension should be diluted enough so that the spores do not overlap with each other on the grid and should be uniformly distributed as it is assumed that the total volume in the chamber represents a random sample.
Solid substrate
Wheat bran was obtained from Cargill Wheat Processing Plant, Manchester, UK. The substrates were kept in airtight container and stored in cold room (4 °C) for future use. Wheat bran is low cost residue of the milling industry, an interesting solid substrate for SSF. These materials may be seen as a model of cheap and abundant agricultural waste and they have potential in making the entire SSF process feasible.
Single circular tray solid state bioreactor
For this bioreactor, the bioreactor chamber included one circular perforated tray with 10.0 cm diameter. The bioreactor was designed to be capable of accommodating a removable tray. The solid substrate sits on the top of perforated tray. The internal structure of a bioreactor and the dimensions are illustrated in the scheme shown in .
Figure 1. A perspective view of a single circular tray SSB from a side view, with emphasis on the location of the tray.
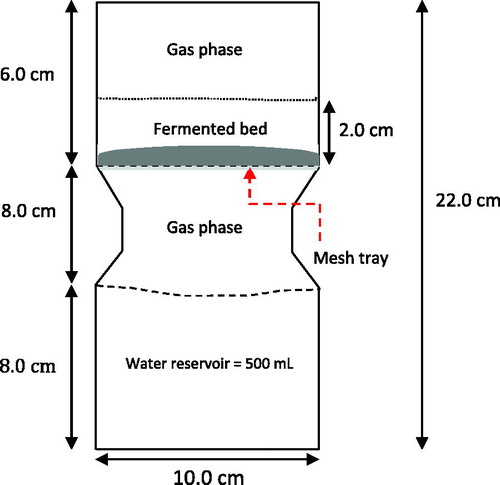
The bioreactor was made of polycarbonate material and compatible with autoclaving. After sterilising, a standard procedure for substrate preparation and inoculum transfer was performed before loading into bioreactor with 2.0 cm bed substrate height. In this work, a strategy for the operation of tray bioreactors used for SSF involves a static bed aerated with air moistened by passing through a reservoir of water at the bottom of the bioreactor. The moistened air may be used as a cooling system to remove the heat generated from the microbial activity while at the same time supplying moist air and O2 in order to improve fungal growth. The entire bioreactor is placed in a temperature controlled room at 30 °C. No mechanical agitation used in this bioreactor. A schematic diagram of the experimental set-up in this system is shown in .
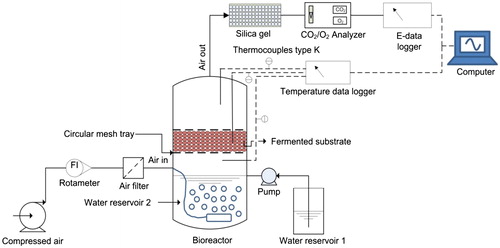
Figure 2. A schematic diagram of experimental set-up of the single circular tray SSB.
Bioreactor setup
The bioreactor and solid substrate were autoclaved at 121 °C for 15 min, prior to operation. The sterilised substrate was inoculated with 1.2 × 10⁶ spores/g substrate in another Erlenmeyer flask before loading in the sterile tray before transfer into the bioreactor as described in the above details. All work were carried out in a laminar flow cabinet under sterile conditions.
For moisturising, dry air from the compressor (Air compressor JUN-AIR, Benton Harbor, Michigan, USA) was let to pass through a humidifier chamber before entering the system. The flow rate of the air into the bioreactor system needs to be accurately measured, normally by using a rotameter. Forced aeration at different flow rates is applied to increase accessibility to O2. The air was sterilised by passing it through a 0.45 µm cellulose acetate membrane filter and then into humidifier chamber with sterilised distilled water which is monitored in a water bath at 30 °C. The bioreactor is equipped with thermocouples and O2/CO2 dioxide analyser. Detailed operating conditions are described in as reported elsewhere [Citation22].
Table 1. Operating conditions of the solid state tray bioreactor.
Air arrangement
describes in detail the air arrangement carried out in single circular tray SSB. In this work, a strategy for the operation of tray bioreactors used for SSF involves a static bed aerated with air moistened by passing through a reservoir of water at the bottom of the bioreactor.
Table 2. Air arrangement in single circular tray SSB.
Temperature
The bioreactor is equipped with a thermocouple type K (Pico Lab Technology, Cambridgeshire, UK) placed at a different point on the surface of the fermented substrate to continuously record the bed temperature over time. All of the on-line data were monitored on screen and recorded.
Respiratory gases
The system used for quantifying CO2 and O2 is able to continuously measure exhaust gas compositions online. An air outlet is situated in the headspace of the highest tray. The exit gas may need to be conditioned (moisture removed) before going into the gas analyser. Therefore, the humid exhaust air from the bioreactor was firstly dried by passing through silica gel tubes before entering an O2/CO2 analyser (FerMac 368 Electrolab, Gloucestershire, UK). This analyser was connected to the ElectrolabeLogger data logging and it translates the concentration of O2 and CO2 to be recorded using a computer system.
Oxygen uptake rate and carbon dioxide evolution rate
Continuous monitoring of O2 and CO2 concentrations in the exhaust gas outlet of a single circular tray SSB was carried out in this study. Measurement of O2 and CO2 concentrations were carried out using a gas analyser as described above. O2 uptake rate (OUR) and CO2 evolution rate (CER) [Citation23] were calculated using EquationEquations (1)(1)
(1) and Equation(2)
(2)
(2) .
Oxygen uptake rate:
(1)
(1)
Carbon dioxide evolution rate:
(2)
(2)
where
is the oxygen uptake rate (mole/L.h);
This equation is based upon the inert gas balance. It is assumed that CO2 is the only gaseous product of the fermentation [Citation23].
The Gompertz curve as a growth curve
Benjamin Gompertz (1825) first proposed the Gompertz model [Citation24]. The Gompertz model is a sigmoid function, as the logistic curve and has been used it as a growth curve, both for biological economic phenomena [Citation24]. Skiadas and Skiadas [Citation25] suggested with a derivation based on systems theory to consider some of the mathematical properties of this curve and to indicate to some extent its usefulness and its limitations as a growth curve. In differential equation form, the model is based on EquationEquation (3)(3)
(3) :
(3)
(3)
where
Without loss of generality, the function of can be assumed bounded (0 <x < 1, with x = 1 corresponding to the entire population), so that x is the probability density function of the growth process. Direct integration of EquationEquation (4)
(4)
(4) gives a solution of the Gompertz function [Citation25]:
(4)
(4)
The integrated Gompertz model, as reported by Saucedo et al. [Citation26], Meraz et al. [Citation27] and Christen et al. [Citation28], was used to analyse the kinetic data. In this logistics-like model, the product CO2 is a function of time (t) according to EquationEquation (5)(5)
(5) .
(5)
(5)
where
The constants , b and k were estimated from the data using a non-linear regression programme. The value of k (h−1) refers to the time it takes for the value of
to reach
. Larger values of k cause
to reach
in a shorter time. The value of b (dimensionless) will determine the shape of the sigmoidal curve. Larger values of b cause the initial exponential growth phase to be slower and the deceleration phase to reach asymptote faster. Smaller values of b cause a rapid exponential growth phase and slower deceleration before the asymptote of
is reached [Citation24]. Here, asymptote refers to a line that continually approaches a given curve but does not meet it any finite distance.
Moisture content
The moisture content of the samples was determined by weight loss after heating to a constant weight at 95 °C. Samples were placed in pre-dried and known weight metallic dishes, which were immediately weighed. After being dried in the oven for 24 h, the samples were cooled for 30 min in desiccators before being finally weighed. Moisture content was calculated as percentage.
Results and discussion
Profile final moisture content
The profiles of final moisture content for A. awamori and A. oryzae in single circular tray SSB are shown in . In control experiments with uninoculated wheat bran, final moisture content in Control 1, Control 2, moistened air at flow rate 1, 2 and 4 L/min exhibited an increment of final moisture content from the initial level (65%) after 72 h. The final moisture content reached about 66.65–70.97%. Furthermore, at air flow rate 6 L/min, the final moisture content was about 64.41%, showing a slight decrease. Although, not 100% saturated, moistened air used favours to supply water and at the same time uninoculated wheat bran (at initial moisture content 65%) has high ability to retain water even at high flow rates. However, when dry air at 2 L/min was sparged into the system, the moisture content hugely decreased to about 44.41% after 72 h. This is expected to happen because dry air carries huge amounts of water from the solid particles of wheat bran to environment. According to Zhao et al. [Citation29], operational conditions accompanied with the selection of the solid substrate and the initial moisture content including water holding capacity and water retention capacity could prevent losses of water from SSF systems, thus improving the performance of the process. In this system, the final moisture content after 72 h fermentation for both fungi shows interesting differences. First, in the case of fermented A. awamori, the final moisture content in Control 1 decreased to about 60.99%. It was assumed that the moisture decrease was caused by evaporation process. In Control 2, moisture content was recorded to increase slightly (67.25%). Evaporated water from the water provided below the tray might give an advantage by supplying water vapour to the fermented substrate. At moistened air flow rates 1 and 2 L/min, the moisture content was around 66.03 and 65.20%, respectively. It was believed that the moistened air created in this system succeeded to maintain the moisture content of fermented substrate. However, by increasing the air flow rate to 4 and 6 L/min, the moisture content hugely decreased to 53.11 and 40.36%, respectively. This is because at high flow rates, pressure will be created inside the bioreactor and will carry some amount of water to the gas outlet.
Figure 3. Profile of final moisture content at 72 h for control experiment (uninoculated wheat bran: □), fermented wheat bran with A. awamori (▪) and A. oryzae (
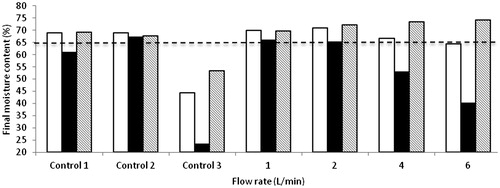
In Control 3 (dry air at 2 L/min), a greater loss of substrate moisture and consequent drying of the solids were observed. The final moisture content was recorded at 23.39% and this is one of the problems that we tried to solve in this study. Dry air at 2 L/min might be advantageous to remove heat and to discard CO2 evolved from the system. However, the dry air and high flow rate due to forced aeration will cause serious problems in the SSF system, and as a consequence, the water loss at such high rates in this system with A. awamori.
In the case of A. oryzae, the final moisture content increased for all flow rates applied in this study except in the experiment: Control 3 (dry air at flow rate 2 L/min). However, the final moisture content in Control 3 was still at a reasonable value, which is about 52%, compared to uninoculated wheat bran control (44.41%). The final moisture content in Control 1, Control 2, flow rate 1, 2, 4 and 6 L/min was recorded at about 69.31, 67.76, 69.76, 72.26, 73.43 and 74.16%, respectively. The moist air created in this system with different air flow rates succeeded to provide water to the fermented substrate. It has to be taken into account that in addition to water produced from metabolic activities, some water displaced via condensation during the fermentation process also contributes to the final moisture content of the fermented substrate. The results obtained in this study motivated us to study the water retention ability in both fungi (reported elsewhere) [Citation30]. A. oryzae proved to have high ability to retain water in its cells compared to A. awamori [Citation30]. Thus, a combination of the ability of wheat bran and A. oryzae to retain water resulted in high final moisture content in fermented A. oryzae.
Single circular tray SSB
The growth of A. awamori and A. oryzae on wheat bran as solid support was studied for different air flow rates. CO2 was chosen as growth indicator and its evolution is presented in . shows profiles of accumulated CO2 evolution for every air arrangement. The respiratory activity measured as CO2 evolution was very low for all air arrangement. When air flow rate increased up to 6 L/min, the respiratory activity and the growth were poorer compared to control experiments without air supply (Control 1 and 2). In the case of A. awamori ((AA)), the experiment with Control 1 recorded the highest CO2 evolution followed by the experiment with moistened air at flow rate 2 and 1 L/min, then Control 2, and Control 3 (dry air at 2 L/min). In the case of A. oryzae ((AO)), Control 1 evolved the highest of CO2 followed by Control 2, moistened air at flow rate 4 L/min, Control 3 (dry air at flow rate 2 L/min) and moistened air at flow rate 2 and 1 L/min. The experiment with moistened air at flow rate 6 L/min evolved the lowest CO2 for both fungi. The CO2 evolved decreased when the air flow rate was increased to 6 L/min. This is probably due to the high flow rate; O2 was washed out from the system and caused O2 limitation in the system. Another reason is because of the loss of high water content in A. awamori culture and accumulation of high water content in A. oryzae. Too dry and too wet fermentation conditions are not suitable for fungal growth. It is important to consider that high retention of water in A. oryzae can also affect O2 diffusion. For A. awamori, improvement in CO2 evolution was found at flow rate of 1 and 2 L/min (moistened air) as opposed to 4 L/min for A. oryzae. From , it can be observed that the experimental data obtained from the system using wheat bran were reproducible for every air arrangement experiment for CO2 evolution for both fungi. These raw data were then integrated and the Gompertz model was applied. Fitted parameters and correlation coefficients (R2) are reported in . The [] values confirmed the influence of air arrangement. For A. awamori, it can be seen that [
] evolution decreased linearly when the flow rate of moistened air was increased from 0 to 6 L/min. Likewise, CO2 evolution was higher at 4 L/min for A. oryzae. Control experiments without air supply showed higher CO2 evolution for both fungi. It is likely that the presence of different CO2 content in the headspace depends on the concentration of O2 in the solid medium, which is available to be used by fungi in the respiration process. By providing air flow, some amount of O2 might be moved out from the solid medium due to the pressure build-up, because of the flow especially at higher air flow rate. The evolution rate (
) values were comparable, all being between 0.44–0.54 and 0.49–0.61 for A. awamori and A. oryzae, respectively, though clear tendency can be seen in relation to the air supply. Values increased when moistened air flow rate was increased from 0 to 2 L/min, however, values decreased when the flow rate was increased from 4 to 6 L/min. However, there was no clear relationship between values of this parameter and the amount of CO2 evolved characterised by [
]. The tmax values calculated were close to those observed experimentally. These values were between 30.2 to 38.4 h and 30.4 to 39.7 h and did not seem to be influenced by the air arrangement. Fitting the model to all the experimental points gave R2 values above 0.998 and 0.991 for A. awamori and A. oryzae, respectively. Hence, it may be concluded that the experimental set-up and the analytical technique used for CO2 measurement in this study was sufficient.
Figure 4. Variation of cumulative CO2 evolved with time at different air flow rate during the growth of A. awamori [AA] and A. oryzae [AO] on wheat bran in single circular tray SSB. Symbols represent experimental data. The Gompertz model is shown as a solid line.
![Figure 4. Variation of cumulative CO2 evolved with time at different air flow rate during the growth of A. awamori [AA] and A. oryzae [AO] on wheat bran in single circular tray SSB. Symbols represent experimental data. The Gompertz model is shown as a solid line.](/cms/asset/19c1c7a8-b1bf-4d5d-8793-26a38c18de58/tbeq_a_1530950_f0004_c.jpg)
Table 3. Kinetics constants for different air flow rate according to Gompertz model.
Fitting models
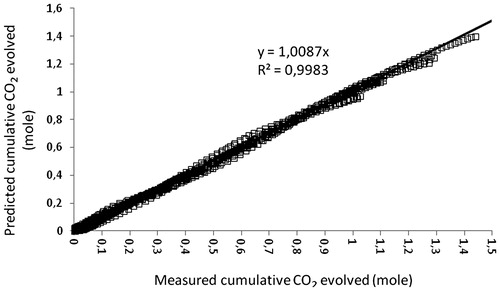
Fitting growth models to accumulated CO2 evolution raw data is meaningful and easier to handle for further analysis. It is recognised that in all the cases in this study, it was possible to use Gompertz model to describe fungal growth in SSF based on CO2 evolution. Data of CO2 evolution as a result of metabolic activity during SSF with A. awamori and A. oryzae on wheat bran were easy to handle with this model. It was observed, in this study, that the concentration of CO2 increases during SSF over time following a sigmoidal curve that describes fungal growth. Also, the variation patterns of sigmoidal curve were produced in response to different conditions (for example, different air arrangements in this study). shows the correlation between experimental and predicted data for the cumulative CO2 evolved by the behaviour of A. awamori and A. oryzae during SSF on wheat bran at various air arrangements in single circular tray SSB systems calculated with the Gompertz model. An excellent agreement between experimental and predicted values of A. awamori and A. oryzae were obtained with R2> 0.99. Thus, this model allowed an excellent prediction of the effects of various air and initial moisture content arrangements on CO2 evolution during SSF. From all experiments carried out in this study for CO2 evolution, the parameters showed that the total amount of [] was dependent on the type of fungus and air arrangement. Ultimately, given the assumptions that need to be considered, the Gompertz model would show potential and can be capable of describing what happens under different culture conditions.
Figure 5. Correlation between measured and predicted data of A. awamori and A. oryzae from all experiments conducted using wheat bran in single circular tray SSB.
For this study, Gompertz model was selected because it can reflect the sigmoidal nature of growth. In this study, for all air arrangements in single circular tray SSBs and for both fungi, growth followed a typical pattern with four distinct phases: a lag phase, an acceleration phase, a log (exponential) phase and a deceleration phase. However, there was no clear stationary phase and no accelerated death phase observed. In conclusion, it can be summarised that the Gompertz model is a model of choice for the description of the growth curves of A. awamori and A. oryzae. It is noteworthy that the potential of models to describe growth curves is not the only criterion for its assessment. Some other criteria, such as prediction of growth curve and estimation of some biological parameter, may be used for the selection of appropriate model. According to Mitchell et al. [Citation31], introducing a relevant approach to modelling the product formation kinetics in SSF is valuable owing to the difficulty in monitoring different variables involved in the fermentation systems. Christen et al. [Citation28] used the Gompertz model to represent the growth of Ceratocystis fimbriata in SSF. They presented that the curve gives good fit for the integrated data of CO2 and volatiles production. Soares et al. [Citation32] also applied the Gompertz model to the growth of the C. fimbriata to describe the total volatile compounds during SSF on coffee husks. Erkmen [Citation33] used the Gompertz model to represent the growth in Listeria monocytogenes, aerobic bacteria and lactic acid bacteria, during ripening and storage. They reported that the model provides parameters for different production methods in Gompertz model against microorganisms. Other authors used the Gompertz model growth curve to describe the time course of fermentation under different conditions for lipopeptide production by Bacillus amyloliquefaciens in SSF [Citation34]. Braissant et al. [Citation35] suggested the use of the Gompertz model as a growth model and its potential application to microcalorimetric data. They promoted further use of microcalorimetry in microbiology and biology and the use of such model that has become available to isothermal microcalorimetry end user. According to Winsor [Citation24], the Gompertz and log model possess similar properties that make them useful for the empirical representation of growth phenomena.
Gas balance – respiratory quotient
The respiratory quotient (RQ) can be calculated directly when the composition of the exhaust gas is known. All these values are interesting because they characterise physiology, specific performance of SSF bioreactor or total performance of fermentation. Since, those can be made available online, the RQ can be calculated online simply as:
(6)
(6)
where,
RQ is the respiratory quotient (dimensionless)
CER is the carbon dioxide evolution rate (mole/L.h)
OUR is the oxygen uptake rate (mole/L.h)
(7)
(7)
RQ characterises the state of the fungal population in the tray SSB and gives an indication of the fungal metabolic behaviour. RQ = 1, when substrates are simple sugars or related substances where glucose oxidation is taking place, easily [Citation36]. According to EquationEquation (7)(7)
(7) , a theoretical RQ of oxidation of glucose for aerobic microorganisms is equal to 1. The equation shows that during glucose fermentation through aerobic fermentation, the rate of O2 consumption in ideally six molecules and six molecules of CO2 are produced per glucose molecule. It must be kept in mind, that solid substrate waste used in SSF has varying composition of carbon and nitrogen. Some contain complex compositions such as hemicellulose, cellulose and lignin. In this situation, microorganisms need to utilise the entire complex compound and produce simple fermentative sugars before these can be easily consumed. In practical terms in SSF, it is impossible to obtain RQ = 1. When RQ < 1, it is assumed that one or more non-constitutive or newly induced metabolites have possibly been produced. In other words, when O2 was consumed by fungus, other products, such as energy (ATP), water and secondary metabolites, were produced along with CO2. Furthermore, O2 is not only used for the respiration process, but also for other tasks such as cell maintenance. EquationEquation (8)
(8)
(8) summarizes the SSF of organic material in solid substrates.
(8)
(8)
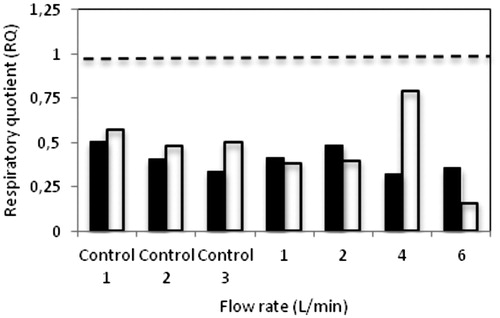
RQ > 1 indicates that O2 uptake is low and fermentation of glucose is occurring. In practical terms, RQ values greater than one are taken as an indication that anaerobic fermentation is occurring. Usually in high-aerated fermentation systems, it must be considered that the higher production of CO2 relative to O2 corresponds to the presence anaerobic zones in the fermenter [Citation13,Citation36,Citation37]. Further discussion of off gas analysis is provided in this study for single circular tray SSB with variable air arrangements. The rates of O2 consumption and CO2 evolution are presented along the calculated RQ values, giving further insights into the behaviour of the fermentation process. shows the profiles of RQ obtained using Equation (6) for both fungi in single circular tray SSB with various air arrangements. The RQ values are presented in by obtaining the slope from every experiment illustrated in . It was observed in these studies that all RQ values obtained from single circular tray SSB with different air arrangements are below 1 (). Various values of RQ were obtained in this study as responses to the reaction of fungi with the quantity of air provided into the system. However, it is difficult to correlate the effect of different flow rates of moistened air with the fungal behaviour in this study. For example, in the case of single circular tray SSB, RQ = 0.507 in Control 1 experiments (no water and no air) was the highest among the others in fermented A. awamori. Surprisingly, moistened air at different flow rates had apparently no remarkable effect on the RQ value. The experiments with flow rate 4 L/min with adequate O2 and water content exhibited low RQ compared to control experiments (Control 1 and Control 2), which had been initially assumed to promote high RQ values. However, in fermented A. oryzae, moistened air at flow rate 4 L/min recorded the highest RQ value (RQ = 0.789), which indicates that good growth occurred in this system. In experiments with flow rate 6 L/min, the RQ values averaged to 0.357 and 0.159 for A. awamori and A. oryzae, respectively, which reflected the current metabolic activity in environments dominated by O2-deficient substrates. It was believed that at high flow rate, most of the O2 was washed out from the system. can support this where the production of [] was among the lowest evolved during SSF. In any case, a low RQ indicates that less CO2 is evolved per unit of O2 consumed. However, low RQ values cannot directly be linked to anaerobic conditions. With large area of fermented surface and the flow of air, it seems O2 taken by fungus is less and more O2 is carried into the gas outlet. This might be because O2 has to diffuse from the gas phase to inside the fermented bed whereas the CO2 is generated inside throughout and has to diffuse outside compared to the other air arrangement where moistened air was forced through the fermented substrate from bottom to the top. Other factors, such as the effect of readily degradable nutrient compounds contained in the fermented substrate, seem to be key for determining the RQ value.
Figure 6. Profiles of RQ in single circular tray SSB systems with the fungi A. awamori [AA] and A. oryzae [AO] with different air arrangements. The straight line represents RQ =1.
![Figure 6. Profiles of RQ in single circular tray SSB systems with the fungi A. awamori [AA] and A. oryzae [AO] with different air arrangements. The straight line represents RQ =1.](/cms/asset/4b2389f2-28cf-42a0-ac2d-3e5f14fb6784/tbeq_a_1530950_f0006_c.jpg)
Figure 7. Respiratory quotient (RQ) during SSF of A. awamori (▪) and A. oryzae (□) on wheat bran using single circular tray SSB with different air arrangements. The dashed line represents RQ =1.
The relation between respiratory quotient and carbon dioxide evolution
The experiments conducted in this study showed that the rate of O2 consumption and CO2 evolution in A. awamori and A. oryzae are highly correlated. shows linear regression analysis of the relationship between [] and RQ giving a straight line (R2> 0.862) for both fungi using data from 14 experiments. Changes in RQ value can be correlated with changes in the metabolic condition of the fungus. The higher RQ values of the metabolic activity may result from beneficial microbial respiration by O2 consumption and CO2 evolution rate. Thus, A. awamori and A. oryzae apparently adapt to the degree of complete oxidation (microbial respiration) and utilisation of the available nutrients provided in the system (water, O2, etc.).Undoubtedly, measuring the amount of evolved CO2 or consumed O2 during SSF will lead to obtaining RQ that is able to describe different patterns of fungal metabolic behaviour. RQ has proven to be an effective indicator for the control of metabolic conditions in SSF processes. When used as a guide for growth development, RQ levels associated with biomass accumulation phase should be maintained throughout the development of the fermentation conditions. If any of the subsequent RQ phases are allowed to occur during the growth, subsequent productivity can be compromised. It must be kept in mind that all of these considerations are based on the employment of solid substrates comprising simple sugars or related carbohydrates or polysaccharides. Different solid substrates, the substrate properties and the overall metabolic pathway must be taken into account to obtain a proper value for the RQ [Citation13,Citation36,Citation38]. However, it would be convenient for a basic laboratory SSF bioreactor to have a system for gas analysis at the outlet of the bioreactor.
Figure 8. Relationship between RQ with [] obtained from every air arrangement using single circular tray systems with A. awamori and A. oryzae cultures.
![Figure 8. Relationship between RQ with [CO2max] obtained from every air arrangement using single circular tray systems with A. awamori and A. oryzae cultures.](/cms/asset/e60bbd04-4fef-438d-b2b9-0dd9900fcaba/tbeq_a_1530950_f0008_b.jpg)
Heat evolution during solid state fermentation
The temperature profiles of the fermented bed were recorded during 72 h fermentation time are shown in for A. awamori and A. oryzae. As illustrated in , air circulated from below the perforated mesh tray results in temperature and gas concentration gradients within the fermented bed. It was assumed that heat is driven off by forcing it through the top of the fermented bed. To observe the effectiveness of moistened air in this system, experiments without air were also carried out (Control 1 and 2). In the case of A. awamori, during the first 18 h of fermentation time, the bed temperature stayed constant between 30 and 31 °C for all experiments except for flow rate 6 L/min. Only after 48 h, the temperature of the bed started to increase gradually and this showed that at this point the growth of fungi and metabolic activities were at a high level. Experiment Control 1 and that with moistened air at 2 L/min showed an increment temperature of almost 5 °C. Control 2, Control 3, moistened air at 1 L/min recorded an increment in the range 2–3 °C. Experiment with flow rate at 4 L/min showed temperature at a constant range 30–31 °C during 72 h of fermentation. The temperature of fermented bed was recorded below 30 °C until the end of fermentation for the higher flow rate at 6 L/min. In the case of A. oryzae, experiment Control 1 recorded metabolic heat and achieved almost 40 °C. Control 1 experiment, where there is no air introduced into the system, showed heat accumulation in the system. However, in Control 2, when only air was blown below the tray, it still showed an effect on bed temperature. This result showed that maximum temperature reached about 34 °C and after that it was maintained between 31 and 32 °C until the end of fermentation. As predicted, Control 3 with dry air was greatly efficient in discarding metabolic heat and able to control temperature below 32 °C. In other experiments (moistened air at 1, 2 and 4 L/min), the temperatures were recorded at optimal level and an increment in the range 1–4 °C was observed. This flow rate is assumed to give a good performance and as a result, a better temperature control. In the experiment with flow rate 6 L/min, the temperature of fermented bed was recorded below 30 °C until the end of fermentation. For culture system with A. oryzae, the role of either dry air or moistened air succeeded in removing the heat form the system. In this strategy where the air flow rate was set up at a higher rate of 6 L/min into the water reservoir below the tray, air was blown forcefully through the tray and solid particles and heat removal was clearly observed. It is clearly observed from this system, heat accumulation is partially overcome by forced aeration and cooling strategies, but high temperatures can still be reached at the gas phase and near the air outlet with certain experiments. As an example from these studies, we found that during the time of peak heat production, the temperature can rise almost to 8–10 °C or more above the optimum temperature. A large amount of heat is generated during SSF, which is directly proportional to the metabolic activities of fungus [Citation20]. Heat accumulation is high, which can cause denaturation of products such as enzymes. In forcefully aerated bioreactors, the air is blown directly into fermented substrate resulting in improving contact between the air and the substrates particles [Citation31,Citation39]. At the same time when the temperature decreased to 5–7 °C below optimum temperature, this also can have a negative effect on growth and microbial activity.
Figure 9. Effect of the different air flow rate on the heat evolution of A. awamori [AA] and A. oryzae [AO] grown on wheat bran performed in single circular tray.
![Figure 9. Effect of the different air flow rate on the heat evolution of A. awamori [AA] and A. oryzae [AO] grown on wheat bran performed in single circular tray.](/cms/asset/e1245f0e-a3ff-4402-a01c-05287c4c9115/tbeq_a_1530950_f0009_c.jpg)
Conclusions
This study demonstrated that the air arrangements using moistened air were successful in maintaining moisture content, adequate O2 supply and control of temperature. It was observed that A. awamori and A. oryzae have their own ability and performance to grow in a solid substrate, and fermentation conditions may lead to possible comparisons. Even though the present study is on a bench scale, it is hoped that the work with bioreactor systems will provide greater general understanding. The findings could have several potential benefits including contributing to future designs and applications, and help to establish SSF as a viable alternative to SmF processes. Furthermore, the model system of single circular tray SSB systems demonstrated an impressive system for future study of mass transfer and possibly for large-scale operation, though considerable optimisation work remains to be done; for example, the height/diameter ratio and total number of trays should be optimised.
Disclosure statement
No potential conflict of interest was reported by the authors.
Additional information
Funding
References
- Mitchell DA, de Lima Luz LF, Krieger N. Bioreactors for solid-state fermentation. In: Moo-Yong M. editor. Comprehensive biotechnology. 2nd ed. Amsterdam: Elsevier B.V.; 2011. p. 347–360.
- Ashok A, Doriya K, Rao DRM, et al. Design of solid state bioreactor for industrial applications: an overview to conventional bioreactors. Biocatal Agri Biotechnol. 2017;9:11–18.
- Weber FJ, Oostra J, Tramper J, et al. Validation of a model for process development and scale-up of packed-bed solid-state bioreactors. Biotechnol Bioeng. 2002;77:381–393.
- Hamidi-Esfahani Z, Shojaosadati SA, Rinzema A. Modelling of simultaneous effect of moisture and temperature on Aspergillus niger growth in solid state fermentation. Biochem Eng J. 2004;21:265–272.
- Nagel FJJI, Tramper J, Bakker MSN, et al. Temperature control in a continuously mixed bioreactor for solid-state fermentation. Biotechnol Bioeng. 2001;72:220–230.
- Said FM, Chisti Y, Brooks J. The effects of forced aeration and initial moisture level on red pigment and biomass production by Monascus ruber in packed bed solid state fermentation. International J Env Sc Dev. 2010;1(1):1–4.
- Von Meien OF, Luz LFL, Jr Mitchell DA, et al. Control strategies for intermittently mixed, forcefully aerated solid-state fermentation bioreactors based on the analysis of a distributed parameter model. Chem Eng Sci. 2004;59:4493–4504.
- Mitchell DA, Berovic M, Nopharatana M, et al. Introduction to solid-state fermentation bioreactors. In: Mitchell DA, Krieger N, Berovic M, editors. Solid-state fermentation bioreactors: fundamentals of design and operation. Berlin Heidelberg (Germany): Springer-Verlag; 2006. p. 33–43.
- Mitchell DA, Krieger N. Berovic M, et al. Group IVa: continuously-mixed, forcefully-aerated bioreactors. In: Mitchell DA, Krieger N, Berovic M, editors. Solid-state fermentation bioreactors: fundamentals of design and operation. Berlin Heidelberg (Germany): Springer-Verlag; 2006. p. 115–128.
- Garcia-Ochoa F, Gomez E. Bioreactor scale-up and oxygen transfer rate in microbial processes: an overview. Biotechnol Adv. 2009;27:153–176.
- Mitchell DA, Krieger N, Berovic M. Solid state fermentation bioreactors: fundamentals of design and operation. Berlin Heidelberg (Germany): Springer-Verlag; 2010.
- Krishna C. Solid-state fermentation systems – an overview. Crit Rev Biotechnol. 2005;25:1–30.
- Pandey A, Soccol CR, Rodriguez-Leon JA, et al. Aspects of design of fermenter in solid-state fermentation. In: Pandey A, Soccol CR, Rodriguez-Leon JA, et al. editors. Solid-state fermentation in biotechnology: fundamentals and application. New Delhi (India): Asiatech Publishers; 2001. p. 73–77.
- Mitchell DA, Berovic M, Krieger N. Overview of solid state bioprocessing. Biotechnol Annu Rev. 2002;8:183–225.
- Mitchell DA, Tongta A, Stuart DM, et al. The potential for establishment of axial temperature profiles during solid-state fermentation in rotating drum bioreactors. Biotechnol Bioeng. 2002;80:114–122.
- Pandey A, Soccol CR, Laroche C. General and fundamentals aspects of SSF – introduction. In: Pandey A, Soccol CR, Laroche C, editors. Current development in solid-state fermentation. New Delhi (India): Springer, Asiatech Publishers; 2008. p. 3–12.
- Pandey A, Soccol CR, Larroche C. Preface. In: Pandey A, Soccol CR, Larroche C, editors. Current developments in solid-state fermentation. New Delhi (India): Springer, Asiatech Publishers; 2008. p. v–vi.
- Rodriguez-Fernandez DE, Rodriguez-Leon JA, de Carvalho JC, et al. The behaviour of kinetic parameters in production of pectinase and xylanase by solid-state fermentation. Biores Technol. 2011;102:10657–10662.
- Robinson T, Nigam P. Bioreactor design for protein enrichment of agricultural residues by solid state fermentation. Biochem Eng J. 2003;13:197–204.
- Shojaosadati SA, Hamidi-Esfahani Z, Hejazi P, et al. Evaluation of strategies for temperature and moisture control in solid state packed bed bioreactors. Iranian J Biotechnol. 2007;5:219–225.
- Ge X, Vasco-Correa J, Li Y, et al. Solid-state fermentation bioreactors and fundamentals. In: Larroche C, Sanroman MA, Du G, editors. Current developments in biotechnology and bioengineering. Amsterdam: Elsevier B.V.; 2017. p. 381–402.
- Abdul Manan M. Design aspects of solid state fermentation [dissertation]. Manchester (UK): University of Manchester; 2014.
- Sukatsch DA, Dziengel A. Biotechnology: a handbook of practical formulae. New York: Longman Scientific & Technical, Wiley; 1987.
- Winsor CP. The Gompertz curve as a growth curve. Proc Natl Acad Sci USA.. 1932;18:1–8.
- Skiadas CH, Skiadas C. Comparing the Gompertz models with a first passage time density model. In: Skiadas CH, editor. Advances in data analysis. Birkhauser Boston: Springer; 2008. p. 203–209.
- Saucedo GC, Gonzalez PB, Revah SM, et al. Effect of Lactobacilli inoculation on cassava (Manihot esculenta) silage: fermentation pattern and kinetic analysis. J Sci Food Agric. 1990;50:467–477.
- Meraz M, Shirai K, Larralde P, et al. Studies on the bacterial acidification process of cassava (Manihot esculenta). J Sci Food Agric. 1992;60:457–463.
- Christen P, Meza JC, Revah S. Fruity aroma production in solid state fermentation by Ceratocystis fimbriata: influence of the substrate type and the presence of precursors. Mycological Res. 1997;101:911–919.
- Zhao HM, Guo XN, Zhu KX. Impact of solid state fermentation on nutritional, physical and flavor properties of wheat bran. Food Chem. 2017;217:28–36.
- Abdul Manan M, Webb C. Water retention value: a study model-based by Aspergillus awamori and Aspergillus oryzae embrace three models of solid substrate. J Life Sci. 2016;8:420–429.
- Mitchell DA, von Meien OF, Krieger N, et al. A review of recent developments in modelling of microbial growth kinetics and intraparticle phenomena in solid-state fermentation. Biochem Eng J. 2004;17:15–26.
- Soares M, Christen P, Pandey A, et al. Fruity flavor production by Ceratocystis fimbriata grown on coffee husk in solid-state fermentation. Proc Biochem. 2000;35:857–861.
- Erkmen O. Modelling the effects of sucuk production technique on Listeria monocytogenes, aerobic bacteria and lactic acid bacteria during ripening and storage. Food Bioproducts Proc. 2008;86:220–226.
- Zhu Z, Sun L, Huang X, et al. Comparison of the kinetics of lipopeptide production by Bacillus amyloliquefaciens XZ-173 in solid-state fermentation under isothermal and non-isothermal conditions. World J Microbiol Biotechnol. 2013;30:1–9.
- Braissant O, Bonkat G, Wirz D, et al. Microbial growth and isothermal microcalorimetry: growth and their application to microcalorimetric data. Thermochimica Acta. 2013;555:64–71.
- Pandey A, Soccol CR, Rodriguez-Leon JA, et al. Kinetics of solid-state fermentation. In: Pandey A, Soccol CR, Rodriguez-Leon JA, et al. editors. Solid-state fermentation in biotechnology: fundamentals and application. New Delhi (India): Asiatech Publishers; 2001. p. 32–51.
- Torres-Mancera MT, Figueroa-Montero A, Favela-Torres E, et al. Online monitoring of solid-state fermentation using respiratory. In: Pandey A, Larroche C, Soccol C, editors. Current developments in biotechnology and bioengineering. Amsterdam: Elsevier B.V.; 2018. p. 83–95.
- Pandey A, Soccol CR, Mitchell DA. New developments in solid state fermentation. I: processes and products. Process Biochem. 2000;35:1153–1169.
- Mitchell DA, Krieger N, Stuart DM, et al. New developments in solid-state fermentation: II. Rational approaches to the design, operation and scale-up of bioreactors. Proc Biochem. 2000;35:1211–1225.