
Abstract
In this study, target region amplification polymorphism (TRAP) and conserved region amplification polymorphism (CoRAP) markers were used for genetic diversity and relationship analysis of 25 Salvia ecotypes/species. Twelve TRAP and CoRAP primer combinations (four arbitrary primers and three fixed primers from Salvia miltiorrhiza expressed sequence tag sequences) amplified 180 loci, of which all were polymorphic. The obtained high average PIC and MI values revealed high capacity of TRAP and CoRAP primers to detect polymorphic loci among Salvia species. TRAPs and CoRAPs had similar efficiency in detecting polymorphisms with excellent ability to differentiate the closely related Salvia ecotypes. Based on both TRAP and CoRAP data, tetraploid Salvia virgata (2n = 4x = 32) showed the highest values for Na (1.17, 1.29), Ne (1.29, 1.35), Shannon index (0.26, 0.32) and heterozygosity (0.172, 0.212) in all 11 studied species. The Nei’s genetic distances with TRAPs and CoRAPs ranged from 0.23 to 0.69 and 0.19 to 0.64, respectively. The tree pattern based on combined CoRAP + TRAP data with the neighbour joining method clustered 25 Salvia species/ecotypes into five major groups that showed good alignment with the population structure analysis results. In both TRAPs and CoRAPs data analysis of molecular variance (AMOVA), the estimated variance within Salvia species was greater than that among Salvia species.
Keywords:
Introduction
The principal diversity centres for Salvia genus are in Southwest Asia and South America [Citation1]. Salvia is widely cultivated in different parts of the world as well as in Iran [Citation2]. Some species of this genus are used in folk medicine [Citation3]. Also, some Salvia species have medicinal attributes such as anti-inflammatory, anti-platelet, and anti-thrombotic effects [Citation4–6]. Essential oils and terpenoids are abundant chemical components in Salvia species [Citation7].
Awareness of the genetic diversity levels among plant germplasm is essential for establishing, managing and ensuring the long-term success of plant-breeding programmes [Citation8]. With the fast progress of plant functional genomics research in recent years, many novel gene-targeted molecular marker techniques have been developed such as target region amplification polymorphism (TRAP), conserved region amplification polymorphism (CoRAP), and conserved DNA-derived polymorphism (CDDP) [Citation9–11]. Targeted region amplified polymorphism (TRAP), a relatively high-throughput marker system, is a simple polymerase chain reaction (PCR)-based marker technique employing bioinformatics to detect genetic variation at the DNA level based on available DNA sequence information [Citation9]. TRAP uses a fixed primer designed from a target expressed sequence tag (EST) in the database and a second arbitrary primer containing the AT- or GC-rich cores that target the intron or exon regions to amplify DNA fragments [Citation12]. TRAP is useful for genotyping and targeting markers associated with desirable traits in plants for marker-assisted selection [Citation13]. It has also been effectively used in estimating genetic diversity [Citation14]. Compared with other marker techniques, TRAP has the advantages of simplicity, high stability and repeatability, especially preferential targeting and appropriate polymorphism information [Citation15,Citation16]. The effectiveness of the TRAP marker system in determining genetic diversity is reported in wheat [Citation17–22], sunflower [Citation9,Citation23,Citation24], lettuce [Citation25], common bean [Citation26], sugarcane [Citation27], spinach [Citation28], faba bean [Citation29], Lentinula edodes [Citation30], Auricularia auricula-judae [Citation15] and pea [Citation31]. Hu et al. [Citation25] reported that TRAP markers were able to differentiate 53 lettuce cultivars which were very similar in terms of horticultural properties and types. The known systematics of sugarcane was confirmed using TRAP markers [Citation27]. Miklas et al. [Citation26] reported new TRAP markers in association with disease resistance in common bean.
CoRAP is similar to TRAP since it is also based on the use of a fixed primer derived from targeted ESTs and an arbitrary primer [Citation10]. The only difference between CoRAP and TRAP is in the arbitrary primer, which contains a different core sequence motif (CACGC) that is commonly found in plant gene introns. This core motif sequence guarantees the use of conserved intron sequences in comparative genomics while the fixed primers anneal to coding sequences, together generating highly informative and reliable DNA fingerprints. The advantage of CoRAP and TRAP markers is that the EST-based fixed primers have specific binding sites on the exon of the target gene or sequence, whereas the arbitrary primers will bind to other exon regions in TRAPs and to the introns in CoRAPs. Wang et al. [Citation10] used CoRAP to genotype Salvia miltiorrhiza from different geographical origins of China. Their PCRs generated as many as 30–50 fragments of 50 to 1000 bp in size. They reported successful DNA genotyping of Salvia miltiorrhiza by CoRAP and demonstrated that this new genotyping method is rapid, efficient and reproducible.
The objective of this study was to apply TRAPs and CoRAPs to evaluate the level and pattern of genetic diversity in different important wild and cultivated species of Salvia. Also, as there were few reports testing TRAP in the genotyping of different Salvia species, another objective was to demonstrate that TRAP could provide markers that distinguish between Salvia species.
Materials and methods
Plant materials and DNA extraction
We used a collection of 25 ecotypes related to 11 Salvia species including Salvia aethiopis, Salvia macrosiphon, Salvia nemorosa, Salvia officinalis, Salvia reuterana, Salvia sclarea, Salvia syriaca, Salvia spinosa, Salvia verticillata, Salvia virgata and Salvia eremophila from different geographical regions of Iran (). The Salvia seeds were provided by the Research Institute of Forest and Rangelands in Iran. Ten seeds from each ecotype were sowed in a greenhouse and young leaves from two-week-old seedlings were ground in liquid nitrogen for DNA extraction. The young leaves bulked powder samples (0.25 g) for each ecotype were transferred to a tube adding 1 mL of preheated cetyltrimethyl ammonium bromide (CTAB) extraction buffer (2% CTAB, 25 mmol/L ethylenediaminetetraacetic acid (EDTA), 100 mmol/L Tris-HCl, 2.5 mol/L NaCl, 2% polyvinylpyrrolidone (PVP), 1% β-mercaptoethanol and incubated at 65 °C in a water bath for 60 min. Then, DNA was extracted using the CTAB method and DNA pellets were dried and dissolved in 200 µL Tris-EDTA buffer. The quality and quantity of the extracted DNAs were evaluated in 0.8% agarose gels and by spectrophotometry.
Table 1. Characteristics of Salvia ecotypes/species used for genetic diversity analysis.
TRAP and CoRAP primer design
Two arbitrary primers for TRAP, two arbitrary primers for CoRAP and three fixed primers for both of them used in this study are based on those described by Li and Quiros [Citation12], Hu et al. [Citation25] and Wang et al. [Citation10]. Fixed primers for CoRAP and TRAP markers were designed on the basis of three Salvia miltiorrhiza EST sequences CV171606, CV171904 and CV172318 (http://www.ncbi.nlm.nih.gov/dbEST/index.html). Arbitrary reverse primer sequences for TRAP included three selective nucleotides at the 3′ end, four nucleotides of AT- or GC-rich content in the core region, and 11 nucleotides as filler sequences at the 5′ end. Arbitrary reverse primer sequences for CoRAP contained a core sequence motif CACGC. The primers were designed using web-based Primers 3 software (http://frodo.wi.mit.edu/cgibin/primer3/primer3_www.cgi) [Citation32]. All fixed and arbitrary designed primers () were synthesized by Bioneer (Bioneer Co., Daejeon, Korea).
Table 2. Sequences of fixed and arbitrary primers used for TRAP and CoRAP markers.
PCR amplification
Amplifications were performed using a DNA thermal cycler (Techn Model TC-5000) in a 25 μL reaction mixture containing 50 ng template DNA, Taq PCR Master Mix 1X (Amplicon, Denmark), 0.4 μmol/L of each fixed and arbitrary primer and ddH2O. The TRAP PCR was modified based on Hu and Vick [Citation9] with the following program: 94 °C for 4 min, 5 cycles of 94 °C for 45 s, 35 °C for 50 s and 72 °C for 70 s, then 35 cycles of 94 °C for 50 s, 52 °C for 50 s and 72 °C for 90 s, and a final extension step of 10 min at 72 °C. CoRAP PCR amplifications were carried out with a first denaturation step of 4 min at 94 °C, followed by 40 cycles of 1 min at 94 °C, 1 min at 52 °C and 90 s at 72 °C and a final extension of 10 min at 72 °C. After PCR, the amplified products were separated in a 10% polyacrylamide denaturing gel for 3 h at 400 V. The gel was developed and visualized using silver staining.
Data analysis
Only clearly distinguishable and reproducible products of each TRAP and CoRAP primer combination were selected and scored using a binary code (1, 0) for each genotype. The number of polymorphic loci (PB) and polymorphism percentage (PPB) were calculated for each primer combination. Also the suitability of both TRAP and CoRAP markers to evaluate the genetic variability of Salvia ecotypes/species was measured using the following parameters: polymorphism information content (PIC) and marker index (MI) calculated to characterize the capacity of each primer to detect polymorphic loci among the genotypes [Citation33]. MI was calculated for each primer combination as MI = PIC × EMR, where PIC is the mean PIC value, EMR is the product of the number of polymorphic loci per primer (n) and the fraction of polymorphic fragments (β). The basic genetic diversity parameters including number of different alleles (Na), number of effective alleles (Ne), Shannon’s information index of genetic diversity (I) and unbiased expected heterozygosity (UHe) were calculated using the POPGENE software [Citation34]. Using the data matrix of both markers, the pairwise Nei’s unbiased genetic distance was calculated [Citation35]. The genetic distance values were used to generate a consensus tree using the neighbour-joining method algorithm. Analysis of molecular variance (AMOVA) was used to calculate the variation among and within populations using GenAlEx 6.501 ver. 6.41. The population structure analysis was done using STRUCTURE 2.3.4 [Citation36,Citation37].
Results and discussion
TRAP analysis
The banding patterns produced by the TRAP and CoRAP markers using the 12 primer combinations across all 25 ecotypes/species are summarized in . All six TRAP primer combinations produced multiple PCR fragments (bands) in each of the 25 ecotypes/species which ranged in size from 100 to 1500 base pairs. A total of 90 unambiguous and recordable bands were scored (), of which all were polymorphic. The total number of polymorphic fragments amplified by the individual primer combinations ranged from 13 (E2 + M2 and E1 + M2) to 20 (E3 + M1) with an average of 15 bands per primer combination. The PIC values, averaged over all polymorphic loci for individual primer combinations, varied from 0.38 to 0.44 with an overall mean of 0.42 ± 0.022. The MI for the TRAP primer combinations ranged from 1.91 (E2 + M2) to 3.88 (E3 + M1), with an overall mean of 3.05 (). The Shannon index (I) and unbiased expected heterozygosity (UHe) among all studied ecotypes of Salvia for TRAP data were calculated to be 0.163 ± 0.008 and 0.14 ± 0.007, respectively (). The highest I (0.26) and UHe (0.172) were observed in Salvia virgata. The AMOVA results showed that 43% and 57% of the total variance occurred among and within Saliva species, respectively (). The high level of polymorphism could be attributed to the complex genetic structure of different Salvia species. The average pairwise Nei’s genetic distance was 0.46, with a range from 0.23 to 0.69 (). The three most closely related pairs of species, which showed smaller genetic distances, were S. virgata/S. officinalis, S. virgata/S. nemorosa and S. officinalis/S. macrosiphon. Conversely, the least related pairs of species showed the highest differences, with genetic distances of 0.69 and 0.66, including S. eremophila/S. aethiopis, S. eremophila/S. spinosa, S. verticillata/S. spinosa and S. macrosiphon/S. aethiopis.
Table 3. Banding pattern revealed by TRAP and CoRAP primer combinations.
Table 4. Genetic variation features estimated using TRAP and CoRAP markers in the studied Salvia species.
Table 5. Analysis of molecular variance (AMOVA) based on TRAP and CoRAP markers for Salvia ecotypes/species.
Table 6. Pairwise species matrix of Nei’s genetic distance using TRAP (below diagonal) and CoRAP (above diagonal) markers.
CoRAP analysis
The six CoRAP primer combinations produced a total of 90 unambiguous and recordable bands (), of which all were polymorphic. The number of polymorphic fragments amplified by each primer combination ranged from 10 (E1 + A2) to 29 (E3 + A1) and the sizes of the amplified fragments ranged from 200 to 2000 base pairs. The PIC values, averaged over all polymorphic loci for individual primer combinations, varied from 0.26 (E1 + A2) to 0.43 (E3 + A1) with an overall mean of 0.377 ± 0.065. The highest number of polymorphic bands (29) was obtained with primer combination E3 + A1, and the lowest (10) with primer combination E1 + A2. CoRAPs MI ranged from 0.42 (E1 + A2) to 6.19 (E3 + A1), and the mean MI per CoRAP was 2.49 (). The Shannon index and unbiased expected heterozygosity among all studied ecotypes of Salvia for CoRAP data were calculated as 0.169 ± 0.009 and 0.143 ± 0.007, respectively (). Also, similar to TRAP results, the highest I (0.32) and UHe (0.212) were observed in Salvia virgata. AMOVA showed that 34% and 66% of the total variance occurred among and within Saliva species, respectively (). The average pairwise Nei’s genetic distance was 0.37, ranging from 0.19 to 0.64. The most closely related pairs of species, which showed smaller genetic distances, were S. virgata/S. verticillata, S. virgata/S. officinalis, S. virgata/S. nemorosa, S. virgata/S. macrosiphon and S. nemorosa/S. macrosiphon. The least related pairs of species showed greater differences, with genetic distances of 0.64, 0.59 and 0.53, including S. verticillata/S. syriaca, S. verticillata/S. aethiopis and S. eremophila/S. reuterana ().
In the present study, using the 12 TRAP and CoRAP tested primer combinations, a total of 180 bands were generated; of which all were polymorphic (100%). The observed polymorphism in the tested TRAPs and CoRAPs on Salvia species was similar to the polymorphism percent (100%) obtained by SCoT markers among wild Salvia accessions [Citation38] and higher than that reported for other markers, for example, ISSRs in Salvia miltiorrhiza [Citation39], ISSRs and RAPDs [Citation40] and AFLP markers in other Salvia species [Citation41] as 95%, 93.9% and 99% polymorphism, respectively. Our results showed that the average values of PIC and MI for the TRAP primers were higher than those of the CoRAP primers, which illustrates the good applicability of TRAPs in the genotyping of Salvia species. The PIC value can be used to select the most appropriate markers for genetic mapping. Also, the high MI reflects the marker efficiency to simultaneously analyze a large number of bands [Citation33].
The Shannon diversity index values calculated from both TRAPs and CoRAPs were consistent with the species genetic variability level. Comparable PIC values have been reported with dominant markers like RAPD and AFLP in African plantain (Musa paradisiaca) [Citation42], ISSRs and RAPDs in Salvia species [Citation40], AFLP in wheat (Triticum aestivum) [Citation43] and SCoT markers [Citation44–48]. TRAP and CoRAP are relatively high-throughput PCR-based marker systems; they appear to be very efficient relative to other systems. The TRAP and CoRAP techniques now take advantage of the availability of sequence information, using the known partial sequence of a candidate gene as the fixed primer and an arbitrary primer to amplify the putative candidate gene regions. Moreover, they do not require extensive pre-PCR processing of templates, as does the AFLP technique. Instead, the total genomic DNA is used as template, thereby making TRAP and CoRAP markers development as user-friendly as SSRs but much more efficient in the number of markers generated. Thus, they should be useful in plant genomics research involved in marker-trait association.
In this study, the estimated variance within Salvia species was greater than among them in both TRAP and CoRAP AMOVAs. Therefore, these two genetic marker systems revealed high genetic variability within Salvia species. Accordingly, identification and protection of different Salvia species/ecotypes from various geographical areas of Iran would be important in the conservation strategies. These results are in agreement with previous reports showing high levels of genetic diversity among different species/ecotypes of genus Salvia using ISSR and RAPD [Citation40], ISSR and SCoT [Citation46], and ISSR [Citation49,Citation50] markers.
Genetic relationships, clustering and structure analysis
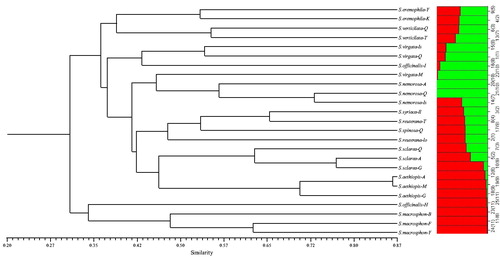
Species clustering based on the neighbour-joining method with TRAP markers clustered the 25 Salvia species/ecotypes into six major groups (). Cluster 1 included S. eremophila (Yazd) and S. eremophila (Kerman); Cluster 2 included S. verticillata (Qazvin) and S. verticillata (Tehran); Cluster 3 consisted of S. virgata (Qazvin), S. virgata (Isfahan), S. officinalis (Isfahan); Cluster 4 was divided into 4 subclusters. The first subcluster comprised of S. nemorosa (Ardebil), S. nemorosa (Qazvin), S. nemorosa (Isfahan) and S. virgata (Mazandaran); the second subcluster comprised of S. syriaca (Ilam), S. reuterana (Lorastan), S. spinosa (Qazvin) and S. reuterana (Tehran); the third subcluster comprised of S. sclarea (Qazvin), S. sclarea (Ardebil) and S. sclarea (Guilan); the fourth subcluster comprised of S. aethiopis (Ardebil), S. aethiopis (Mazandaran) and S. aethiopis (Guilan). Within the fourth subcluster, S. aethiopis (Ardebil) and S. aethiopis (Mazandaran) appeared to be closer to each other. Cluster 5 only included S. officinalis (Hamedan) and Cluster 6 composed of three ecotypes of S. macrosiphon (Bushehr), S. macrosiphon (Fars), S. macrosiphon (Yazd).
Figure 1. Dendrogram of Salvia ecotypes/species based on TRAP data using the neighbour-joining (NJ) method and their corresponding structure (K = 2) analysis.
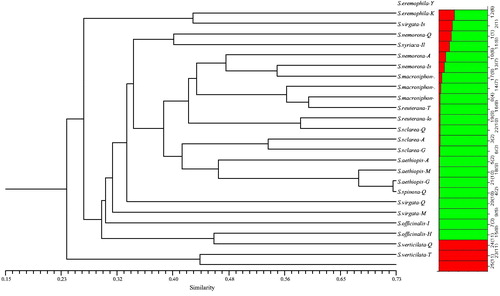
The tree constructed using the CoRAPs data clustered the 25 Salvia species/ecotypes into eight major groups (). Cluster 1 included S. eremophila (Yazd) and S. eremophila (Kerman); Cluster 2 included S. virgata (Isfahan) and S. nemorosa (Qazvin); Cluster 3 was divided into 5 subclusters. The first subcluster comprised of S. nemorosa (Ardebil), S. nemorosa (Isfahan) and S. syriaca (Ilam); the second subcluster comprised of S. macrosiphon (Bushehr), S. macrosiphon (Fars) and S. macrosiphon (Yazd); the third subcluster comprised of S. reuterana (Lorastan) and S. reuterana (Tehran); the fourth subcluster comprised of S. sclarea (Qazvin) and S. sclarea (Ardebil) and the fifth subcluster comprised of S. sclarea (Guilan), S. aethiopis (Ardebil), S. aethiopis (Mazandaran) and S. aethiopis (Guilan), in which S. aethiopis (Guilan) and S. aethiopis (Mazandaran) appeared to be closer to each other. Clusters 4, 5, 6 only included S. spinosa (Qazvin), S. virgata (Qazvin) and S. virgata (Mazandaran), respectively. Cluster 7 included S. officinalis (Isfahan) and S. officinalis (Hamedan) and Cluster 8 included S. verticillata (Qazvin) and S. verticillata (Tehran).
Figure 2. Dendrogram of Salvia ecotypes/species based on CoRAP data using the neighbour-joining (NJ) method and their corresponding structure (K = 2) analysis.
The clustering pattern of the Salvia species/ecotypes based on the combination of TRAP + CoRAP data is depicted in . The combined analysis produced an informative tree in terms of good correspondence between genetic distance and different Salvia species/ecotypes to that produced using either TRAP or CoRAP markers alone. The Nei’s genetic distance coefficients among the 25 Salvia species/ecotypes varied from 0.22 to 0.58 () with the lowest being between S. officinalis and S. virgate (0.22) and the highest being between S. aethiopis and S. verticillata (0.58). The results of the species/ecotypes clustering based on combined data (CoRAP + TRAP) at an average cut-off value of 0.35 clustered the 25 Salvia species/ecotypes into five major groups (). Cluster 1 included S. eremophila (Yazd) and S. eremophila (Kerman); Cluster 2 included S. officinalis (Isfahan) and S. officinalis (Hamedan); Cluster 3 included S. virgata (Qazvin), S. virgate (Mazandaran) and S. virgata (Isfahan); Cluster 4 was divided into 6 subclusters. The first subcluster comprised of S. syriaca (Ilam), S. reuterana (Tehran) and S. reuterana (Lorastan); the second subcluster comprised of S. spinosa (Qazvin); the third subcluster comprised of S. macrosiphon (Bushehr), S. macrosiphon (Fars) and S. macrosiphon (Yazd); the fourth subcluster comprised of S. sclarea (Qazvin), S. sclarea (Ardebil) and S. sclarea (Guilan); the fifth subcluster comprised of S. aethiopis (Ardebil), S. aethiopis (Mazandaran) and S. aethiopis (Guilan) and the sixth subcluster comprised of S. nemorosa (Ardebil), S. nemorosa (Isfahan) and S. nemorosa (Qazvin). Cluster 5 included S. verticillata (Qazvin) and S. verticillata (Tehran).
Figure 3. Dendrogram of Salvia ecotypes/species based on TRAP + CoRAP combined data using the neighbour-joining (NJ) method and their corresponding structure (K = 7) analysis.
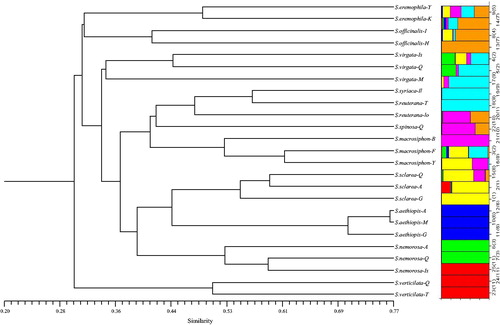
Table 7. Pairwise species matrix of Nei’s genetic distance using a combination of TRAP + CoRAP data.
Population structure analysis was performed with a predefined number of subpopulations (K) ranging from 2 to 7. A Bayesian clustering method was used to assign ecotypes to two groups selected based on the DeltaK method. On the basis of our TRAP data, 11 and 14 ecotypes were included in population group I (green bars) and group II (red bars), respectively (). But based on the CoRAP data, 22 and three ecotypes were included in population group I (green bars) and group II (red bars), respectively (). When K was increased from two to seven, there was good alignment of the clustering dendrogram with the population–structural analysis based on CoRAP + TRAP combination data (), in which the species/ecotypes were separated into seven major groups (of 4, 5, 3, 5, 3, 2 and 3 ecotypes).
In this study, the selected TRAP and CoRAP markers discriminated all 25 ecotypes/species from each other and the data analysis produced an informative dendogram and differentiated population structure diagram. The highly similar and also the most divergent populations among the studied Salvia species indicated that there is sufficient amount of genetic variability among the Iranian Salvia species. Based on the clustering, it could be expected that the species located in a common group may have closer genetic relationships. Nearby, populations of genus Salvia pollinated by bees may share many alleles due to gene flow, leading to genetic similarity of such species. As suggested by Erbano et al. [Citation49], it is conceivable that the outcrossing strategy previously recorded for Salvia [Citation51] is responsible for the higher observed diversity within populations. Javan et al. [Citation52] illustrated S. hydrangea and S. nemorosa as the most divergent species and good candidates for breeding programmes. In the present study, S. verticillata, S. eremophila and S. officinalis can be considered as divergent species based on TRAPs + CoRAPs data clustering. Despite the increasing of human pressure on natural pastures in Iran, the Salvia species used in our study had high levels of genetic variability using TRAP and CoRAP markers. Our results are in accordance with previous reports of high genetic diversity based on different molecular markers such as RAPDs [Citation40,Citation52], ISSRs [Citation39,Citation40,Citation46,Citation52,Citation53], SCoTs [Citation46], AFLPs [Citation54], SRAPs [Citation53] and CoRAPs [Citation10]. This result supports the suggestion that some Salvia species are relatively resilient and provides a good opportunity to collect and conserve their diversity [Citation49]. Such actions would reduce the loss of diversity and genetic vulnerability-erosion found in cultivated species, which typically have lower diversity.
Conclusions
Our study indicated that both TRAPs and CoRAPs could detect high polymorphism among Salvia genotypes and also revealed the existence of more genetic variability in Iranian Salvia species. The average genetic distance derived from TRAPs (0.46) showed higher genetic differences compared with the average genetic distance based on CoRAP markers (0.37). On the other hand, it seems that TRAP markers were effective and reliable for assessment of the degree of genetic variation as well as differentiation of Salvia at inter- and intra-species level. However, our results demonstrate that both TRAP and CoRAP markers are useful for Salvia germplasm fingerprinting, and thus improving germplasm management and promoting germplasm utilization.
Acknowledgements
The authors thank the Genomics Laboratory management who provided insight and expertise that greatly assisted this research.
Disclosure statement
No potential conflict of interest was reported by the authors.
References
- Harley RM, Atkins S, Budantsev AL. Labiatae. In: Kadereit JW, Kubitzki K, Editors. Flowering plants. Dicotyledons. Berlin (Germany): Springer-Verlag; 2004. p. 167–236. (The families and genera of vascular plants; vol. 7).
- Baricevic D, Sosa S, Della Loggia R, et al. Topical antiinflammatory activity of Salvia officinalis L. leaves: the relevance of ursolic acid. J Ethnoph. 2001;75:125–132.
- Cheng TO. Cardiovascular effects of Danshen. Int J Cardiol. 2007;121:9–22.
- Hosseinzadeh H, Haddadkhodaparast MH, Arash AR. Antinociceptive, antiinflammatory and acute toxicity effects of Salvia leriifolia Benth. Seed extract in mice and rats. Phytother Res. 2003;17:422–425.
- Mayer B, Baggio CH, Freitas CS, et al. Gastroprotective constituents of Salvia officinalis L. Fitoterapia. 2009;80:421–426.
- Fan HY, Fu FH, Yang MY, et al. Antiplatelet and antithrombotic activities of salvianolic acid. Thromb Res. 2010;126:17–22.
- Veitch NC, Smith M, Barnes J, et al. Herbal Medicines, 4th ed. Pharmaceutical Press: London; 2013.
- Gebhardt C, Ballvora A, Walkemeier B, et al. Assessing genetic potential in germplasm collections of crop plants by marker-trait association: a case study for potatoes with quantitative variation of resistance to late blight and maturity type. Mol Breed. 2004;13:93–102.
- Hu J, Vick BA. Target region amplification polymorphism: a novel marker technique for plant genotyping. Plant Mol Biol Rep. 2003;21:289–294.
- Wang Q, Zhang B, Lu Q. Conserved region amplification polymorphism (CoRAP), a novel marker technique for plant genotyping in Salvia miltiorrhiza. Plant Mol Biol Rep. 2009;27:139–143.
- Collard BCY, Mackill DJ. Conserved DNA-derived polymorphism (CDDP): a simple and novel method for generating DNA markers in plants. Plant Mol Biol Rep. 2009;27:558–562.
- Li G, Quiros CF. Sequence-related amplified polymorphism (SRAP), a new marker system based on a simple PCR reaction: its application to mapping and gene tagging in Brassica. Theor Appl Genet. 2001;103:455–461.
- Hu J, Chen J, Berville A, et al. Defining sunflower linkage group ends with the conserved telomere sequence-derived TRAP markers. In: Plant and Animal Genome XIII Conference. San Diego, CA, USA; 2005 Jan 15–19.
- Barakat MN, Al-Doss AA, Elshafei AA, et al. Assessment of genetic diversity among wheat doubled haploid plants using TRAP markers and morpho-agronomic traits. AJCS. 2013;7:104–111.
- Li L, Fan XZ, Liu W, et al. Comparative analysis on the diversity of Auricularia auricula-judae by physiological characteristics, somatic incompatibility and TRAP fingerprinting. World J Microbiol Biotechnol. 2011;27:2081–2093.
- Qiao L, Liu H, Sun J, et al. Application of target region amplification polymorphism (TRAP) technique to Porphyra fingerprinting. Phycologia. 2007;46:450–455.
- Liu Z, Anderson JA, Hu J, et al. A wheat inter-varietal linkage map based on microsatellite and target region amplified polymorphism markers and its utility for detecting quantitative trait loci. Theor Appl Genet. 2005;111:782–794.
- Chen J, Hu J, Vick BA, et al. Molecular mapping of a nuclear male-sterility gene in sunflower (Helianthus annuus L.) using TRAP and SSR markers. Theor Appl Genet. 2006;113:122–127.,
- Li GQ, Li ZF, Yang WY, et al. Molecular mapping of stripe rust resistance gene YrCH42 in Chinese wheat cultivar Chuanmai 42 and its allelism with Yr24 and Yr26. Theor Appl Genet. 2006;112:1434–1440.
- Chu CG, Xu SS, Friesen TL, et al. Whole genome mapping in a wheat doubled haploid population using SSRs and TRAPs and the identification of QTL for agronomic traits. Mol Breed. 2008;22:251–266.
- Gadaleta A, Mastrangelo M, Russo MA, et al. Development and characterization of EST-derived SSRs from a totipotent cDNA library of durum wheat. Plant Breed. 2010;129:715–717.
- Al-Doss AA, Saleh M, Moustafa KA, et al. Grain yield stability and molecular characterization of durum wheat genotypes under heat stress conditions. Afr J Agric Res. 2010;5:3065–3074.
- Hu J, Seiler GJ, Jan CC, et al. Assessing genetic variability among sixteen perennial Helianthus species using PCR based TRAP markers. In: Proceedings of the 25th Sunflower Research Forum. Fargo,ND; 2003 Jan 16–17.
- Yue B, Cai X, Vick BA, et al. Genetic diversity and relationships among 177 public sunflower inbred lines assessed by TRAP markers. Crop Sci. 2009;49:1242–1249.
- Hu J, Ochoa OE, Truco MJ, et al. Application of the TRAP technique to lettuce (Lactuca sativa L.) genotyping. Euphytica. 2005;144:225–235.
- Miklas PN, Kelly JD, Beebe SE, et al. Common bean breeding for resistance against biotic and abiotic stresses: from classical to MAS breeding. Euphytica. 2006;147:105–131.
- Alwala S, Suman A, Arro JA, et al. Target region amplification polymorphism (TRAP) for assessing genetic diversity in sugarcane germplasm collections. Crop Sci. 2006;46:448–455.
- Hu J, Mou B, Vick BA. Genetic diversity of 38 spinach (Spinacia oleracea L.) germplasm accessions and 10 commercial hybrids assessed by TRAP markers. Genet Resour Crop Evol.. 2007;54:1667–1674.
- Kwon SJ, Hu J, Coyne CJ. Genetic diversity and relationship among faba bean (Vicia faba L.) germplasm entries as revealed by TRAP markers. Plant Genet Resour. 2010;8:204–213.
- Xiao Y, Liu W, Lu YY, et al. Applying target region amplification polymorphism markers for analyzing genetic diversity of Lentinula edodesin China. J Basic Microbiol. 2010;50:475–483.
- Kwon SJ, Smykal P, Hu J, et al. User-friendly markers linked to Fusarium wilt race 1 resistance Fw gene for marker assisted selection in pea. Plant Breed. 2013;132:642–648.
- Rozen S, Skaletsky HJ. Primer 3 on the WWW for general users and for biologist programmers. In: Krawetz S, Misener S, editors. Bioinformatics methods and protocols: Methods in molecular biology. Totowa, NJ: Humana Press. 2000; p. 365–386.
- Powell W, Morgante M, Doyle JJ, et al. Gene pool variation in genus Glycine subgenus Soja revealed by polymorphic nuclear and chloroplast microsatellites. Genetics. 1996;144:793–803.
- Yeh FC, Yang RC, Boyle T. POPGENE 32-version 1.31. Population genetics software; 1999. Available from: https://sites.ualberta.ca/∼fyeh/fyeh/
- Nei M, Li WH. Mathematical model for studying genetic variation in terms of restriction endonucleases. Proc Nat Acad Sci USA. 1979;76: 5269–5273.
- Falush D, Stephens M, Pritchard JK. Inference of population structure using multilocus genotype data: dominant markers and null alleles. Mol Ecol Notes. 2007;7:574–578.
- Hubisz MJ, Falush D, Stephens M, et al. Inferring weak population structure with the assistance of sample group information. Mol Ecol Resour. 2009;9:1322–1332.
- Etminan A, Pour-Aboughadareh A, Mohammadi R, et al. Applicability of start codon targeted (SCoT) and inter-simple sequence repeat (ISSR) markers for genetic diversity analysis in durum wheat genotypes. Biotechnol Biotechnol Equip. 2016;30:1–1081.
- Zhang Y, Li X, Wang Z. Diversity evaluation of Salvia miltiorrhiza using ISSR markers. Biochem Genet. 2013;51:707–721.
- Yousefiazar-Khanian M, Asghari A, Ahmadi J, et al. Genetic diversity of Salvia species assessed by ISSR and RAPD markers. Not Bot Hort Agrobot Cluj.. 2016;44:431–436.
- Sajadi SS, Shiran B, Kharazian N, et al. Genetic diversity of Salvia species from Chaharmahal va Bakhtiari and Isfahan province using AFLP molecular markers. Iranian J Hort Sci. 2010;40:79–88.
- Ude G, Pillay M, Ogundiwin E, et al. Genetic diversity in an African plantain core collection using AFLP and RAPD markers. Theor Appl Genet. 2003;107:248–255.
- Bohn M, Utz HF, Melchinger AE. Genetic similarities among wheat cultivars determined on the basis of RFLPs, AFLPs and SSRs and their use for predicting progeny variance. Crop Sci. 1999;39:228–237.
- Gorji AM, Poczai P, Polgar Z, et al. Efficiency of arbitrarily amplified dominant markers (SCoT, ISSR and RAPD) for diagnostic fingerprinting in tetraploid potato. Am Potato. Am J Pot Res. 2011;88:226–237.
- Rajesh MK, Sabana AA, Rachana KE, et al. Genetic relationship and diversity among coconut (Cocos nucifera L.) accessions revealed through SCoT Analysis. 3 Bitech. 2015;5:999–1006.
- Etminan A, Pour-Aboughadareh A, Nooric A, et al. Genetic relationships and diversity among wild Salvia accessions revealed by ISSR and SCoT markers. Biotechnol Biotechnol Equip. 2018;32:610–617.
- Pour-Aboughadareh A, Ahmadi J, Mehrabi AA, et al. Assessment of genetic diversity among Iranian Triticum germplasm using agro-morphological traits and start codon targeted (SCoT) markers. Cereal Res Commun. 2017;45:574–586.
- Pour-Aboughadareh A, Ahmadi J, Mehrabi AA, et al. Insight into the genetic variability analysis and relationships among some Aegilops and Triticum species, as genome progenitors of bread wheat, using SCoT markers. Plant Biosys. 2018;152:694–703.
- Erbano M, Schuhli GS, Santos EP. Genetic variability and population structure of Salvia lachnostachy: implications for breeding and conservation programs. IJMS. 2015;16:7839–7850.
- Safaei M, Sheidai M, Alijanpoor B, et al. Species delamination and genetic diversity analysis in Salvia with the use of ISSR molecular markers. Acta Bot Croat. 2016;75:45–52.
- Bijlsma R, Ouborg NJ, Treuren R. On genetic erosion and population extinction in plants: A case study in Scabiosa columbaria and Salvia pratensis. Conserv Genet. 1994;68:255–271.
- Javan ZS, Rahmani F, Heidari R. Assessment of genetic variation of genus Salvia by RAPD and ISSR markers. Aust J Crop Sci. 2012;6:1068–1073.
- Song Z, Li X, Wang H, et al. Genetic diversity and population structure of Salvia miltiorrhiza Bge in China revealed by ISSR and SRAP. Genetica. 2010;138:241–249.
- Guo BL, Lin S, Feng YX, et al. Primary research on genetic relationship among main populations of Salvia miltiorrhiza and genuineness of herb. Zhongcaoyao. 2002;33:1113–1116.