
Abstract
Toona ciliata (Meliaceae) is a rare, fast-growing commercial tree species that produces red timber with beautiful grains. It used to be widely distributed in the past, but few natural forests exist in the field now. Here, we tested 12 nuclear microsatellite markers derived from 551 individuals of 29 populations in China, and investigated the genetic diversity and population structure in T. ciliata. Our results revealed 146 alleles obtained from all of the populations studied here, with an average polymorphic information content of 0.723. The populations could be divided into two major genetic lineages using STRUTURE analysis: 14 and 15 populations from different provinces clustered in Western and Eastern genetic lineages, respectively. The genetic differentiation among the two genetic lineages was 28%. The genetic diversity of the Western lineage was higher than that of the Eastern lineage. Moreover, a Mantel test of the relationship between genetic and geographic distances revealed significantly positive correlations both among all 29 populations and within the Eastern genetic lineage, whereas there was no significant correlation in the Western genetic lineage. Therefore, in the conservation strategy of T. ciliatare sources, the two genetic lineages should be treated independently. To the best of our knowledge, these data are the first detailed characterization of the genetic structure and diversity of T. ciliata populations using nuclear microsatellite markers. The obtained results lay the foundation for preservation of the T. ciliata germplasm resources and support further artificial breeding efforts.
Introduction
Toona ciliata (Meliaceae) is a tree species that grows throughout India, Indonesia, the Indochina peninsula, Australia, the Pacific Islands and Southern China. T. ciliata has long been known as ‘Chinese mahogany’, and it is very popular because of its red heartwood colour, good timber quality and rapid growth [Citation1,Citation2]. Since its introduction and cultivation in Hawaii from Australia, T. ciliata has mostly been used in cabinetry and has broad prospects for economic use [Citation3,Citation4]. In northern Argentina, T. ciliata is considered a tree species suitable for production of timber with high quality and high economic value [Citation5], while in India, T. ciliata is often used as a roadside tree. In recent years, a variety of chemical substances with medicinal values have been extracted from T. ciliata, including compounds such as cedrelone and dysobinin, which have shown significant cytotoxicity to cancer cells [Citation6–8]. Additionally, ethyl acetate extracts from T. ciliata have anti-cancer effects on human breast cancer cell lines [Citation9]. T. ciliata is widely distributed in China, but its distribution is scattered with very few natural forests. In addition to problems such as serious inbreeding depression and damage from human activities, existing natural T. ciliata resources have been dramatically decreasing and are today nearly extinct. The status of natural T. ciliata resources is worrisome, and it is therefore one of the national level II priority protected wild plants in China.
Studies on the genetic structure and genetic diversity of endangered species have great significance for improving the current understanding of population dynamics and the mechanisms of adaptation and evolution; exploring the factors affecting endangered species; guiding ex-situ conservation, introduction, and cultivation efforts; and evaluating the conservation value of species [Citation10–13]. T. ciliata is an endangered species with broad prospects for development, which makes research into its genetic diversity and genetic structure highly valuable. However, there are many limitations in the study of the genetic diversity of forestry species using the morphological, physiological and biochemical methods currently in use [Citation14].
In recent years, a series of studies have addressed the genetic diversity of T. ciliata by some molecular marker techniques. For example, Liu et al. [Citation15] developed eight simple sequence repeat (SSR) primers to study the genetic diversity of nine T. ciliata var. pubescens populations; however, the study material was limited, and the study was therefore incomprehensive. Li et al. [Citation16] used sequence-related amplified polymorphism markers to systematically study 29 T. ciliata populations in China. In this work, 12 pairs of highly polymorphic T. ciliata SSR primers were selected to study the genetic diversity at a molecular level based on 551 germplasm resources from 29 T. ciliata populations distributed among 11 provinces in China. These samples represent the majority of the T. ciliata resources in China, and therefore the study results fully reflect the genetic diversity and genetic structure of the T. ciliata germplasm resources in China. This study will provide insight into the factors affecting the endangered status of T. ciliata and also provide a basis for the development of effective preservation management strategies and for further genetic improvement of the species.
Materials and methods
Experimental materials
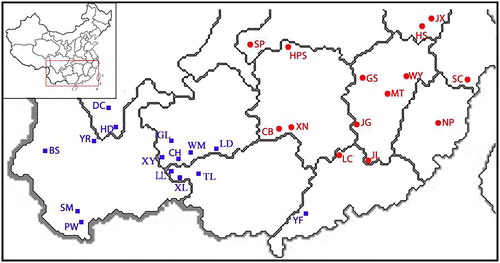
Field investigations were conducted in 2013 on 29 T. ciliata populations distributed among 11 provinces including Yunnan, Sichuan, Guizhou, Guangxi, Guangdong, Hunan, Hubei, Jiangxi, Zhejiang, Fujian and Anhui ( and Supplemental Table S1). Leaf samples were collected from the upper part of individual T. ciliata trees that were at least 50 m away from adjacent T. ciliata trees (when possible). A total of 551 individual samples were collected. The leaves were dried with silica gel and brought back to the lab, where they were stored at −80 °C.
Figure 1. Geographic distribution of the sampled T. ciliata populations in the present study. Flowering period from March to April (■) or from May to June (●).
Genomic DNA extraction and SSR amplification
E.Z.N.ATM HP Plant DNA Kit (Omega, Shanghai, China) was used for T. ciliata genomic DNA extraction according to the manufacturer’s instructions. The 12 pairs of primers for polymorphic SSR markers were selected from previously published Meliaceae SSR primers [Citation17] based on the unique and clear amplification band pattern (Supplemental Table S2).
The SSR-PCR system based on fluorescein-12-dUTP was used in this study. The 10-mL reaction volume included 1.0 mL of 10Чbuffer, 0.1 mL of Taq polymerase (5 U/mL), 0.8 мL of 25 mmol/L MgCl2, 0.025 mL of 200 mmol/L deoxyribonucleoside triphosphates (dNTPs), 0.01 mL of fluorescein-12-dUTP (1 nmol/mL), 0.8 mL of primers (10 mmol/L), 45 ng of DNA template, and ddH2O to bring the total volume up to 10 mL. A MyCycler thermal cycler (Bio-Rad, Hercules, CA, USA) was used for the PCR amplification. The touchdown PCR amplification program was as follows: 94 °C pre-denaturation for 4 min, then 19 cycles of 94 °C denaturation for 0.5 min, 66–68 °C annealing for 0.5 min (with an 0.5 °C decrement per cycle) and 72 °C extension for 0.5 min, followed by 26 cycles of 94 °C denaturation for 0.5 min, 56–58 °C annealing for 0.5 min and 72 °C extension for 0.5 min, and a final 72 °C extension for 10 min. After the amplification, 2 mL of the PCR product was added to 7.8 mL of hyperpure formamide and 0.2 mL of GS500 LIZ internal standard, mixed, denatured at 95 °C for 5 min, and then immediately cooled to 4 °C. The denatured PCR products were genotyped using the ABI 3130xlGenetic Analyzer (Applied Biosystems, Foster City, CA, USA), and Gene Mapper 4.0 software (Applied Biosystems) was used for data analysis.
Data analysis
Capillary electrophoresis with fluorescently labelled SSR markers was used to determine the molecular weight of the target band. Convert 1.31 software [Citation18] was used for the molecular weight data format conversion. MICRO-CHECKER 2.2.3 was used to aid the identification of genotyping errors due to null alleles and large allele dropout. GenAlex 6.501 [Citation19] software was used to calculate the number of observed alleles (Na), effective number of alleles (Ne), observed heterozygosity (Ho), expected heterozygosity (He), total population-level inbreeding coefficient (FIT), within-population inbreeding coefficient (FIS) and coefficient of genetic differentiation (FST) as well as to conduct an analysis of molecular variance (AMOVA). Following the method proposed by Rousset [Citation20], the matrix of T. ciliata genetic distances between populations [(FST/(1−FST)] and the matrix of the natural logarithm of the corresponding geographic distance were assessed using a Mantel test to verify their correlations. Power Marker v3.25 software was used to calculate the polymorphism information content (PIC) of each SSR locus. Hardy–Weinberg equilibrium (HWE) was assessed using Popgene32 software [Citation21]. STRUCTURE 2.3.2 software was used to analyze the overall population genetic structure by using both a mixed model and an allele frequency correlation model [Citation22]. STRUCTRE is based on a Bayesian algorithm for calculating the posterior probability of each individual being derived from different genetic lineages. The results are expressed as probabilities, in which individuals with different probabilities belong to different groups, indicating that the individual might have some relationship within these groups. Using this principle, whether the groups are mixed, as well as the degree of mixing can be determined [Citation23]; thus, the optimum number of genetic lineages (K values) can be determined. The method described by Evanno [Citation24] was used in this study to determine the appropriate K value by maximizing the value of ΔK. The specific parameters used are as follows: K = 1–29, number of interactions = 10, burn-in iterations = 100,000 and total MCMC iterations = 1,000,000.
Results and discussion
Genetic diversity of T. ciliata
A total of 146 alleles (Na) were detected in the 29 populations, with an average of 12.17 alleles per locus (Supplemental Table S2). The number of alleles was highest at locus Tc10 with 24 alleles revealed, whereas the number of alleles at loci Tc01 and Tc12 was the lowest. The effective number of alleles (Ne) varied from 1.584 at locus Tc11 to 4.323 at locus TC03, with an average of 2.581 per locus. Among the 12 loci, the maximum value for PIC was 0.859 at locus Tc03, whereas the minimum PIC value was 0.614 at locus Tc08. The average observed heterozygosity (Ho) and the average expected heterozygosity (He) were 0.666 and 0.514, respectively, with three loci (TC26, TC29, andTC97) exhibiting Ho values lower than the corresponding He values. Loci Tc06 and Tc11 showed very significant deviations from the Hardy–Weinberg equilibrium.
When Nm > 1, gene flow can effectively inhibit the effect of genetic drift in divergence and thus prevent population differentiation. The population genetic gene flow rate among the general T. ciliata populations was only 0.625 in the present study. This value is similar to the Nm value reported in a previous study of 9 T. ciliata var. pubescens populations (Nm = 0.610) [Citation25], but it is far below the average gene flow rate of outcrossing perennial plants with seeds that are not wind dispersed (Nm = 1.138), indicating that the gene flow among the T. ciliata populations included in this study is not strong. Accordingly, genetic drift plays a role in the differentiation of T. ciliata populations. T. ciliata has thinly winged seeds, but factors such as gravity limit their dispersal distance. In addition, its bisexual flowers require insects for cross-pollination. Because the distance over which pollen can be spread is also restricted by the range of insects, there are significantly positive correlations between genetic and geographic distances. Both the seed characteristics and reproductive biology of T. ciliata limit the gene flow over longer geographic distances, making these factors the most influential causes of genetic differentiation among populations. Indeed, gene flow and breeding systems are the most important factors affecting population differentiation [Citation26].
The numbers of alleles and genetic diversity values from the T. ciliata sources in China were relatively low (Supplemental Table S1). The number of alleles (Na) and the effective number of alleles (Ne) among the populations were in the ranges of 2.250–5.833 and 1.951–3.376, and the average numbers were 3.917 and 2.581, respectively. The number of alleles (Na) was highest in population Tianlin from Guangxi province and lowest in population Xianju from Zhejiang province with a value of 5.833 and 2.417, respectively. The effective number of alleles (Ne) was highest in population Simao from Yunnan province and lowest in population Huangshan Mountain from Anhui province with a value of 3.376 and 1.951, respectively. The average Ho value of the 29 T. ciliata populations was 0.666, population Tianlin in Guangxi province exhibiting the highest Ho value (0.746), while population Enshi in Hubei province, the lowest one (0.543). Heterozygosity is one of the most useful parameters for measuring population genetic variation [Citation27], and the value of the expected heterozygosity reflects the degree of population genetic diversity [Citation28]. The average He of the T. ciliata populations was 0.514; population Luodian in Guizhou province showed the highest He value (0.603), whereas population Suichang in Zhejiang province exhibited the lowest one (0.423). Compared to the He values of T. ciliata var. pubescens [Citation25] (He = 0.610), Swietenia macrophylla (He = 0.657 [Citation29], He = 0.851 [Citation30]), Carapa guianensis (He = 0.667) [Citation31] and Melia volkensii (He = 0.715) [Citation32] as well as the He values (also derived from SSR genotyping) averaged across perennial plants (He = 0.68), outcrossing plants (He = 0.65) and plants with wind-dispersed seeds (He = 0.61) [Citation33], the genetic diversity of the natural T. ciliata populations is relatively low. Accordingly, more effort needs to be put into the conservation of T. ciliata germplasm resources. The He value of the Western group was 0.554, which is higher than the average He value of the Eastern group (He = 0.477), indicating that the genetic diversity of the Western group is higher than that of the Eastern group.
Genetic structure analysis of T. ciliata
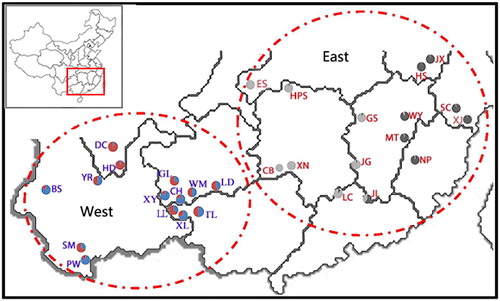
During the investigation, we observed that the flowering and fruiting periods of different T. ciliata populations exhibited broad variation (). After testing the loci for deviations from the Hardy–Weinberg equilibrium, the two significantly deviant loci, Tc06 and Tc11, were excluded. We used the other 10 loci that conformed to the expected Hardy–Weinberg equilibrium to analyze the genetic structure of the 29 T. ciliata populations in China by using the STRUCTURE software package. When K = 2, ΔK reached its maximum value; in other words, the 29 T. ciliata populations were most clearly divided into two distinct genetic lineages. As shown in , the red gene pool dominated genetic lineage I, which included a total of 15 populations distributed in Hubei, Hunan, Zhejiang, Jiangxi, Fujian, Anhui and Guangdong provinces (). This grouping coincided with an Eastern distribution, which is also characterized by its distinct flowering periods, and could be called the Eastern genetic lineage. The “green” gene pool dominated genetic lineage II, which included a total of 14 populations distributed in Yunnan, Sichuan, Guangxi and Guizhou provinces (). This grouping coincided with a Western distribution, which could be named the Western genetic lineage ().
Figure 2. Clustering results of T. ciliata populations using STRUCTURE. Clustering analysis for: K = 2 with 29 populations (a), the Eastern genetic lineage (b) and the Western genetic lineage (c).
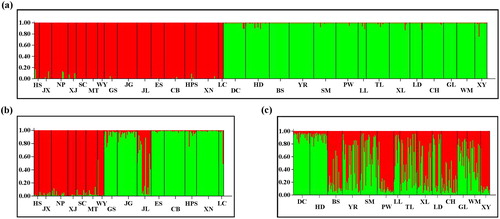
Figure 3. Comparison of genetic structure distribution rates in T. ciliata. Note: A total of 14 populations distributed in the Eastern genetic lineage, and a total of 15 populations distributed in the Western genetic lineage. The pie chart at each location represents the proportions of individuals belonging to the corresponding subgroups in the Eastern or Western genetic lineage.
Additionally, the individuals within the T. ciliata resource gene pool showed clear origin, with no obvious admixture. Molecular variance analysis revealed 28% differentiation between the two main groups (). AMOVA analyses indicated that the two groups are highly differentiated. This division is also consistent with the distinct timing of the flowering periods of the Eastern and Western groups. The flowering periods of the T. ciliata populations in Guizhou, Yunnan, Sichuan and Guangxi were around March and April, whereas the fruiting periods occurred around May and June. In contrast, the flowering periods of the T. ciliata populations in Hunan, Hubei, Zhejiang, Anhui, Jiangxi, Fujian and Guangdong were around May and June, with fruiting periods in September and October. Furthermore, the He value of the Western group was 0.554 (), which was higher than that of the Eastern group (0.477). The gene flow rate (Nm) among all T. ciliata populations was 0.652, whereas those within the Eastern and Western groups were 1.596 and 8.205, respectively. The low admixture between the two genetic lineages is consistent with the relatively low overall gene flow in the T. ciliata populations.
Table 1. AMOVA analysis of the two T. ciliata genetic lineages.
Table 2. Genetic diversity comparison of the two T. ciliata genetic lineages.
The genetic structure analysis was conducted on the 15 populations in the Eastern genetic lineage and the 14 populations in the Western genetic lineage separately (). Substructure was revealed in both the Eastern and the Western group. The Eastern group could be divided into two subgroups: the 7 populations distributed along the Wuyi Mountain, including HS, JX, NP, XJ, SC, MT and WY, were in one subgroup, whereas the other seven populations, including GS, JG, ES, CB, HPS, XN and LC, formed the other subgroup. The individuals of population JL distributed between the two subgroups and showed genetic admixture of the two subgroups.
The Western T. ciliata group was also subdivided into two subgroups, and exhibited a higher degree of genetic admixture in most populations, except for populations HD and DC from Sichuan province, which consisted of a uniform gene pool (). The populations HD and DC in Sichuan province are located on the border between the Yunnan–Guizhou plateau and Sichuan basin. Besides these two populations, all other populations in the Western group are located on the Yunnan–Guizhou plateau. Our results clearly revealed genetic differentiation of populations HD and DC from the other populations in the Western group. Although the terrain is complex, there are insufficient barriers to block the gene flow among these populations, and the Nm value was 8.205 accordingly, which is sufficient to effectively prevent the impact of genetic drift on the population differentiation.
There was no significant correlation between genetic distance and geographic distance, indicating that the population distribution was relatively random with the geographical distance having no impact on the differentiation among the populations of the Western group. In contrast, among the populations in the Eastern group, the differentiation was relatively high, with most genetic variation distributed among the populations. The populations of the Eastern group were also divided into two subgroups. The first subgroup included the populations distributed in the west of the Wuyi Mountains. The second subgroup included the populations distributed along the Wuyi Mountains and extended to the east, including the populations in Jiangxi, Anhui, Fujian and Zhejiang provinces. These populations were scattered within forests, exhibiting serious habitat fragmentation with small population size, and thus a higher inbreeding index. The gene flow was lower than that observed among the populations in the Western group. Accordingly, there was a significant positive correlation between the geographical and genetic distances, indicating that geographical distance is one of the main factors contributing to genetic differentiation of the populations of the Eastern group.
Our results revealed a pattern of genetic divergence similar to that shown in Castanopsis fargesii [Citation34]. The authors proposed that the rapid and dramatic uplift of the western Yunnan–Guizhou plateau and the eastern Wuyi Mountains had a huge impact on the molecular differentiation of the subtropical broad-leaved tree species in China.
In our study, the genetic differentiation of the T. ciliata populations between the Eastern and Western groups was also separated by the east edge of the eastern Yunnan–Guizhou plateau. The dramatic uplift of the Yunnan–Guizhou plateau could be a main cause of the strong geographic isolation between the eastern and the western T. ciliata populations. After the uplift, because of differences in some climate variables, such as temperature, rainfall and light conditions, differences in the timing of the flowering periods between the two groups began to increase; eventually the flowering periods became so divergent that they no longer overlapped with each other, leading to reproductive isolation and further increasing the genetic differentiation between the two groups. The genetic structure analysis of the Eastern group showed clear population differentiation along the Wuyi Mountains, indicating that the uplift of the Wuyi Mountains has led to the differentiation of the T. ciliata populations as observed in C. fargesii.
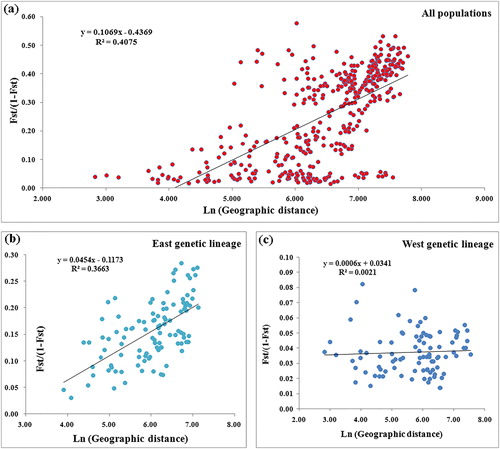
The relationship between genetic structure and geographic distance
The relationship between genetic structure and geographic distance was assessed among the 29 T. ciliata populations and the Eastern and the Western groups separately (). There was a significant positive correlation between the genetic distance and the geographic distance of the 29 T. ciliata populations (). The Eastern group also exhibited a positive correlation between genetic distance and geographic distance (). In brief, the genetic differentiation of T. ciliata is more in line with the geographical distance model [Citation35]. As the geographical distance increased, the genetic distance among the populations also increased. The Western group showed no correlation between genetic distance and geographic distance (), namely, the T. ciliata populations in the Western group showed a random distribution pattern. There were substantial differences in the population genetic structures and the levels of diversity between the Eastern and Western groups; therefore, in the development of the T. ciliata germplasm resource conservation strategy and T. ciliata selection and breeding, the two genetic lineages should be treated independently. The differentiation among the populations of the Western group was low, with genetic variation mainly distributed among individuals. Therefore, in the process of breeding, priority should be given to the selection of individuals with excellent characteristic traits. Additionally, the conservation strategy should focus on populations with high genetic diversity, such as the population in Luodian of Guizhou province, while strengthening the conservation of populations with unique genotypes, such as the HD and DC populations in Sichuan province. Similarly, for the populations in the Eastern group, the germplasm resource collection efforts should be strengthened, with a strong focus on the JL germplasm resource, which showed a high degree of gene admixture.
Figure 4. Correlation between geographic distance and genetic distance of the T. ciliata populations. Scatter diagram and correlation analysis for: all 29 populations (a), the Eastern genetic lineage (b) and the Western genetic lineage (c). Note: P = 0.001 for all correlations.
Conclusions
The present study comprehensively analyzed the genetic diversity and population structure of Toona ciliata coupled with SSR markers. Twelve nuclear microsatellite markers derived from 551 individuals of 29 populations in China were investigated. Our results showed that 146 alleles were obtained from all of the populations, and the average PIC was 0.723. Furthermore, these populations could be divided into two major genetic lineages, 14 and 15 populations from different provinces were grouped in a Western and an Eastern genetic lineage, respectively. The genetic diversity of the Western lineage was higher than that of the Eastern lineage. Significantly positive correlations were detected both among all 29 populations and within the Eastern genetic lineage, whereas there was no significant correlation in the Western genetic lineage. Therefore, in the strategy for the conservation of T. ciliatare sources, the two genetic lineages should be treated independently. To the best of our knowledge, these data are the first detailed characterization of the genetic structure and diversity of T. ciliata populations using nuclear microsatellite markers. We expect that the results obtained in this study could pave the way for protecting T. ciliata germplasm resources and trigger further artificial breeding efforts.
Author contributions
Xiaomei Deng and Xiaoyang Chen formulated and designed the experiments; Xin Zhan, Pei Li, Yanwen Deng, Wenkai Hui and Xianhai Zhao performed the experiments; Xin Zhan and Wenkai Hui analyzed the data and wrote the paper; Siming Gan and Ye Sun revised and proofread the paper. All authors read and approved the final manuscript.
Disclosure Statement
The authors declare that they have no competing interests.
Additional information
Funding
References
- Dordel J, Seely B, Simard SW. Relationships between simulated water stress and mortality and growth rates in underplanted Toona ciliata Roem. in subtropical Argentinean plantations. Ecol Model. 2011;222(17):3226–3235.
- Dordel J, Simard SW, Bauhus J, et al. Trade-offs among establishment success, stem morphology and productivity of underplanted Toona ciliata: effects of nurse-species and thinning density. Forest Ecol Manag. 2010;259(9):1846–1855.
- Ares A, Fownes JH. Productivity, nutrient and water-use efficient of Eucalyptus saligna and Toona ciliata in Hawaii. Forest Ecol Manag. 2000;139:227–236.
- Haines HA, Olley JM, Kemp J, et al. Progress in Australian dendroclimatology: identifying growth limiting factors in four climate zones. Sci Total Environ. 2016;572:412–421.
- Nisa S, Yamin B, Muhammad Z, et al. Anticancer investigations on Carissa opaca and Toona ciliata extracts against human breast carcinoma cell line. Pak J Pharm Sci. 2013;26(5):1009–1012.
- Jiang SJ, Liu JQ, Xia JJ, et al. Five new tetranortriterpenoids from the seeds of Toona ciliata. Helv Chim Acta. 2012;95(2):301–307.
- Liu J, Wang CF, Li Y, et al. Limonoids from the leaves of Toona ciliata var. yunnanensis. Phytochemistry. 2012;76:141–149.
- Liu J, Yang SP, Su ZS, et al. Limonoids from the stems of Toonaciliata var. henryi (Meliaceae). Phytochemistry. 2011;72(17):2189–2196.
- Liu Y, Cheng XR, Qin JJ, et al. Chemical constituents of Toona ciliata var. pubescens. Chin Nat Med. 2011;9(2):115–119.
- Petit RMJ, Mousadik AE, Pons O. Identifying populations for conservation on the basis of genetic markers. Conserv Biol. 2008;12:844–855.
- Grassi F, Cazzaniga E, Minuto L, et al. Evaluation of biodiversity and conservation strategies in Pancratium maritimum L. for the Northern Tyrrhenian Sea. Biodivers Conserv. 2005;14(9):2159–2169.
- Wang L, Guoa J, Zhao G. Genetic diversity of the endangered and endemic species Psathyrostachys huashanica natural populations using simple sequence repeats (SSRs) markers. Biochem Syst Ecol. 2006;34:310–318.
- Hassanien H, Gilbey J. Genetic diversity and differentiation of Nile tilapia (Oreochromis niloticus) revealed by DNA microsatellites. Aquac Res. 2005;36(14):1450–1457.
- Khadivi A, Esmaeili A, Mardani N. Genetic diversity of cultivated pistachio as revealed by microsatellite molecular markers. Biotechnol Biotechnol Equip. 2018;32(3):602–609.
- Jun L, Chen YT, Jiang JM, et al. Study on population genetic structure in Toona ciliata var. pubescens with SSR. Forest Res. 2009;22(1):37–41.
- Li P, Zhan X, Que Q, et al. Genetic diversity and population structure of Toona ciliata roem. based on sequence-related amplified polymorphism (SRAP) markers. Forests. 2015;6(4):1094–1106.
- Zhan X, Lu H, Zhao S, et al. Establishment and primer screening of SSR-PCR reaction system for Toona ciliata. Forest Res. 2016;29(4):565–570.
- Glaubitz JC. A user-friendly program to reformat diploid genotypic data for commonly used population genetic software packages. Mol Ecol Notes. 2004;4(2):309–310.
- Peakall R, Smouse PE. GENALEX 6: genetic analysis in Excel. Population genetic software for teaching and research. Mol Ecol Notes. 2006;6(1):288–295.
- Rousset F. Genetic differentiation and estimation of gene flow from F-statistics under isolation by distance. Genetics. 1997;145:1219–1228.
- Sun Y, Yu X, Tong J. Polymorphisms in myostatin gene and associations with growth traits in the common carp (Cyprinus carpio L.). Int J Mol Sci. 2012;13(11):14956–14961.
- Pritchard J, Stephens M, Donnelly P. Inference of population structure using multilocus genotype data. Genetics. 2000;2(155):945–959.
- Heuertz M, Hausman JF, Hardy J, et al. Nuclear microsatellites reveal contrasting patterns of genetic structure between western and Southeastern European populations of the common ash (Fraxinus excelsior L.). Evolution. 2004;58(5):976–988.
- Evanno G, Regnaut S, Goudet J. Detecting the number of clusters of individuals using the software STRUCTURE: a simulation study. Mol Ecol. 2005;14:2611–2620.
- Liu J, Jiang JM, Chen YT. Genetic diversity of central and peripheral populations of Toona ciliata var. pubescens, an endangered tree species endemic to China. Genet Mol Res. 2014;13(2):4579–4590.
- Jatan KS, Manoj KR, Shekhawat NS, et al. Start codon targeted (SCoT) polymorphism for evaluation of genetic diversity of wild population of Maytenus emarginata. Ind Crop Prod. 2018;122(15):202–208.
- Lu W, Arnold RJ, Zhang L, et al. Genetic diversity and structure through three cycles of a Eucalyptus urophylla S.T.Blake breeding program. Forests. 2018;9:372. DOI: 10.3390/f9070372
- Xue L, Liu Q, Hu H, et al. The southwestern origin and eastward dispersal of pear (Pyrus pyrifolia) in East Asia revealed by comprehensive genetic structure analysis with SSR markers. Tree Genet Genomes. 2018;14:48. DOI: 10.1007/s11295-018-1255-z
- Novick RR, Dick C, Lemes MR, et al. Genetic structure of mesoamerican populations of big-leafmahogany (Swietenia macrophylla) inferred from microsatellite analysis. Mol Ecol. 2003;12(1):2885–2893.
- Lemes M, Brondani R, Grattapaglia D. Multiplexed systems of microsatellite markers for genetic analysis of mahogany, Swietenia macrophylla King (Meliaceae), a threatened neotropical timber species. J Hered. 2002;93(4):287–291.
- Dayanandan S, Dole J, Bawa K. Population structure delineated with microsatellite markers in fragmented populations of atropicaltree, Carapa guianensis (Meliaceae). Mol Ecol. 1999;8(10):1585–1592.
- Hanaoka S, Muturi GM, Watanabe A. Isolation and characterization of microsatellite markers in Melia volkensii Gurke. Conserv Genet Resour. 2012;4(2):395–398.
- Nybom H. Comparison of different nuclear DNA markers for estimating intraspecific genetic diversity in plants. Mol Ecol. 2004;13(5):1143–1155.
- Li C, Sun Y, Huang HW, et al. Footprints of divergent selection in natural populations of Castanopsis fargesii (Fagaceae). Heredity. 2014;113:533–541.
- Bai WN, Liao WJ, Zhang DY. Nuclear and chloroplast DNA phylogeography reveal two refuge areas with asymmetrical gene flow in a temperate walnut tree from East Asia. New Phytologist. 2010;188:892–901.