
 ?Mathematical formulae have been encoded as MathML and are displayed in this HTML version using MathJax in order to improve their display. Uncheck the box to turn MathJax off. This feature requires Javascript. Click on a formula to zoom.
Abstract
The aim of this study was to explore and compare the visual analyser (VA) function in patients with type 1 and type 2 diabetes mellitus (DM) in different stages of diabetic retinopathy (DR). A group of 185 people was studied. The patients with DM were 138. They were divided into two main groups: patients without DR and patients with DR. The first group consisted of two subgroups: patients with newly-diagnosed DM and patients with DM duration longer than 1 year. The second main group consisted of patients with DR divided into two subgroups: patients with initial DR and patients with advanced DR. Every group consisted of patients with type 1 and type 2 DM. Controls for the electrophysiological (EF) studies were 47 healthy individuals. The VA function was examined by pattern visual evoked potentials (PVEPs). The main variables that were considered in the results analysis were the latency and amplitude, reflecting the configuration of the wave forms. The results showed that the PVEPs were more affected in patients with type 2 DM in the first three groups. In the group with advanced DR, the EF values were not statistically significantly different between the patients with type 1 and type 2 DM. The results demonstrated that PVEP studies could be used as an objective method for registration of early changes in the VA function as a DM complication and also, to monitor the changes in dynamics, as they are non-invasive, harmless, fast and repeatable.
Introduction
According to the latest definition of the International Expert Committee, diabetes mellitus (DM) is a group of metabolic diseases characterized by hyperglycemia, which is a result of impaired insulin secretion, decreased insulin action, or both. According to the International Diabetes Federation, in 2017 at least 451 million people worldwide suffered from DM. This number is expected to reach 693 million by 2045 [Citation1, Citation2].
Diabetic retinopathy (DR) is usually defined by detectable ophthalmoscopic or angiofluorographic visible changes in the retina. It is a manifestation of microangiopathy [Citation3, Citation4]. However, from a functional point of view, the retina is a vascularized neuronal tissue. In addition, in order to obtain a clear image, it is necessary for the entire visual path to the cortex to function properly [Citation5]. This is the reason why the modern concept of retinopathy involves retinal neurodegeneration and microvascular complications [Citation6–8]. The very recent opinion is that DR may be considered as a neurodegenerative disease before the vascular changes are evident [Citation9]. In recent years, there has been a renewal of the electrophysiological methods for early diagnosis of neurodegenerative changes in glaucoma and DM. The visual evoked potentials (VEPs) are used for objective study of the VA function. VEPs depend on the functional integrity of the entire visual pathway from the retina through the optic nerve, the optic tract, the optical radiation to the visual cortex [Citation10–13].
The aim of this study was to explore and compare the VA function by pattern visual evoked potentials (PVEPs) in patients with type 1 and type 2 DM in different stages of DR.
Subjects and methods
Study design
This is a prospective observation study with 3-year duration (2014–2017). A group of 185 people (370 eyes) was studied. The patients with DM were 138. They were divided into two main groups. The first group consisted of patients without DR (69 patients), with normal best corrected visual acuity (BCVA) (LogMar score 0.00 ETDRS (Early Treatment Diabetic Retinopathy Study)) аnd acceptable refractive errors ±2 dpt. This group was divided into two subgroups depending on the duration of DM: newly-diagnosed DM (i.e. DM diagnosed over the last year) in 34 patients, of whom 18 with type 1 and 16 with type 2 DM; and DM duration longer than 1 year in 35 patients, of whom 12 with type 1 and 23 with type 2 DM. The second main group consisted of patients with DR (69 people). The patients were divided into two subgroups depending on the DR stages: initial DR, i.e. first and second stage of non-proliferative DR – mild and moderate, according to the clinical classification of the American Academy of Ophthalmology (AAO) [Citation14]; this subgroup included 34 people, 11 with type 1 and 23 with type 2 DM. The second subgroup consisted of patients with advanced DR, i.e. third stage of non-proliferative DR (severe) and first stage of proliferative DR (early), according to the AAO classification, as well as patients with macular edema or macular ischemia – 35 people, 17 with type 1 and 18 with type 2 DM. The patients with DR had BCVA up to LogMar score 0.1 ETDRS (in case of lower vision, this study is not informative enough and flash stimulation should be performed) аnd acceptable refractive errors ±2 dpt. Fluorescein angiography (FA) and optical coherent tomography (OCT) were used for the classification of the different groups. None of the patients had undergone laser therapy because it would have affected the bioelectrical signal.
Controls for the electrophysiological (EF) studies were 47 healthy individuals (average age of 38.57 ± 12.37 years; 21 males and 26 females) with normal best corrected visual acuity ((LogMar score 0.00 ETDRS) аnd acceptable refractive errors ±2 dpt. and without any known ophthalmological or neurological disease as well as other systemic diseases. The distribution of the patients among the groups according to the type of DM, the mean age and the duration of DM is presented in .
Table 1. Distribution of the patients according to the type of DM, the mean age and the duration of DM.
The patients were examined clinically by full ophthalmologic examination, FA, OCT, electrophysiologically by PVEPs. Laboratory tests for blood sugar level, HbA1c and lipid levels were performed additionally. During the study, the patients were in normoglycemic condition (blood sugar levels between 4.0 and 6.1 mmol/L).
Ethics statement
The study meets the criteria of standards for good medical practice. It was carried out with the informed consent of all participants in compliance with all ethics standards under the Helsinki Declaration (2013).
Inclusion/exclusion criteria
We applied the following inclusion criteria: Patients with type 1 and type 2 DM with and without DR, acceptable refractive errors up to 2 dpt. The exclusion criteria were: Glaucoma, senile macular degeneration, advanced cataract, vascular eye diseases, optic neuritis, refractive errors more than 2 dpt., amblyopia. Multiple sclerosis, Parkinson's disease, epilepsy, dementia and brain tumour were excluded by neurologists.
Measurements of PVEPs
All studies of PVEPs were performed in a specially equipped certified electrophysiological laboratory. Standardized four-channel equipment ‘Neuro-MEP 4’ (Neurosoft Company) was used. The study was performed with a three-channel recording with equipment adjustments according to the latest published ISCEV standard PVEPs (2016) [Citation15, Citation16]. The main variables that were considered in the results analysis in the present study were latency (L) and amplitudes (A), reflecting the configuration of the wave forms.
The patients were in a sitting position. The distance to the monitor was 100 cm. The patients were examined with the appropriate optical correction for that distance if it was necessary, under mesopic conditions, identical in all patients, without mydriasis. We used a classic cathode stimulator with a contrast-reversing pattern from black to white and vice versa with an equal number of black and white squares in a checkboard, with standard individual width of 1° for a stimulating field of 30° for paracentral stimulation and 0.25° for a stimulating field of 15° for central stimulation. We performed monocular PVEPs stimulation. Standardized silver skin electrodes were used and the skin was pre-cleansed to provide good electrical conductivity. The active electrodes were placed on the scalp at standard locations according to the International System 10/20 – at Oz (above the visual cortex) (sagittal electrode) and two lateral occipital electrodes, placed horizontally at 3 cm to the right and to the left of Oz (about 5% from Oz) – O1 and O2 (ipsi- (IPSI) and crossed (CROSS) pathways). The reference electrode was at Fz (along the midline frontally, about 12 cm above the nasion) and the ground electrode was placed on the right wrist. The frequency reversion was 1 Hz, which corresponds to 2 reversals per second (rps) [Citation17–19]. The impedance between the recording and the ground electrode was less than 5 kΩ. The amplification of the input signal was 50,000 times, the input impedance of the amplifier was at least 100 MΩ and the rejection ratio exceeded 120 dB. The amplifier was electrically isolated and met the current safety standards. The analogue signal was digitized at a minimum sample rate of 500 samples per second per channel with a minimum resolution of 12 bits. Automatic artifact rejection based on signal amplitude was used to exclude signals exceeding ±100 μV in amplitude. Analogue high pass and low pass filters were set at <1 Hz (corresponding to a time constant 0.16) and at >100 Hz. Additional digital filtration with a frequency band of 0.5–50 Hz was carried out. A minimum of 100 artifact-free sweeps were averaged, the sweep time was 300 ms with 2 rps stimulation rate and 250 ms between reversals. The system was equipped with automatic rejection of artifacts with amplitude ±100 μV and a minimum sampling rate of 1000 Hz.
We analysed the latency and amplitudes of components P50, N75, P100, N145 and P200.
Statistical analysis was performed with IBM SPSS Statistics 23.0 statistical package. Descriptive statistical analysis was used, based on the calculation of the median and percentiles from the observed sample distribution with 95% reference interval as a limit of normal. The Refval program was used for calculating the laboratory normal ranges. Variation and comparative analyses were also performed.
Results and discussion
We performed a comparative analysis of all components of EF measurements in patients with DM in all different groups according to the DM type. The examination of the known obscuration factors, sex and age, showed no significant difference between the study groups.
Comparative analysis according to the type of DM in the group with newly-diagnosed DM without DR
Significant difference was found in latency in component N75 at 15° and 30° in 75% of electrode positions and in component P100 in 58% of the electrode positions. Component N145 differed significantly in 33% of the electrode positions ().
Table 2. Comparative analysis of PVEPs L values between both types of DM at 15° group with newly-diagnosed DM.
The patients with type 2 DM had significantly longer mean L values. In the amplitude components, there was significant difference in N145-P200 A component in both sagittal electrode positions and in P100-N145 component in the right eye at 15°. The patients with type 2 DM had lower A than those with type 1 DM ().
Table 3. Comparative analysis of PVEPs A values between both types of DM at 15° group with newly-diagnosed DM.
Comparative analysis according to the type of DM in the group without DR with DM duration longer than 1 year
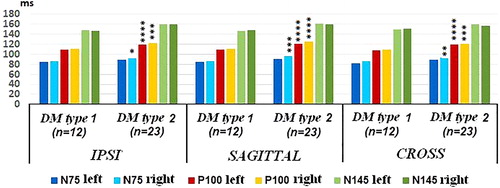
In L components, there was significant difference in component P100 at 15° and 30° in all electrode positions and in component N75 in sagittal, IPSI and CROSS electrode positions at 15° in the right eye. In component N145 a significant difference was observed at 30° in sagittal, IPSI and CROSS electrode positions in the right eye. This difference between the right and left eyes is evidence of the asymmetrical involvement of the eyes by DM. The patients with type 2 DM had significantly longer mean L ().
Figure 1. PVEPs L values in sagittal, IPSI and CROSS electrode positions in DM type 1 and type 2 at 15° group without DR, DM duration >1 year. *Р<0.05, **Р<0.01, ***Р<0.005 and ****Р<0.001.
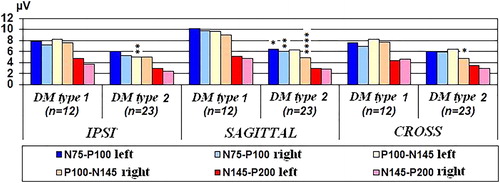
In A, patients with type 2 DM had significantly lower A values in N75–P100 component in both sagittal and in IPSI and CROSS electrode positions at 15° in the right eye. The component P100–N145 A was not significantly different between the patients with type 1 and type 2 DM only in sagittal and CROSS electrode positions at 15° in the left eye ().
Figure 2. PVEPs A values in sagittal, IPSI and CROSS electrode positions in DM type 1 and type 2 at 15° group without DR, DM duration >1 year. *Р<0.05, **Р<0.01, ***Р<0.005 and **** Р< 0.001.
At 30° a statistically significant difference between the PVEPs measurements of patients with type 1 and type 2 DM was found in N75–P100 component in both sagittal electrode positions (11%). A greater sensitivity of the central electrode positions was demonstrated.
Comparative analysis according to the type of DM in the group with initial DR
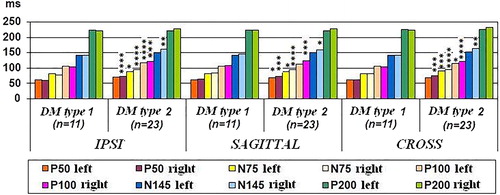
In L components, there were significant differences in almost all components, except P200 in all electrode positions and in component P50 in all electrode positions, except in the right eye at 15°. Patients with type 2 DM had significantly longer mean L values ().
Figure 3. PVEPs L values in sagittal, IPSI and CROSS electrode positions in DM type 1 and type 2 at 15° group with initial DR. *Р < 0.05, **Р < 0.01, ***Р < 0.005 and ****Р < 0.001.
Comparative analysis according to the type of DM in the group with advanced DR
The comparative analysis of all PVEPs components values between the patients of both types of DM demonstrated that there was no significant difference in any components in any electrode positions.
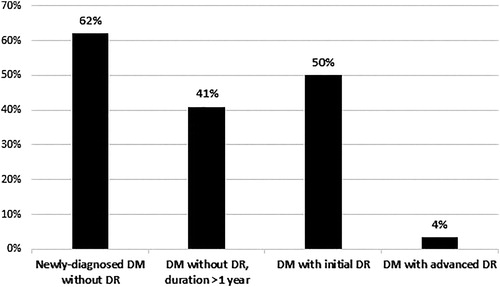
The differences of PVEPs components values between patients with type 1 and type 2 DM were most pronounced in the group with newly-diagnosed DM, followed by the group with DM with initial DR and the group without DR with DM duration longer than 1 year. In the most severely affected group, with advanced DR, the values of PVEPs components were not statistically significantly different. In that group, EF studies demonstrated very few differences between the patients of both types of DM ().
Figure 4. Percentage distribution of the number of different PVEPs values between patients with type 1 and type 2 DM in the different groups.
PVEPs are an objective method for detection of early changes in VA function before registration of retinal changes by FA and OCT [Citation20–23]. This proves that neurodegenerative changes in diabetic patients occur very early, before the detection of vascular changes in the retina.
The significant differences in PVEPs L values that we found in the comparative analysis according to the type of DM in the first three groups demonstrated conduction delay due to local demyelinating processes. The patients with type 2 DM had significantly longer mean L values. There were also significant differences in PVEPs A values between both types of DM: the patients with type 2 DM had significantly lower mean A values. This indicates axonal destruction. These results are in agreement with previous studies [Citation24–26]. Other authors have also observed significantly longer PVEPs L in patients with type 2 DM than in those with type 1 [Citation27]. Kothari et al. [Citation23] reported lower A of component P100 in type 2 DM. Similar results have been reported by other authors as well [Citation27–29]. Heravian et al. [Citation30] also found P100 L delay and lower A in type 2 DM. Other authors have described similar results in their studies in VEPs [Citation31–34]. According to other researchers, there is no significant difference in PVEPs between the two types of DM [Citation35]. Pescosolido et al. (2015) [Citation10] also reported for changes in EF studies in both types of DM in their study.
The results of our research indicate that PVEPs were more affected in patients with type 2 DM in the first three groups. In the most severely affected group, i.e. with advanced DR, the EF studies components values were statistically non-significantly different between patients with both types of DM. In many published reports however, the DM type is not specified or the results are not interpreted separately.
Our hypothesis based on the results we obtained is that it may take longer time to develop segmental demyelination of the nerve fibres, resulting in conduction delay and axonal destruction. In patients with type 2 DM, the diagnosis is usually late, in many cases with already developed complications. The presence of more risk factors such as arterial hypertension, dyslipidemia and obesity in patients with type 2 DM may also have a negative impact. However, the EF indices in the patients with type 1 DM were worse than those of the controls.
Conclusions
The results from this study demonstrated that EF studies, which are non-invasive, harmless, fast and repeatable, could be used as an objective method for registration of early neurodegenerative changes in the VA function as a DM complication and also to monitor the changes in dynamics. Based on the comparative analysis of PVEPs in patients with type 1 and type 2 DM in different DR stages, it could be speculated that segmental demyelination of the nerve fibres may take longer, resulting in conduction delay and axonal destruction. The biggest disadvantage of these methods is their limited use in clinical practice due to the lack of equipment and the insufficient training of young doctors in their application for diagnosis and monitoring of the VA function in a number of ophthalmological, neurological and some systemic diseases.
Disclosures statement
No potential conflict of interest was reported by the author.
Funding
No financial support was received for this submission.
Related Research Data
References
- Cho NH, Shaw JE, Karuranga S, et al. IDF Diabetes Atlas: global estimates of diabetes prevalence for 2017 and projections for 2045. Diabetes Res Clin Pract. 2018;138:271–281.
- American Diabetes Association. Improving Care and Promoting Health in Populations: Standards of Medical Care in Diabetes - 2018. Diabetes Care. 2018;41: S7–S12.
- Lucie Z. Využití elektrofyziologických vyšetřovacích metod v diagnostice onemocnění sítnice. Diplomova prace (The use of electrophysiological examination methods in the diagnosis of retinal disease. [Thesis]). Brno (Czech Republic): Masarykova univerzita Brno; 2016. p. 22–55. Czech.
- Yadar R, Poudel BH, Limbu N, et al. Normative data of Visual Evoked Potential in children and correlation with age. Asian J Med Sci. 2016;7:39–43.
- Noecker R, Garcia AG. Visual electrophysiology aids early diagnosis, treatment monitoring, disease tracking. Adv Ocular Care. 2016;88:61–63.
- Antonetti DA, Barber AJ, Bronson SK, et al. Diabetic retinopathy: seeing beyond glucose-induced microvascular disease. Diabetes. 2006;55:2401–2411.
- Barber AJ. A new view of diabetic retinopathy: a neurodegenerative disease of the eye. Prog Neuropsychopharmacol Biol Psychiatry. 2003;27:283–290.
- Bresnick GH. Diabetic retinopathy viewed as a neurosensory disorder. Arch Ophthalmol. 1986;104:989–990.
- Ola MS, Nawaz MI, Khan HA, et al. Neurodegeneration and neuroprotection in diabetic retinopathy. Int J Mol Sci. 2013;14:2559–2572.
- Pescosolido N, Barbato A, Stefanucci A, et al. Role of electrophysiology in the early diagnosis and follow-up of diabetic retinopathy. J Diabetes Res. 2015;2015:8. ID319692. [8 p.]
- Fishman GA, Birch DG, Holder GE, et al. Electrophysiologic testing in disorders of the retina, optic nerve and visual pathway. 2nd ed. Oxford (UK): Oxford University Press; 2001. p. 15–270. (American Academy of Ophthalmology Monograph Series; Book 2)
- Blair Y, Eggenberger E, Kaufman D. Current electrophysiology in ophthalmology: a review. Curr Opin Ophthalmol. 2012;23:497–505.
- Mendoza C. Visual electrophysiology basic principles and clinical applications. Roland Consult Electrophysiological diagnostic workshop and hands-on course; 2017 April 5–7, Berlin (Germany).
- American Academy of Ophthalmology. Basic and Clinical Science Course 2017–2018, Section 12 Retina and vitreous, Chapter 5. San Francisco, CA: American Academy of Ophthalmology; 2017; p. 89–111.
- Odom JV, Bach M, Brigell M, et al. ISCEV Standard for clinical visual evoked potentials: (2016 update)). Doc Ophthalmol. 2016;133:1–9.
- Epstein CM. American Clinical Neurophysiology Society Guideline 5: guidelines for standard electrode position nomenclature. J Clin Neurophysiol. 2006;23:107–110.
- Hayashi H, Kawaguchi M. Intraoperative monitoring of flash visual evoked potential under general anesthesia. Korean J Anesthesiol. 2017;70:127–135.
- Leocani L, Dalla Costa G, Guerrieri S, et al. Visual evoked potentials are more sensitive than optical coherence tomography in clinically isolated syndrome. 7th Joint Ectrims-Actrims meeting; 2017 Oct 25–28; p. 595, 124.
- Sawaya R, Sawaya H, Yousset G. Pattern reversal visual evoked potentials in adults: variability with age. Clin Invest Med. 2017;40:252–259.
- Mermeklieva E, Cherninkova S, Grozeva G, et al. Combined electrophysiological method for early diagnostics of functional changes in the optical analyzer in human with newly-diagnosed diabetes mellitus. Gen Med. 2017;19:3–8. Bulgarian
- Batta M, Sharma R, Gupta N, et al. Visual evoked potentials in children with type 1 diabetes mellitus. Int J Res Med Sci. 2018;6:1165–1171.
- Gowri V. Evaluation of visual evoked potentials in type II diabetes mellitus subjects attending a tertiary care hospital. Int J Res Med Sci. 2018;6:3025–3029.
- Kothari R, Bokariya P, Singh S, et al. Evaluation of the role of visual evoked potentials in detecting visual impairment in type II diabetes mellitus. Delhi J Ophthalmol. 2018;28:29–35.
- Sivakumar R, Ravindran G, Muthayya M, et al. Diabetic retinopathy analysis. J Biomed Biotechnol. 2005;2005:20–27.
- Collier A, Reid W, McInnes A, et al. Somatosensory and visual evoked potentials in insulin-dependent diabetics with mild peripheral neuropathy. Diabetes Res Clin. Pract. 1988;5:171–175.
- Moreo G, Mariani E, Pizzamiglio G, et al. Visual evoked potentials in NIDDM: a longitudinal study. Diabetologia. 1995;38:573–576.
- Pierzchala K, Kwiecinski J. Blood flow in ophthalmic artery and visual evoked potentials in diabetic patients. Wiad Lek. 2002;55:183–188.
- Lopes de Faria JM, Katsumi O, Cagliero E, et al. Neurovisual abnormalities preceding the retinopathy in patients with long-term type 1 diabetes mellitus. Graefes Arch Clin Exp Ophthalmol. 2001;239:643–648.
- Lieth E, Gardner TW, Barber AJ, Penn State Retina Research Group, et al. Retinal neurodegeneration: early pathology in diabetes. Clin Exp Ophthalmol. 2000;28:3–8.
- Heravian J, Ehyaei A, Shoeibi N, et al. Pattern visual evoked potentials in patients with type II diabetes mellitus. J Ophthalmic Vis Res. 2012;7: 225–230.
- Han SH, Kim H, Lee SS. A 5-year follow-up visual evoked potentials and nerve conduction study in young adults with type 1 diabetes mellitus. Neurol Asia. 2016;21:367–374.
- Ewing FM, Deary IJ, Strachan MW, et al. Seeing beyond retinopathy in diabetes: electrophysiological and psychophysical abnormalities and alterations in vision. Endocr Rev. 1998;19:462–476.
- Anastasi M, Lauricella M, Giordano C, et al. Visual evoked potentials in insulin-dependent diabetics. Acta Diabetol Lat. 1985;22:343–349.
- Comi G. Evoked potentials in diabetes mellitus. Clin Neurosci. 1997;4:374–379.
- Algan M, Ziegler O, Gehin P, et al. Visual evoked potentials in diabetic patients. Diabetes Care. 1989;12:227–229.