
Abstract
Herpetospermum caudigerum (Ser.) Baillis is an endangered species found in high altitude regions of Tibet in China. In this work, its genetic diversity and genetic structure were investigated based on nuclear and chloroplast DNA. A total of 426 fragments were scored using 10 amplified fragment length polymorphism (AFLP) primer combinations, and from these, 256 fragments (60.7%) were polymorphic and could differentiate these populations. The dendrogram revealed that populations from different altitude have rich genetic diversities (Ht = 0.156, Hs = 0.111, Gst = 0.287 and Nm = 1.618). The averages of the number of alleles (Na), effective number of alleles (Ne), Nei’s genetic diversity (H) and Shannon’s index (I) were 1.352, 1.188, 0.111 and 0.168, respectively. In addition, 5 P03-trnL-trnF-300 haplotypes and 3 P02-trnL-trnF-396 haplotypes were identified among the 4 populations, and 7 haplotypes were identified based on the combined fragments. The non-coding region P03-trnL-trnF-300 exhibited higher polymorphisms with the number of haplotypes, the abundant haplotype (gene) diversity and the nucleotide diversity. Tajima’s test showed that all Tajima’s D values were statistically significant at P < 0.05, indicating that natural selection has an effect on mutations in these fragments. Our results from H. caudigerum cpDNA indicated a high genetic diversity fixation index (Fst = 0.968) and showed greater genetic differentiation among populations (96.7%, P < 0.01) than analysis of nDNA (63.72%, P < 0.01). These results could lay the foundation for further understanding and conservation of H. caudigerum germplasm resources.
Introduction
The highest plateau on Earth, the Tibetan Plateau, is 4000 m above sea level, with extreme environmental conditions as characterized by the dryness, low oxygen pressure, low temperature, strong ultraviolet (UV) radiation and violent winds [Citation1]. Despite of these extreme environments, various Tibetan plant species have successfully lived in the plateau due to highland adaptations. Accordingly, heterogeneity of habitats in high altitude areas can contribute to rich genetic biodiversity [Citation2], which is important to sustain traditional agriculture. Therefore, it is valuable to collect, describe and evaluated their diversity, sufficiently, especially to endangered plant species [Citation3–5].
Herpetospermum caudigerum (Ser.) Baill (H. caudigerum Baill) is naturally distributed in high altitude regions, e.g., the Tibet, Yunnan and Sichuan province in China, and is best known in the Tibetan Plateau as traditional medicinal herb [Citation6]. Generally, its dried and ripe seeds are used for the treatment of infections, cholecystitis, jaundice, hepatitis and dyspepsia, which is why it has become a focus of research [Citation7,Citation8]. However, in recent years, wild H. caudigerum has been listed as an endangered plant, due to destruction of habitat, difficulties with tissue culture, climate change and exploitation [Citation9–13]. Conservation of plant species often requires ex situ cultivation in living collections [Citation14]. Unfortunately, the genetic diversity of H. caudigerum in the Tibetan Plateau is still largely unknown, as a valuable medicinal plant source.
To date, several DNA-based molecular marker techniques, such as simple sequence repeat (SSR), restriction fragment length polymorphism (RFLP) and single nucleotide polymorphism (SNP) have been utilized to identify the genetic diversity of plant species [Citation15–17]. Most molecular markers have the advantage of being non-tissue-specific, relatively abundant, suitable for early rapid assessment, and less susceptible to environmental impacts [Citation18]. In addition, amplified fragment length polymorphism (AFLP) and chloroplast microsatellites are also reliable genetic markers and have been widely utilized for genetic analysis of herbaceous plants due to their highly sensitive, efficient, and reproducible characteristics [Citation19,Citation20]. The combined analysis of nuclear and chloroplast genomes may provide vital information for guiding conservation efforts.
Although some papers have reported on the feasibility of seed germination [Citation21] and techniques of tissue culture [Citation22] on H. caudigerum, the genetic diversity of this species is not clear. The main objective of this study was to access the genetic diversity and population relationships of H. caudigerum from different altitude gradients using AFLP and chloroplast markers. These results will benefit the conservation and exploitation of the germplasm resources of H. caudigerum and provide a theoretical basis for further studies of the evolution and phylogeography of the germplasm resources of H. caudigerum.
Materials and methods
Plant materials and DNA extraction
In this study, we selected four wild H. caudigerum Baill (2n = 2x = 20) populations from different altitudes (2800 m, 3000 m, 3100 m and 3300 m) in the College of Agriculture and Animal Husbandry, Tibet, China (Supplementary Figure S1). A total of 70 individuals were selected randomly for the diversity analysis using the AFLP and chloroplast microsatellite method. The sampling information is summarized in .
Table 1. Location and sample size of the four populations in the study.
The total genomic DNA was extracted from approximately 0.1 g of fresh leaves using the Plant Genomic DNA Kit (Zoman, Beijing, China) following the instructions supplied with the kit. The concentration and quality of extracted DNA were checked by an UV–VIS spectrophotometer (UV-1800; Shimadzu, Japan) and assessed by electrophoresis on 0.8% agarose gels. Then, the extracted DNA was adjusted to 40 ng/μL with autoclaved, deionized water and used for polymerase chain reaction (PCR) amplification.
PCR amplification, sequencing and genotyping
The AFLP primers and adapters were chosen according to the method described by Meng et al. [Citation23] (Supplementary Table S1). The reaction protocol was performed as previously described by Costa et al. [Citation24] with minor modifications. The pre-amplification mixture (20 μL) contained 1 μL of ligation mixture, 2.5 mmol/L dNTPs, 10× buffer, 20 mmol/L pre-amplification primer, and 1 U of Taq polymerase. The selective amplification was performed in a 20 μL volume including 5 μL of template, 10× buffer, 2.5 mmol/L dNTPs, 20 mmol/L selective amplification primer, and 1 U of Taq polymerase. The amplified fragments were separated in a 6% polyacrylamide sequencing gel and detected using silver staining as previously described by Li et al [Citation25].
In addition, trnL-trnF regions of chloroplast DNA were amplified and sequenced as described by Phumichai et al. [Citation26] (Supplementary Table S2). Amplification was performed in a volume of 50 μL containing 4 μL of template, 10 μmol/L primer pairs, 2.5 mmol/L dNTPs, 2.5 mmol/L 10× Buffer, and 2.5 U of Taq polymerase. The amplification was performed using the following conditions: 94°С for 3 min, 35 cycles of 94°С for 60 s, 53°С for 45 s, and 72°С for 105 s; and 72°С for 10 min. PCR products were run on 2% agarose gels to verify a specific band and determine the size of the amplified products.
Data analysis
AFLP fragments for each primer combination were scored manually as present (1) or absent (0) for a binary data matrix. To assess the genetic diversity of H. caudigerum Baill., the genetic parameters, including the number of total bands, the number of polymorphic bands, polymorphic rates, number of alleles (Na), effective number of alleles (Ne), Nei’s gene diversity (H), Shannon’s information index (I), total gene diversity (Ht), population diversity (Hs), Nei’s genetic differentiation index (Gst), gene flow (Nm), geographic and genetic distance between populations were calculated by PopGene v1.32 software [Citation27]. Unweighted pair group method using arithmetic average (UPGMA) and principal coordinates analysis (PcoA) results was produced using NTSYS-pc Version 2.10 software. Analysis of molecular variance (AMOVA 1.55) software was used to calculate genetic variances among and within populations and genetic differentiation [Citation28]. The Bayesian program STRUCTURE v.2.3.4 software was used to determine the genetic structure among the populations. The analysis was performed by setting the number of populations (K) from 2 to 4. The burn-in steps and the number of replicates were 10,000 and 50,000 for each K, respectively. The optimum K was estimated by the ΔK according to Structure Harvester [Citation29].
Sequences were viewed and overlapping fragments were assembled using DNAStar. The cpDNA sequences of the trnL-trnF region were trimmed and aligned using MEGA v5.1, and they were double-checked by eye. Haplotypes and haplotype diversity statistics were calculated using the program DNAsp 5.0 [Citation30]. The median-joining model implemented to investigate the evolutionary relationships between haplotypes in NETWORK 4.6.1.2 [Citation31]. To estimate the degree, genetic differentiation was performed by the molecular variance (AMOVA) analysis according to Arlequin V3.5 software [Citation32]. The population genetic structure was analysed as described previously.
Results and discussion
The understanding of genetic diversity is the basis for the genetic improvement of endangered plant species. In general, molecular markers can provide key information to estimate the genetic diversity [Citation33]. AFLP and chloroplast markers have emerged in previous reports as efficient, accurate and highly reproducible methods [Citation34,Citation35]. However, there are no related reports that have used both AFLP and cpDNA methods to investigate the genetic variation on H. caudigerum. In this study, we investigated the genetic structure of four populations of H. caudigerum from different altitudes based on nDNA (AFLP) and cpDNA (chloroplast DNA).
Genomic AFLP analysis
A total of 426 bands were amplified by 10 AFLP primer pairs in this study (), of which the mean percent of polymorphic bands was 60.7%. These results indicate extensive allelic diversity within these populations, which were similar to our previous study on Fragaria ananassa Duch and Aconitum kongboense L in Tibet (58.8% and 64.12%, respectively) [Citation36]. The size of the fragments ranged from 100 to 3500 bp (data not shown). The number of scorable fragments amplified by each primer pair varied from 28 to 57, with an average of 42.6. It was higher than in a previous report on chickpea (Cicer spp.) by Saeed et al. [Citation37]. This is not only because that previous experiment involved a different species, but also because it detected the reaction products by agarose-gel electrophoresis, whereas we used polyacrylamide-gel electrophoresis in the present study. The primer pair of E21 + M21 amplified the lowest number of fragments (28). The primer pair of E22 + M33 amplified the highest number of fragments (57). Furthermore, the average number of polymorphic fragments amplified by the tested primer pairs was 25.6. The percentage of polymorphic bands varied from 39 to 77%, with an average of 60.7%. This was higher than our previous report on Aconitum kongboence L. from Tibet [Citation23]. The differences in all of these data could be ascribed to the materials or the AFLP primer sets.
Table 2. Ten primer combinations used for genetic analysis of the four H. caudigerum Baill populations.
Based on nDNA, the values of Na, Ne, H, I, Ht and Hs were determined in the studied accessions, with an average of 1.352, 1.188, 0.111, 0.168, 0.156 and 0.111, respectively. They were the highest in the E41 + M43 primer combination (Na =1.448, Ne = 1.238, H = 0.139 and I = 0.209) and the lowest in the E22 + M33 primer combination (Na = 1.193, Ne = 1.095, H = 0.057 and I = 0.088). The genetic variation of all samples was evaluated according to the mean genetic diversity (). The total expected heterozygosity (Ht) and genetic diversity within populations (Hs) were 0.156 and 0.111, respectively. Moreover, the level of genetic differentiation among populations (Gst) ranged from 0.121 to 0.502, with an average of 0.287. The gene flow (Nm) varied from 0.496 to 3.642, with a mean of 1.618. These data showed that the level of genetic differentiation was higher than in other species as reported by Ohsawa et al. [Citation38] (Quercus crispula Gst = 0.090), Chen et al. [Citation39] (Prunus pseudocerasus Gst = 0.209) and Wang et al. [Citation40] (Castanopsis sclerophylla Gst = 0.137).
In addition, we compared and analyzed the genetic variation among and within populations based on all AFLP results (). The AMOVA results revealed significant genetic variation (63.72%) among populations. However, 36.28% existed within populations, which is high significantly. Furthermore, our results from the cpDNA from H. caudigerum indicated a high level of genetic diversity fixation index (Fst = 0.968) and a higher genetic differentiation among populations (96.7%, P < 0.01) compared with the nDNA analysis (63.72%, P < 0.01).
Table 3. Analysis of molecular variance for four high altitude populations of H. caudigerum Baill based on AFLP and cpDNA sequence data.
The pairwise geographic and genetic distance of different altitudes was analyzed (). The analysis of the genetic distance indicated that the genetic distance was the highest between the populations from 2800 m and 3000 m (0.096), whereas the genetic distance between 3000 m and 3100 m populations was 0.017. In addition, the geographic distance was the lowest between 3100 m and 3300 m populations (13.081), which showed the highest relationship. Tajima’s D values were statistically significant, with P < 0.05, indicating genetic bottleneck events in the local population. However, these results are contrary to those of studies with Trailliaedoxa gracilis [Citation41]. In general, the geographical conditions may be the main contribution to the low level of genetic variation by nDNA. For example, in order to adapt to the extreme environments of the Tibet plateau (large temperature differences, dryness and high radiation), H. caudigerum has evolved hard shells and low seed germination rates. The reduced effective population size and geographical isolation make maternally inherited chloroplast markers more likely to record the effects of population history in current genetic patterns than nuclear markers [Citation42–46].
Table 4. Mantel test relationship between geographic (above diagonal) and genetic distance (below diagonal).
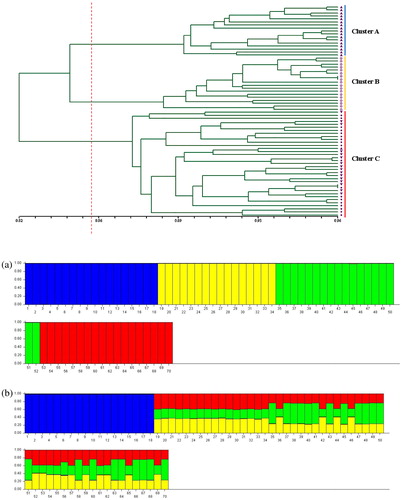
According to Nei’s genetic distance, cluster analysis was performed to show the genetic relationship between different populations using the UPGMA method (). The similarity coefficients among all populations ranged from 0.82 to 0.96, with an average value of 0.857. All of the materials were distinctly divided into three major groups. The population at 2800 m was solely grouped in Cluster A (blue colour). The population at 3300 m was clustered in Cluster B (yellow colour). The populations at 3100 m and 3000 m were found in Cluster C (red colour). Overall, the cluster results indicated that all accessions were closely related to each other.
Figure 1. UPGMA dendrogram of 70 accessions using AFLP.
Note: Samples from 2800 m (up-pointing triangles); samples from 3000 m (down-pointing triangles); samples from 3100 m (filled circles); samples from 3300 m (open circles).
Principal coordinates analysis (PCoA analysis) revealed a pronounced genetic variation among the four H. caudigerum populations, which is in accordance with the clustering pattern produced by STRUCTURE software (Supplementary Figure S2). Three principal axes divided all materials into three groups. The 2800 m and 3300 m populations were clustered into two groups. The remaining individuals (from 3000 m to 3100 m) were clustered together into one group.
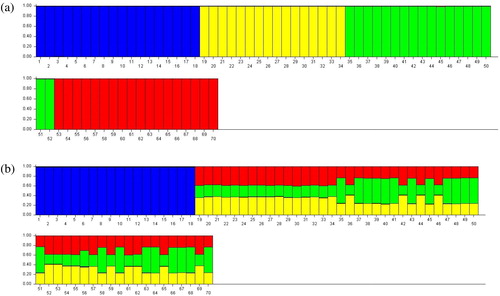
The genetic structure of 70 individuals from four populations was analyzed according to differences of allele frequency. In this study, the K-value was reached at 2 to 4. The maximum likelihood values showed that the best appropriate number of populations was four (K = 4). Structure cluster analysis () showed that Cluster A (blue) included the population from 2800 m, Cluster B (yellow) consisted of the population from 3000 m, Cluster C (green) consisted the population from 3100 m, and the population from 3300 m formed Cluster D (red). The structure graph presented four clear groups, whereas the individuals were distinctly resembled in each elevation group.
Figure 2. Individual-based cluster analysis using STRUCTURE for K = 4 based on AFLP data (a) and cpDNA data (b).
Note: samples from 2800 m (blue); samples from 3000 m (yellow); samples from 3100 m (green); samples from 3300 m (red).
Furthermore, the cluster analysis and PcoA analysis revealed that the populations from 3000 m to 3100 m were more closely related to each other and reflected the geographic distribution patterns of these populations. For instance, Cluster A and B constitute the individuals from 2800 m to 3300 m, respectively. The materials from higher altitude (3000 m and 3100 m) were also clustered together.
The cluster analysis suggests that the genetic diversity of the populations correlates with their eco-geographic origins. These results were similar to the previous reports, and may arise from gene flow, artificial selection or life history [Citation47–49].
cpDNA analysis
Now, the knowledge of the population structure of wild H. caudigerum is still poorly known, although studies on similar morphological forms of Herpetospermum spp. have been reported [Citation50]. However, no reports were available on the structure and level of population variation of H. caudigerum. Chloroplast DNA (cpDNA) analysis revealed that different cpDNA haplotypes were found at high altitudes including 3000 m, 3100 m and 3300 m, indicating multiple origins of these H. caudigerum representatives from high altitudes. The origin of H. caudigerum has been analyzed by Guan et al. [Citation50]. Indeed, the geographical distribution of H. caudigerum is mainly confined to high altitude in Tibet, suggesting low levels of variation occurred at high altitude. Additionally, pollen-mediated gene flow may be strong at a high altitude, giving rise to a dependent population.
The genetic diversity statistics are summarized in . P03-trnL-trnF-300 showed higher values for haplotype diversity (Hd), variance of haplotypes diversity (Vh), total nucleotide diversity (Pi) and standard deviation of haplotypes diversity (Sh) and total nucleotide diversity (Pi). In addition, the neutrality test statistics (Tajima’s D test) were significant at P < 0.05 levels ().
Table 5. Genetic diversity information of cpDNA sequences in H. caudigerum Baill populations from different altitudes.
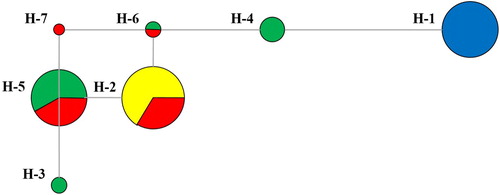
Haplotype H1 was found in a single population (2800 m). Of the haplotype H2 samples, 67% (16) and 33% (8) belonged to the 3000 m population and the 3300 m population, respectively (). Overall, H2 was the most frequent haplotype (34.3%), followed by haplotypes H5 (27.1%) and H1 (25.7%), whereas the frequency of the other four haplotypes was only 12.9% ().
Table 6. Haplotype distribution based on cpDNA sequences in different altitude populations of H. caudigerum Baill.
The analysis of molecular variance (AMOVA) based on cpDNA showed strong genetic differentiation among all accessions (): 96.79% of the variation was among populations, and 3.21% of the variation was within populations. The results showed greater genetic differentiation among populations than within populations, and a relatively low level of genetic diversity within the existing germplasm of this plant species. At the same time, the genetic variation among and within accessions were significant based on cpDNA (Fst = 0.96794, P < 0.05).
Based on cpDNA data, all of the 70 samples between pairs of populations resulted in statistically significant Fst (). The value of Fst was from 0.17 to 1.00 between two populations from different altitudes. The mean Fst between pairs of populations was 0.96 ± 0.36 (P < 0.05). This indicated that H. caudigerum has narrow genetic background. This low level of genetic diversity may be attributed to technological or geographical reasons. In addition, the Tibetan Plateau experienced interglacial/postglacial periods; accordingly, the current distribution of plant species at the Tibetan Plateau is strongly affected by glaciations and paleo-environments during the Quaternary [Citation51].
Table 7. Fst value pairwise difference of populations of H. caudigerum Baill.
The STRUCTURE analysis of the cpDNA dataset revealed that the most likely number of populations was K = 4. Therefore, the details for the STRUCTURE analysis at K = 4 were shown. In , among the 70 individuals, 17 individuals from 2800 m belong to one Cluster (blue), whereas the other individuals from 3000 m, 3100 m and 3300 m altitudes were not differentiated from each other and showed a genetic mixture.
Two polymorphic cpDNA loci (P03-trnL-trnF-300 and P02-trnL-trnF-396) were selected, and 28 alleles were produced. For these alleles, 7 haplotypes (from H1 to H7) were identified (Supplementary Table S3). Based on the median joining network, three main groups were formed (). Haplotype H2 harbouring 24 individuals from 3000 m and 3300 m had a high haplotype frequency, which could be the dominant haplotype. H1 haplotype was characteristic for all individuals of the 2800 m population and was not contained any other population. Haplotype H2, H5 and H6 showed a closer relationship with H7, but Haplotype H1 had a distant relationship with other closer haplotypes. Thus, the network demonstrated that the haplotype was from the same parent, but diverse development directions were generated between haplotype H1 and the other haplotypes due to the long evolutionary process. Therefore, the genetic diversity of the population of H. caudigerum was influenced by altitude. In contrast to the populations from higher altitudes, the population at 2800 m showed low level of genetic differentiation and probably originated from a common ancestor regardless of their geographical separation.
Figure 3. cpDNA haplotype network based on cpDNA data.
Note: samples from 2800 m (blue); samples from 3000 m (yellow); samples from 3100 m (green); samples from 3300 m (red).
According to the genetic diversity data, the resources of H. caudigerum should be rationally exploited. On the one hand, it is recommended that the introduction of new germplasm will contribute to the preservation of genetic diversity, crop improvement and resources utilization. On the other hand, a cultivation technology of H. caudigerum has been introduced and has helped to establish the breeding system, plantations and management regimes.
Conclusions
In the present study, we combined AFLP with cpSSRs to analyze the genetic relationship of H. caudigerum populations collected at different altitude. Altogether, the UPGMA and STRUCTURE analysis indicated that the 70 samples can be clustered into three groups, the 2800 m, 3000 m and a combination of 3100 m and 3300 m, respectively. In addition, the cpSSRs technique appeared more suitable for the assessment of the genetic diversity of H. caudigerum based on simple chloroplast structure, satisfactory repeatability and accuracy. More importantly, these results could provide a more scientific basic for further understanding the genetic differentiation and conservation strategies for the H. caudigerum germplasm.
Author’s contributions
XFL and MFJ conceived and designed the experiments. XFL, LP, JMQ and QH performed the experiments. XFL, LP and SLQ analyzed or interpreted the data for the work. XFL, LP, JMQ, and QH wrote the manuscript. XFL, LP, JMQ and SLQensure that questions related to the accuracy or integrity of any part of the work. All authors read and approved the final manuscript.
Supplemental Material
Download PDF (331.6 KB)Disclosure statement
No potential conflict of interest was reported by the authors.
Funding
This study was supported by the Fundamental Research Funds for the Central Universities (2572018CG05) and the National Natural Science Foundation of China (No. 31360073 and 31160290).
Data archiving statement
There are no linked research data sets for this submission. The following reason is given: All data generated or analyzed during this study are included in this published article and its Additional files.
Related Research Data
References
- Alarcon M, Vargas P, Saez L, et al. Genetic diversity of mountain plants: two migration episodes of Mediterranean Erodium (Geraniaceae). Mol Phylogenet Evol. 2012;63:866–876.
- Lockhart PJ, Mclenachan PA, Havell D, et al. Phylogeny, dispersal and radiation of New Zealand alpine buttercups: molecular evidence under split decomposition. Ann Missouri Botanic Garden. 2001;88:458–477.
- Wang J, Li Z, Guo Q, et al. Genetic variation within and between populations of a desert poplar (Populus euphratica) revealed by SSR markers. Ann Forest Sci. 2011;68:1143–1149.
- Cascante A, Quesada M, Lobo JJ, et al. Effects of dry tropical forest fragmentation on the reproductive success and genetic structure of the tree Samanea saman. Conserv Biol. 2002;16:137–147.
- Thiel T, Michalek W, Varshney RK, et al. Exploiting EST databases for the development and characterization of gene-derived SSR-markers in barley (Hordeum vulgare L.). Theor Appl Genet.. 2003;106:411–422.
- Zhang M, Deng Y, Zhang HB, et al. Two new coumarins from Herpetospermum caudigerum. Chem Pharm Bull.. 2008;56:192–193.
- Yang L, Suo Y, Zhou C, et al. Study on trace elements in seeds of Herpetospermum penduculosum (ser) Baill. Trace Element Sci. 2003;10:45–47.
- Jiang X, Zhang H, Mehmood K, et al. Protective effects of Herpetospermum caudigerum extracts against liver injury induced by carbon tetrachloride in mouse. J Biol Regulator Homeost Agent. 2018;32:699–704.
- Tian Y, Xing C, Cao Y, et al. Evaluation of genetic diversity on Prunus mira Koehne by using ISSR and RAPD markers. Biotechnol Biotechnol Equip. 2015;29:1053–1061.
- Xing C, Tian Y, Guan FC, et al. Evaluation of genetic diversity in Amygdalus mira (Koehne) Ricker using SSR and ISSR markers. Plant Syst Evol. 2015;301:1055–1064.
- Wen Y, Uchiyama K, Ueno S, et al. Assessment of the genetic diversity and population structure of Maire yew (Taxus chinensis var. mairei) for conservation purposes. Can J Res. 2018;48:589–598.
- Wang HL, Zhou CF, Suo YR. Extraction of Herpetospermum peduncles (Ser.) Baill. Seed oil with supercritical carbon dioxide and analysis of the fatty acids using GC/MS. Anal Test Technol Instrum. 2006;12:42–46.
- Zhao XE, Suo YR, Wang LY, et al. Analysis of carbohydrates in a Tibetan medicine using new labeling reagent, 1-(2-naphthyl)-3-methyl-5-pyrazolone, by HPLC with DAD detection and ESI-MS identification. J Liquid Chromatogr Related Technol. 2008;31:2375–2400.
- Griffith MP, Calonje M, Meerow AW, et al. Can a botanic garden cycad collection capture the genetic diversity in a wild population? Int J Plant Sci. 2015;176:1–10.
- Garcíalor A, Luro F, Navarro L, et al. Comparative use of InDel and SSR markers in deciphering the interspecific structure of cultivated citrus genetic diversity: a perspective for genetic association studies. Mol Genet Genomic. 2012;287:77–94.
- Liang M, Yang XM, Li H, et al. De Novo transcriptome assembly of pummelo and molecular marker development. PLoS One. 2015;10:e0120615.
- Sanabam R, Singh NS, Sahoo D, et al. Genetic relationship of rough lemon landraces and under-utilised citrus genotypes from North-East India revealed by SSR and RAPD markers. Trees. 2018;32(4):1043–1059.
- Zhang ZX, Niu HY, Guo X, et al. Genetic diversity and genetic structure of Corydalis tomentella Franch (Papaveraceae), an endangered herb species from Central China. Biochem Syst Ecol. 2015;63:27–33.
- Arias M, Hernandez M, Remondegui N, et al. First genetic linkage map of Taraxacum koksaghyz Rodin based on AFLP, SSR, COS and EST-SSR markers. Sci Rep. 2016;6:29.
- Wang YL, Guo J, Zhao GF. Chloroplast microsatellite diversity of Clintonia udensis (Liliaceae) populations in East Asia. Biochem Syst Ecol. 2011;39:22–30.
- Wang HX, Chen Y, Cai ZP. Study on seed germination character of Tibet Herpetospermum pedunculosum(ser.)C.B.Clarke. Northern Horticult. 2010;21:215–217.
- Xin FM, Zang JC, Lan XZ. Callus induction and plant regeneration in Herpetospermum pedunculosum. Chin Trad Herb Drug. 2012;43:360–363.
- Meng FJ, Peng M, Wang RD, et al. Analysis of genetic diversity in Aconitum kongboense L. revealed by AFLP markers. Biochem Syst Ecol. 2014;57:388–394.
- Costa R, Pereira G, Garrido I, et al. Comparison of RAPD, ISSR, and AFLP molecular markers to reveal and classify orchardgrass (Dactylis glomerata L.) germplasm variations. PLoS One. 2016;11:e0152972.
- Li S, Gan X, Han H, et al. Low within-population genetic diversity and high genetic differentiation among populations of the endangered plant Tetracentron sinense Oliver revealed by inter-simple sequence repeat analysis. Ann Forest Sci. 2018;75:74.
- Phumichai C, Phumichai T, Wongkaew A. Novel chloroplast microsatellite (cpSSR) markers for genetic diversity assessment of cultivated and Wild Hevea RUBBER. Plant Mol Biol Rep.. 2015;33:1486–1498.
- Wang Y, Jiang H, Peng S, et al. Genetic structure in fragmented populations of Hippophae rhamnoides ssp. sinensis in China investigated by ISSR and cpSSR markers. Plant Syst Evol.. 2011;295:97–107.
- Peakall R, Smouse PE. GENALEX 6: genetic analysis in Excel. Population genetic software for teaching and research. Mol Ecol Note. 2006;6:288–295.
- Marques I, Shiposha V, Lopez-Alvarez D, et al. Environmental isolation explains Iberian genetic diversity in the highly homozygous model grass Brachypodium distachyon. BMC Evol Biol. 2017;17:139.
- Excoffier L, Estoup A, Cornuet JM. Bayesian analysis of an admixture model with mutations and arbitrarily linked markers. Genetics. 2005;169:1727–1738.
- Chiarini FE, Scaldaferro MA, Bernardello G, et al. Cryptic genetic diversity in Solanum elaeagnifolium (Solanaceae) from South America. Aust J Bot. 2018;66:531. [cited 2019 Jun 29]
- Plenk K, Bardy K, Hohn M, et al. No obvious genetic erosion, but evident relict status at the westernmost range edge of the Pontic-Pannonian steppe plant Linum flavum L. (Linaceae) in Central Europe. Ecol Evol. 2017;7:6527–6539.
- Li JM, Jin ZX, Tan T. Genetic diversity and differentiation of Sinocalycanthus chinensis populations revealed by chloroplast microsatellite (cpSSRs) markers. Biochem Syst Ecol. 2012;41:48–54.
- Castro I, Pinto-Carnide O, Ortiz JM, et al. Chloroplast genome diversity in Portuguese grapevine. Mol Biotechnol. 2013;54:528–540.
- Yotsukura N, Maeda T, Abe T, et al. Genetic differences among varieties of Saccharina japonica in northern Japan as determined by AFLP and SSR analyses. J Appl Phsycol. 2016;28:3043–3055.
- Peng M, Zong X, Wang C, et al. Genetic diversity of strawberry (Fragaria ananassa Duch.) from the Motuo County of the Tibet Plateau determined by AFLP markers. Biotechnol Biotechnol Equip. 2015;29:1–6.
- Saeed A, Darvishzadeh R. Association analysis of biotic and abiotic stresses resistance in chickpea (Cicer spp.) using AFLP markers. Biotechnol Biotechnol Equip. 2017;31:1–11.
- Ohsawa T, Tsuda Y, Saito Y, et al. The genetic structure of Quercus crispula in northeastern Japan as revealed by nuclear simple sequence repeat loci. J Plant Res.. 2011;124:645–654.
- Chen T, Wang XR, Tang HR, et al. Genetic diversity and population structure of Chinese Cherry revealed by chloroplast DNA trnQ-rps16 intergenic spacers variation. Genet Resour Crop Evol.. 2013;60:1859–1871.
- Wang R, Compton SG, Chen XY. Fragmentation can increase spatial genetic structure without decreasing pollen-mediated gene flow in a wind-pollinated tree. Molecular Ecology. 2011;20:4421–4432.
- Jia J, Zeng LQ, Gong X. High genetic diversity and population differentiation in the critically endangered plant species Trailliaedoxa gracilis (Rubiaceae). Plant Mol Biol Rep. 2016;34:327–338.
- Gong X, Luan SS, Hung KH, et al. Population structure of Nouelia insignis (Asteraceae), an endangered species in southwestern China, based on chloroplast DNA sequences: recent demographic shrinking. J Plant Res.. 2011;124:221–230.
- Schaal BA, Hayworth DA, Olsen KM, et al. Phylogeographic studies in plants: problems and prospects. Mol Ecol. 1998;7:465–474.
- Petit RJ, Mousadik AE, Pons O. Identifying populations for conservation on the basis of genetic markers. Conserv Biol. 2008;12:844–855.
- Sun M, Al E. Deep phylogenetic incongruence in the angiosperm clade Rosidae. Mol Phylog Evol. 2015;83:156–166.
- De-Xing Z, Hewitt GM. Nuclear DNA analyses in genetic studies of populations: practice, problems and prospects. Mol Ecol. 2010;12:563–584.
- Golestan Hashemi FS, Ismail MR, Rafii MY, et al. Critical multifunctional role of the betaine aldehyde dehydrogenase gene in plants. Biotechnol Biotechnol Equip. 2018;32:815–829.
- Jiang Y, Liu X, Xiang W, et al. Genetic diversity and structure analysis of the endangered plant species Horsfieldia hainanensis Merr. in China. Biotechnol Biotechnol Equip. 2017;32:95–101.
- Erfani-Moghadam J, Zarei A. Assessment of genetic structure among different pear species (Pyrus spp.) using apple-derived SSR and evidence of duplications in the pear genome. Biotechnol Biotechnol Equip. 2018;32:591–601.
- Guan FC, Wang C, Quan H, et al. Investigation and taxonomy of wild pedunculate herpetospermum species distributed in Tibet. Southwest China J Agric Sci. 2011;24:832–834.
- Li C, Shimono A, Shen HH, et al. Phylogeography of Potentilla fruticosa, an alpine shrub on the Qinghai-Tibetan plateau. J Plant Ecol. 2010;3:9–15.