
 ?Mathematical formulae have been encoded as MathML and are displayed in this HTML version using MathJax in order to improve their display. Uncheck the box to turn MathJax off. This feature requires Javascript. Click on a formula to zoom.
Abstract
This study investigated the possible hepato- and neuroprotective effects of flavoalkaloids and flavonoids isolated from Astragalus monspessulanus ssp. monspessulanus and ssp. illyricus. Rat hepatocytes obtained by in situ two-stepp collagenase perfusion, and rat brain synaptosomes obtained by multiple centrifugation and Percoll gradient were used. Administered alone, on hepatocytes, all of the compounds increased statistically significantly the lactate dehydrogenase (LDH) activity and malondialdehyde (MDA) production and decreased the reduced glutathione (GSH) level, compared to the control (non-treated hepatocytes). Some of the compounds (1–7) had lower toxicity on the exam parameters than silybin. The main structural features accounting for the lower hepatotoxicity (evaluated by quantitative structure–activity relationship (QSAR) studies) are the increased number of hexoses and the number of aromatic OH groups. On the two in vitro toxicity models, all the 13 compounds had statistically significant hepato- and neuroprotective activities. They preserved the hepatocyte and synaptosome viability, as well as the GSH level and decreased the LDH leakage and MDA production. On isolated rat hepatocytes, in tert-butyl hydroperoxide- and on isolated rat synaptosomes, in 6-OH-dopamine-induced oxidative stress, flavoalkaloids and flavonoids isolated from A. monspessulanus ssp. monspessulanus and ssp. illyricus, were effective hepato- and neuroprotectors, as well as antioxidants. The observed higher hepato- and neuroprotective effects of 1, 2, 4, 7 and eight may be assigned to the different substituents present in either the aglycone or the sugar moieties.
Introduction
Flavonoids have been isolated from many species of genus Astragalus and revealed different pharmacological activities as antidiabetic, neuroprotective, antiproliferative, hepatoprotective, antioxidant, radioprotective and others [Citation1]. Flavonoid alkaloids have been found to possess antineoplastic, immunomodulatory and anti-inflammatory effects [Citation2].
Astragalus monspessulanus L. (Fabaceae, Montpellier Milk Vetch) is a clump-forming perennial herb, native to the Iberian Peninsula, France, Switzerland, the Apennine Peninsula, the Balkan Peninsula, Eastern Europe and Northwest Africa. Our previous study of n-butanol extract obtained from aerial parts of A. monspessulanus ssp. monspessulanus showed hepatoprotective and antioxidant activity against in vitro/in vivo CCl4-induced acute liver damage [Citation3]. Phytochemical investigation of the extract resulted in the isolation of a new flavonol tetraglycoside of quercetin, two new flavoalkaloids and eight known flavonoids. In addition, two rare flavonol glycosides of quercetin and kaempferol with unusual hydroxy methyl glutaric acid as a moiety were isolated from A. monspessulanus ssp. illyricus [Citation4].
In a continuation of our ongoing research, in the present study, the flavoalkaloids and flavonoids isolated from A. monspessulanus ssp. monspessulanus and ssp. illyricus were tested for hepato- and neuro-protective effects on different in vitro models (isolated rat hepatocytes and isolated rat brain synaptosomes). Quantitative structure–activity relationship (QSAR) studies were performed in order to identify the main structural features relevant to the hepatotoxicity of the studied compounds, administered alone, on isolated rat hepatocytes.
Materials and methods
Plant material, extraction and isolation of the compounds
The plants were identified by Assoc. Prof. D. Pavlova from the Department of Botany, Faculty of Biology, Sofia University, where voucher specimens have been deposited (A. monspessulanus subsp. monspessulanus, N SO 107533, and A. monspessulanus subsp. illyricus, N SO 107532). Details on the isolation and identification of the compounds were reported previously [Citation4].
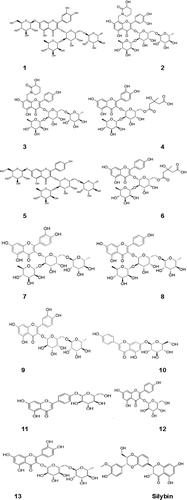
Two flavoalkaloids: N-(8-methylquercetin-3-O-[α-l-rhamnopyranosyl-(1→2)-[α-l-rhamnopyranosyl-(1→6)]-β-d-galactopyranosyl])-3-hydroxy-piperin-2-one (2) N-(8-methylkaempferol-3-O-[α-l-rhamnopyranosyl-(1→2)-[α-l-rhamnopyranosyl-(1→6)]-β-d-galactopyranosyl])-3-hydroxy-piperin-2-one (3), and nine flavonoids: quercetin-3-O-[α-l-rhamnopyranosyl-(1→2)-[α-l-rhamnopyranosyl-(1→6)]-β-d-galactopyranosyl]-7-O-β-d-glucopyranoside (1), alangiflavoside (6), alcesefoliside (7), mauritianin (8), quercetin-3-β-robinobioside (9), cosmosine (10), apigenin-4′-O-glucoside (11), trifolin (12) and rutin (13), were identified in A. monspessulanus subsp. monspessulanus.
Two flavonoids: kaempferol-3-O-α-l-rhamnopyranosyl-(1→2)-[6-O-(3-hydroxy-3-methylglutaryl)-β-d-galactopyranosyl]-7-O-β-d-glucopyranoside (4) and quercetin-3-O-α-l-rhamnopyranosyl-(1→2)-[6-O-(3-hydroxy-3-methylglutaryl)-β-d-galactopyranosyl]-7-O-β-d-glucopyranoside (5), were determined in A. monspessulanus subsp. illyricus. The structures of the compounds were elucidated by nuclear magnetic resonance (NMR) and High-resolution electrospray ionisation mass spectrometry (HRESIMS) data ().
Figure 1. Structures of the studied flavoalkaloids (2–3), flavonoids from A. monspessulanus ssp. monspessulanus (6–13) and A. monspessulanus ssp. illyricus (4–5). Silybin was used as a reference compound.
Functional-metabolic status of isolated rat hepatocytes and rat brain synaptosomes
Chemicals and reagents
The chemicals: HEPES (N-[2-hydroxyethyl]piperazine-N′-[2-ethanesulfonic acid]), NaCl, KCl, d-glucose, NaHCO3, KH2PO4, CaCl2·2H2O, MgSO4·7H2O, d-sucrose, MgCl2·6H2O, NaH2PO4, collagenase from Clostridium histolyticum type IV, albumin, bovine serum fraction V, minimum 98%, ethylene glycol-bis(β-aminoethyl ether)-N,N,N′,N′-tetraacetic acid (EGTA), 2-thiobarbituric acid, trichloroacetic acid, 2,2′-dinitro-5,5′-dithiodibenzoic acid (DTNB), tert-butyl hydroperoxide (t-BuOOH), trypan blue, (3-(4,5)-dimethylthiazol-2-yl)-2,5-diphenyl tetrazolium bromide (MTT), were from Sigma Aldrich (Germany). Other chemicals used: pentobarbital sodium was from Sanofi (France); lactate dehydrogenase (LDH) kit was from Randox (UK).
Experimental animals
Animals were purchased from the National Breeding Centre, Sofia, Bulgaria. At least 7 days of acclimatization were allowed before the commencement of the study. The experiments were carried out: on young (1- to 1.5-year) and on old (2- to 2.5-year) male Wistar rats housed in plexiglass cages (three per cage) in a 12/12 light/dark cycle, under standard laboratory conditions (ambient temperature 20 °C ± 2 °C and humidity 72% ± 4%) with free access to water and standard pelleted rat food 53-3, produced according ISO 9001:2008. The vivarium (No. 0072/01.08.2007) was inspected by the Bulgarian Drug Agency in order to check the husbandry conditions (No. A-11-1081/03.11.2011).
Ethics statement
All performed procedures were approved by the Institutional Animal Care Committee and performed according to Ordinance No. 15/2006 on the Minimum Requirements for the Protection and Welfare of Experimental Animals and Requirements for the Use, Rearing and/or Transportation of Animals (No. 74/03.02.2012).
Treatment
To investigate the independent effects of the studied flavoalkaloids and flavonoids on isolated rat hepatocytes, hepatocytes were incubated with three serial dilutions of each individual compound: 1, 10 and 100 µmol/L for 1 h [Citation5]. Two in vitro toxicity models: 75 µmol tert-butyl hydroperoxide [Citation6] for hepatocytes and 150 µmol 6-hydroxydopamine (6-OHDA) for synaptosomes [Citation5] were used in our experiments. In these toxicity models, the studied flavoalkaloids and flavonoids were at a concentration of 100 µmol/L.
Isolation of hepatocytes
An optimized in situ liver perfusion using less reagents and shorter time of cell isolation was performed. The method provided a high amount of live and metabolically active hepatocytes [Citation5].
After partial catheterization, the liver was perfused with HEPES buffer (pH = 7.85) + 0.6 mmol/L ethylenediaminetetraacetic acid (EDTA) (pH = 7.85), followed by pure HEPES buffer (pH = 7.85) and finally HEPES buffer containing collagenase type IV (50 mg/200 mL) and 7 mmol/L CaCl2 (pH = 7.85). The liver was excised, minced into small pieces, and hepatocytes were dispersed in Krebs–Ringer-bicarbonate (KRB) buffer (pH = 7.35) + 1% bovine serum albumin.
Cells were counted under a light microscope and the viability was assessed by Trypan blue exclusion (0.05%). Initial viability averaged 89%.
Cells were diluted with KRB to make a suspension of about 3 × 10⁶ hepatocytes/mL. Incubations were carried out in flasks containing 3 mL of the cell suspension (i.e. 9 × 10⁶ hepatocytes) and were performed in a 5% CO2 + 95% O2 atmosphere.
Biochemical parameters in isolated hepatocytes
Lactate dehydrogenase (LDH) release, reduced glutathione (GSH) depletion and malondialdehyde (MDA) production were measured spectrophotometrically as previously described [Citation5].
Lactate dehydrogenase (LDH) release
After incubation, the hepatocytes were centrifuged for 4 min at 550 g and the supernatant was used for measurements of LDH release spectrophotometrically by a LDH kit. The potential cytotoxic activity of the compounds was assessed as half maximal effective concentration (EC50), which is defined as the concentration of the compound causing 50% of the maximal LDH activity released by silybin.
Reduced glutathione (GSH) depletion
At the end of the incubation, isolated rat hepatocytes were centrifuged (at 4 °C) and the pellet was used for evaluation of the level of intracellular GSH. It was assessed by measurement of non-protein sulfhydryls after precipitation of proteins with trichloroacetic acid (TCA), followed by measurement of thiols in the supernatant with DTNB. The absorbance was measured at 412 nm. The GSH levels (%) were assessed at a concentration of 100 μmol/L of each studied compound.
Malondialdehyde (MDA) assay
After incubation, 1 mL of hepatocyte suspension was taken and added to 0.67 mL of 20% (w/v) TCA. After centrifugation, 1 mL of the supernatant was added to 0.33 mL of 0.67% (w/v) 2-thiobarbituric acid (TBA) and heated at 100 °C for 30 min. The absorbance was measured at 535 nm, and the amount of TBA-reactants was calculated using a molar extinction coefficient of MDA 1.56 × 10⁵ L/(mol cm). The MDA production was assessed as EC50, defined as the concentration of the compound causing 50% of the maximal MDA production of silybin.
Isolation of brain synaptosomes
Synaptosomes were prepared from brains from old male Wistar rats, as previously described by Taupin et al. [Citation7], using Percoll gradient.
Two types of buffers were prepared: Buffer A: HEPES 5 mmol/L and Sucrose 0.32 mol/L; Buffer B: NaCl 290 mmol/L, MgCl2·2H2O 0.95 mmol/L, KCl 10 mmol/L, CaCl2·2H2O 2.4 mmol/L, NaH2PO4 2.1 mmol/L, HEPES 44 mmol/L, d-Glucose 13 mmol/L. Brain homogenates were prepared with buffer A and centrifuged at 1000g for 10 min at 4 °C. After centrifugation, the supernatants were removed and centrifuged again under the above-mentioned conditions. Supernatants were taken and subjected to centrifugation three times at 10,000g for 20 min at 4 °C. The last two centrifugations were for purification of the synaptosomes.
Isolation of synaptosomes was performed with the help of a colloidal silicon solution (Percoll). A 90% stock solution of Percoll was used. Percoll solutions of two concentrations, 16% and 10%, were prepared. Then 4 mL of Percoll 16% and 10% were added in test-tubes and 90% Percoll (7.5% Percoll) was added to the sediment from the last centrifugation. The tubes were centrifuged for 20 min at 15,000g at 4 °C. After centrifugation, three layers were formed in the tubes. The middle layer of each tube was harvested and buffer B with glucose was added. The mixture was centrifuged at 10,000g for 20 min at 4 °C. After centrifugation, the sediment with the synaptosomes was mixed with buffer B with glucose.
The synaptosomal protein content was determined according to the method of Lowry et al. [Citation8], using serum albumin as a standard.
Biochemical parameters in isolated synaptosomes
Synaptosome viability was measured by MTT-test as described by Mungarro-Menchaca et al. [Citation9], and glutathione level in synaptosomes, by the method described by Robyt et al. [Citation10].
After the incubation with the tested compounds and 6-OHDA for 1 h, the synaptosomes were centrifuged three times at 15,000 g for 1 min. MTT-test was performed to determine synaptosomal vitality.
Reduced glutathione
The level of reduced glutathione was determined by measuring the non-protein SH-groups after precipitation of the proteins with trichloroacetic acid. After the incubation, synaptosomes were centrifuged at 400 g for 3 min. The sediment was treated with 5% trichloroacetic acid and left for 10 min on ice. Samples were centrifuged at 8000 g for 10 min (2 °C). The supernatant was removed to determine the level of GSH and was stored at −20 °C. Immediately before the measurement, the samples were neutralized with 5 mol/L NaOH. The presence of thiols in the supernatant was determined using Elmman reagent. The resulting yellow colour was measured spectrophotometrically (λ = 412 nm).
Statistical analysis
Statistical analysis was performed using statistical program MEDCALC. Results are expressed as mean values with standard error of the mean (±SEM) for six experiments. The significance of the data was assessed using the non-parametric Mann–Whitney test. Values of p < 0.05; p < 0.01 and p < 0.001 were considered as statistically significant. Three parallel samples were used.
QSAR protocol
The chemical structures of the studied compounds were described by 50 descriptors divided in five groups: atom-type E-state indices, atom-type E-state accounts, molecular properties (logP, molecular weight, number of elements, number of rings, number of hydrogen-bond donor and acceptors, etc.), 3 D descriptors (dipole, polarizability, surface, volume, etc.) and user defined (number of hexoses and number of aromatic OH groups). The relevant descriptors were selected by genetic algorithm (GA) at the following settings: size of initial population 32, tournament selection, uniform crossover, one-point mutation, Friedman’s lack-of-fit scoring function with parameter 2. All possible subset regressions among the selected descriptors were calculated and only models with r2 (goodness of fit) ≥0.Six and q2 (leave-one-out cross validation coefficient) ≥0.4 were considered. To check the validity of the selected descriptor set, 100 randomizations of the dependent variable among the compounds were carried out and values were calculated for each regression. If the mean value of
is lower than r2, the selected descriptor set was considered as valid.
Results and discussion
Administered alone, the tested compounds showed statistically significant, concentration-dependent hepatotoxic effects, similar to those of silybin (). All of the compounds increased the LDH activity and MDA production and decreased the GSH level statistically significantly, compared to the control (non-treated hepatocytes). Some of the compounds (1–7) had lower toxicity on the examined parameters than the effects of silybin. We suggest that the tested compounds had independent metabolism and possibly formed toxic metabolites which damaged the cells.
Table 1. Effects of compounds 1–13 and Silybin (S) (at concentrations 1, 10 and 100 µmol/L) administered alone on isolated rat hepatocytes.
The results from QSAR on the hepatotoxicity of the studied compounds are given in . The EC50 values are presented in p-units (−log). Lower pEC50 values correspond to lower cytotoxicity. The pEC50 values for LDH activity were very similar and ranged from 4.726 to 5.018. All of them were lower than the pEC50 5.021 of silybin. The pEC50s for MDA production were between 6.082 and 7.434 and also were less than the pEC50 7.533 of silybin. The GSH levels measured at a concentration of 100 μmol/L of the studied compounds varied from 60% to 80%; in comparison, the same concentration of silybin gave 60% GSH. All tests showed that the studied flavoalkaloids and flavonoids were less hepatotoxic than silybin.
Table 2. Hepatotoxic activitiesTable Footnote* and relevant descriptors of the studied compounds.
QSAR on LDH activity
The best QSAR model for LDH activity was derived after GA-based variable selection and all possible subset regressions are given below:
The descriptor SaasC_acnt accounts for the number of aromatic carbon atoms bound to non-hydrogens. Their number varies between 8 and 6. The presence of a second aromatic OH group increases the value of SaasC_acnt. The negative coefficient indicates that the higher number of such carbons corresponds to lower hepatotoxicity. The value of the kappa shape molecular flexibility descriptor phia is decreased by increased cyclicity/branching and is increased with homologation. Greater molecular flexibility is indicated by larger values of phia. In our case, phia highly correlated with the molecular weights of the compounds (r = 0.994). The negative coefficient indicates an inverse relationship with pEC50 (LDH): higher values for phia (bigger molecules) corresponded to lower hepatotoxicity.
QSAR on MDA production
The best QSAR model for MDA production was:
The descriptor log p accounts for the lipophilicity of compounds. The lipophilicity of the studied flavonoids increased as the number of hexoses decreases. The positive regression coefficient for log p means that the compounds that are more lipophilic are highly hepatotoxic. The descriptor SaasC is a sum of the E-state values of aromatic carbon atoms bound to non-hydrogens. More such atoms in the molecule correspond to more negative value of SaasC. The positive coefficient means that molecules with a greater number of aromatic carbon atoms bound to non-hydrogens had lower hepatotoxicity. This relationship is in a good agreement with the one found for LDH activity.
QSAR on GSH levels
The best QSAR model accounting for the GSH levels was as follows:
The descriptor SaasC_acnt is relevant for the GSH levels. The positive coefficient here indicates that the increased number of aromatic carbon atoms bound to non-hydrogens gave lower hepatotoxicity. Again, this relationship is in good agreement with the conclusions made for LDH activity and MDA production.
In conclusion, the structure–activity relationships for the studied flavoalkaloids and flavonoids showed that these compounds were less hepatotoxic than silybin. The main structural features accounting for the lower hepatotoxicity are the number of hexoses and the number of aromatic OH groups. The increased number of hexoses and aromatic OH groups has a low hepatotoxic effect.
Effects of flavoalkaloids and flavonoids on t-BuOOH-induced oxidative stress in isolated rat hepatocytes
Oxidative damage is widely recognized as being involved in the development of many pathological conditions. As a widely used pro-oxidant, tert-butyl hydroperoxide (t-BuOOH) has been associated with many effects on cell metabolism, e.g. changes in calcium homeostasis, increase of lipid peroxidation and decrease of mitochondrial membrane potential [Citation11].
The parameters (LDH activity, MDA level and GSH depletion) determined in the model of t-BuOOH-induced oxidative stress are presented in . Hepatocytes incubation with 75 µmol/L t-BuOOH resulted in a statistically significant increased LDH activity by 544% (p < 0.001), increased lipid peroxidation (MDA) by 191% (p < 0.001) and depletion of cell GSH by 74% (p < 0.001), compared to the control (non-treated hepatocytes). In combination with t-BuOOH, the studied compounds (100 µmol/L) caused a statistically significant reduction in the damage induced by the hepatotoxic agent.
Figure 2. Effects of compounds 1–13 (at concentration 100 µmol/L), on LDH leakage, in t-BuOOH-induced oxidative stress (at concentration 75 µmol/L) in isolated rat hepatocytes. Each symbol indicates the mean ± SEM of six experiments. Statistically significant differences: ***p < 0.001 vs. control (non-treated hepatocytes); ++p < 0.01; +++p < 0.001 vs. t-BuOOH.
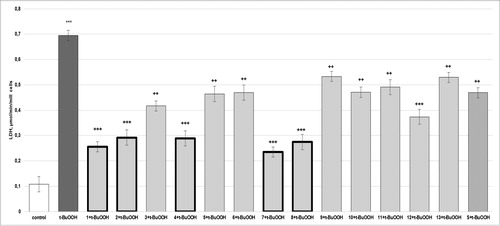
Figure 3. Effects of compounds 1–13 (at concentration 100 µmol/L), on GSH level, in t-BuOOH-induced oxidative stress (at concentration 75 µmol/L) in isolated rat hepatocytes. Each symbol indicates the mean ± SEM of six experiments. Statistically significant differences: ***p < 0.001 vs. control (non-treated hepatocytes); ++p < 0.01; +++p < 0.001 vs. t-BuOOH.
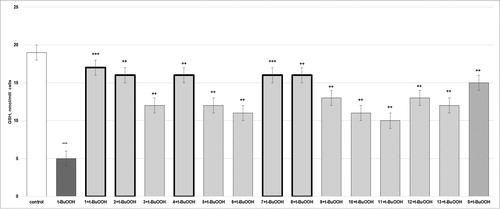
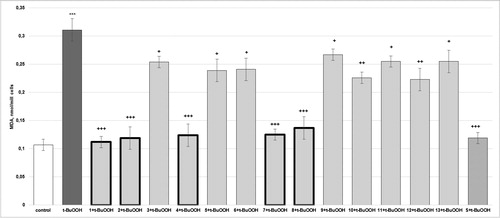
Figure 4. Effects of compounds 1–13 (at concentration 100 µmol/L), on MDA production, in t-BuOOH-induced oxidative stress (at concentration 75 µmol/L) in isolated rat hepatocytes. Each symbol indicates the mean ± SEM of six experiments. Statistically significant differences: ***p < 0.001 vs. control (non-treated hepatocytes); +p < 0.05; ++ p < 0.01; +++ p < 0.001 vs. t-BuOOH.
The release of LDH was decreased by 1 with 63% (p < 0.001); by 2 and 4 with 58% (p < 0.001); by 3 with 40% (p < 0.01); by 5 with 33% (p < 0.01); by 6 and 10 with 32% (p < 0.01); by 7 with 66% (p < 0.001); by 8 with 60% (p < 0.001); by 9 with 23% (p < 0.01); by 11 with 29% (p < 0.01); by 12 with 46% (p < 0.001) and by 13 with 24% (p < 0.01), compared to the t-BuOOH group. Silybin decreased LDH activity by 33% (p < 0.01), compared to the t-BuOOH group ().
Compound one prevented t-BuOOH-induced GSH depletion: the GSH level was increased by 240% (p < 0.001) in the group treated with compound 1 and t-BuOOH compared to the t-BuOOH group. Compounds 2, 4, 7 and 8 also caused an increase in the GSH level, by 220% (p < 0.01; p < 0.001); 3, 5 and 13, by 140% (p < 0.01); 6 and 10, by 120% (p < 0.01); 9 and 12, by 160% (p < 0.01); and 11, by 100% (p < 0.01), as compared to the t-BuOOH group. Silybin prevented GSH depletion: the GSH level was increased by 200% (p < 0.01) in the group treated with silybin and t-BuOOH compared to that in the t-BuOOH group ().
The production of MDA was significantly decreased by 1 with 64% (p < 0.001); by 2 with 62% (p < 0.001); by 3, 11 and 13 with 18% (p < 0.05); by 4 and 7 with 60% (p < 0.001); by 5 and 6 with 23% (p < 0.05); by 8 with 56% (p < 0.001); by 9 with 14% (p < 0.05); by 10 with 27% (p < 0.01) and by 12 with 28% (p < 0.01), compared to the t-BuOOH group. Silybin decreased MDA production by 62% (p < 0.001), compared to the t-BuOOH group ().
Two mechanisms for t-BuOOH action have been proposed: depletion of GSH cellular stores and oxidation of functionally important SH groups on mitochondrial enzymes, and/or changes of mitochondrial membrane integrity induced by peroxidation of membrane lipids [Citation11]. The results from the present study showed that, in the model of t-BuOOH-induced oxidative stress, compounds 1, 2, 4, 7 and 8 had stronger effects than those of silybin. The effects of the other compounds were similar to those of silybin. There are data that silybin inactivates human CYP3A4 and CYP2C9, as well as the main liver glucuronosyltransferases [Citation12].
It is known that flavonoids scavenge reactive oxygen species (ROS) by reacting with the radical. The flavonoid is oxidized and the ROS is reduced as an outcome of this interaction [Citation13].
According to the literature data about the effects of silybin on some drug-metabolizing enzyme systems from first and second phase of biotransformation, we can suggest that the cytoprotective effects of flavoalkaloids and flavonoids on t-BuOOH-induced oxidative stress were possibly related to: their activity as scavengers of ROS on one hand, and possible activity as inhibitors of some CYP isoforms, playing a role in the metabolism of t-BuOOH, on the other.
Effects of flavoalkaloids and flavonoids on 6-hydroxydopamine-induced oxidative stress in isolated rat brain synaptosomes
The parameters (synaptosomal viability and GSH depletion) determined in the model of 6-hydroxydopamine (6-OHDA)-induced toxicity (a model of oxidative stress) are presented in and . Synaptosome incubation with 150 µmol/L 6-OHDA resulted in a statistically significant decreased synaptosomal viability by 55% (p < 0.001) and depletion of synaptosomal GSH by 62% (p < 0.001), compared to the control (non-treated synaptosomes).
Figure 5. Effects of compounds 1–13 (at concentration 100 µmol/L), on synaptosomal viability, in 6-OHDA-induced oxidative stress (at concentration 150 µmol/L) in isolated rat synaptosomes. Each symbol indicates the mean ± SEM of six experiments. Statistically significant differences: ***p < 0.001 vs. control (non-treated synaptosomes); ++p < 0.01; +++p < 0.001 vs. 6-OHDA.
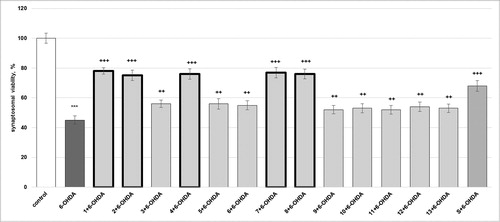
Figure 6. Effects of compounds 1–13 (at concentration 100 µmol/L), on GSH level, in 6-OHDA-induced oxidative stress (at concentration 150 µmol/L) in isolated rat synaptosomes. Each symbol indicates the mean ± SEM of six experiments. Statistically significant differences: *** p < 0.001 vs. control (non-treated synaptosomes); + p < 0.05; ++ p < 0.01; +++ p < 0.001 vs. 6-OHDA.
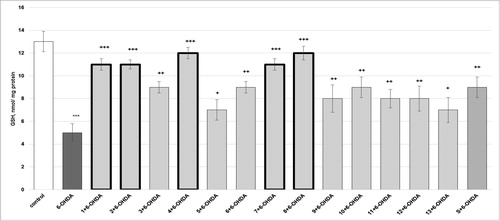
In combination with 6-OHDA, the studied flavoalkaloids and flavonoids caused a statistically significant reduction in the damage induced by the neurotoxic agent.
Compound 1 prevented 6-OHDA-induced decrease of the synaptosomal viability by 73% (p < 0.001); 2 by 67% (p < 0.001); 3 and 5 by 24% (p < 0.01); 4 and 8 by 69% (p < 0.001); 6 by 22% (p < 0.01); 7 by 71% (p < 0.001); 9, 11 and 13 by 16% (p < 0.01); 10 by 18% (p < 0.01) and 12 by 20% (p < 0.01), compared to the 6-OHDA group. Silybin decreased the synaptosomal viability by 51% (p < 0.001), compared to the 6-OHDA group ().
Compounds 1, 2 and 7 prevented 6-OHDA-induced GSH depletion by 120% (p < 0.001); 3, 6 and 10 by 80% (p < 0.01); 4 and 8 by 140% (p < 0.001); 5 and 13 by 40% (p < 0.05); 9, 11 and 12 by 60% (p < 0.01), compared to the 6-OHDA group. Silybin prevented GSH depletion by 80% (p < 0.01), compared to the 6-OHDA group ().
A convenient and reliable in vitro sub-cellular system for the investigation of neurodegenerative-related pathological processes leading to Parkinson’s and Alzheimer’s disease is the treatment of rat brain synaptosomes with 6-OHDA. The underlying mechanism of 6-OHDA neurotoxicity involves the generation of ROS and reactive metabolites, based on its mitochondrial metabolism in nerve cells [Citation14].
In our previous studies, we found that some flavonoids, saponins and saponin mixtures isolated from Astragalus corniculatus and Astragalus hamosus had strong antioxidant and neuroprotective effects on 6-OHDA-induced oxidative stress in isolated rat brain synaptosomes [Citation5, Citation15]. The results from the present study showed that, in the model of 6-OHDA-induced oxidative stress on isolated rat synaptosomes, the compounds 1, 2, 4, 7 and 8 had stronger effects than those of silybin. The effects of the other compounds were similar to those of silybin. We suggest that the neuroprotective and antioxidant effects of the compounds are attributed to their ability to scavenge ROS. Our results correlate with other findings about the neuroprotective effects of different compounds (saponins and flavonoids) isolated from genus Astragalus, on experimental models of neurological disorders [Citation16–18].
Conclusions
This study showed that, on isolated rat hepatocytes, in tert-butyl hydroperoxide- and on isolated rat synaptosomes, in 6-OH-dopamine-induced oxidative stress, flavoalkaloids and flavonoids isolated from A. monspessulanus ssp. monspessulanus and ssp. illyricus, were effective hepato- and neuroprotectors, as well as antioxidants. The observed hepatoprotective effects of 1, 2, 4, 7 and 8 may be attributed to the different substituents present in either the aglycone or the sugar moieties. Flavonoid 1 has a substitution at C-7, flavoalkaloid 2 possess a cyclo-hydroxy-piperidine sidechain at C-8 and compound 4 is a hydroxymethylglutaric acylated sugar chain. These substituents could reduce the overall polarity of the compounds. There were no significant differences observed in the action of the kaempferol derivative 8 and the quercetin derivative 7. This could suggest that kaempferol, theoretically being less polar than quercetin (lacking one OH group in the B ring), is not enough to reduce the compound’s polarity and a further substitution of the aglycone is needed.
Disclosure statement
No potential conflict of interest was reported by the authors.
Additional information
Funding
Related Research Data
References
- Bratkov VM, Shkondrov AM, Zdraveva PK, et al. Flavonoids from the genus Astragalus: phytochemistry and biological activity. Pharmacogn Rev. 2016;10:11–32.
- Khadem S, Marles RJ. Chromone and flavonoid alkaloids: occurrence and bioactivity. Molecules. 2011;17(1):191–206.
- Simeonova R, Bratkov V, Kondeva-Burdina M, et al. Experimental liver protection of n-butanolic extract of Astragalus monspessulanus L. on carbon tetrachloride model of toxicity in rat. Redox Rep. 2015;20(4):145–153.
- Krasteva I, Bratkov V, Bucar F, et al. Flavoalkaloids and flavonoids from Astragalus monspessulanus. J Nat Prod. 2015;78(11):2565–2571.
- Kondeva-Burdina M, Krasteva I, Mitcheva M. Effects of rhamnocitrin 4-β-D-galactopyranoside, isolated from Astragalus hamosus on toxicity models in vitro. Pharmacog Mag. 2014;10:487–493.
- Takayama F, Egashira T, Yamanaka Y. Protective effect of Ninjin-yoei-to on damage to isolated hepatocytes following transient exposure to tert-butyl hydroperoxide. Jpn J Pharmacol. 2001;85(3):227–233.
- Taupin P, Zini S, Cesselin F, et al. Subcellular fractionation on Percoll gradient of mossy fiber synaptosomes: morphological and biochemical characterization in control and degranulated rat hippocampus. J Neurochem. 2008;62(4):1586–1595.
- Lowry OH, Rosebrough NJ, Farr AL, et al. Protein measurement with the Folin phenol reagent. J Biol Chem. 1951;193(1):265–275.
- Mungarro-Menchaca X, Ferrera P, Moran J, et al. Beta-amyloid peptide induces ultrastructural changes in synaptosomes and potentiates mitochondrial dysfunction in the presence of ryanodine. J Neurosci Res. 2002;68(1):89–96.
- Robyt JF, Ackerman RJ, Chittenden CG. Reaction of protein disulfide groups with Ellman's reagent: a case study of the number of sulfhydryl and disulfide groups in Aspergillus oryzae – amylase, papain, and lysozyme. Arch Biochem Biophys. 1971;147(1):262–269.
- Drahota Z, Krivakova P, Cervinkova Z, et al. tert-Butyl hydroperoxide selectively inhibits mitochondrial respiratory-chain enzymes in isolated rat hepatocytes. Physiol Res. 2005;54(1):67–72.
- Sridar C, Goosen TC, Kent UM, et al. Silybin inactivates cytochromes P450 3A4 and 2C9 and inhibits major hepatic glucuronosyltransferases. Drug Metab Dispos. 2004;32(6):587–594.
- Nijveldt RJ, Nood E, Hoorn DEC, et al. Flavonoids: a review of probable mechanisms of action and potential applications. Am J Clin Nutr. 2001;74(4):418–425.
- Stokes AH, Freeman WM, Mitchell SG, et al. Induction of GADD45 and GADD153 in neuroblastoma cells by dopamine-induced toxicity. Neurotoxicology. 2002;23(6):675–684.
- Mitcheva M, Kondeva-Burdina M, Krasteva I, et al. Protective effect of purified saponin mixture from Astragalus corniculatus on toxicity models in vitro In: Tonev S, Kanev K, Dishovsky C, editors. Medical management of chemical and biological casualties. Sofia (S): Publishing House IRITA; 2009. p. 239–251.
- Zhang G, Fang H, Li Y, et al. Neuroprotective effect of Astragalus polysacharin on streptozotocin (STZ)-induced diabetic rats. Med Sci Monit. 2019;25:135–141.
- Hao M, Liu Y, Chen P, et al. Astragaloside IV protects RGC-5 cells against oxidative stress. Neural Regen Res. 2018;13:1081–1086.
- Costa IM, Lima FOV, Fernandes LCB, et al. Astragaloside IV supplementation promotes a neuroprotective effect in experimental models of neurological disorders: a systematic review. Curr Neuropharmacol. 2019;17(7):648–665.