
Abstract
This study aimed to investigate the expression and role of microRNA-449a (miR-449a) in inflammatory bowel disease (IBD) in children, and further to explore the underlying mechanism. To study the role of miR-449a in IBD development, an in vitro inflammatory model of IBD was conducted by stimulating the normal intestinal epithelial cells Caco-2 with 2% dextran sulfate sodium (DSS). The results showed that the miR-449a level was significantly higher in children with IBD than that in children without IBD. Notch1 was a direct target gene of miR-449a. The increased levels of TNF-α, IL-1β and IL-6, reduced cell viability and enhanced cell apoptosis in Caco-2 cells caused by DSS administration were significantly inhibited by miR-449a inhibition. Besides, DSS significantly decreased the level of Notch1, Hes-1, Hey-1 and Bcl-2, and increased Bax expression, and these changes were prevented by miR-449a inhibitor. Importantly, all the effects of miR-449a inhibitor on Caco-2 cells were eliminated by Notch1 gene silencing. In conclusion, the data of our study indicated that miR-449a was up-regulated in IBD in children, and miR-449a inhibitor could inhibit inflammatory response and cell apoptosis by targeting Notch1 in IBD in vitro. The miR-449a/Notch1 axis might be a novel target for IBD treatment.
Introduction
Inflammatory bowel disease (IBD) is a chronic disease that affects the ileum, rectum, colon and even the digestive tract, and it is characterized by chronic or recurrent inflammation of the gastrointestinal tract [Citation1,Citation2]. The main types of IBD are Crohn’s disease (CD), ulcerative colitis (UC) and undefined colitis. Epidemiological surveys have shown that IBD affects approximately 0.5% of the general population and the incidence rate of IBD is 10–30 per 100,000 [Citation3]. In recent years, with the accelerated pace of life, environmental factors, and changes in dietary patterns, the incidence of IBD in Asia, especially in East Asia, has risen steadily year by year, ranking first in Asia, at 3.44 per 100,000 [Citation4,Citation5]. Although its etiology and pathogenesis have not yet been fully understood, it is generally accepted that IBD is a non-specific inflammatory disease caused by autoimmune disorders caused by the induction of environmental factors and the involvement of intestinal microflora in hosts carrying genetic susceptibility genes. Although IBD itself is rarely fatal, it is often incurable due to chronic inflammation and may increase the risk of colorectal cancer.
Almost 25% of IBD patients develop this disease during childhood or adolescence, and the incidence rate is increasing year by year globally. Research in China shows that the incidence of IBD in children has increased from 0.5/106 in 2001 to 6.0/106 in 2010, which has increased 12 times [Citation6]. Very early onset inflammatory bowel disease (VEO-IBD) generally refers to IBD with age of onset <6 years, accounting for 15% of children with IBD; <1 year of onset of IBD called infant IBD accounts for 1% of children with IBD [Citation7]. IBD in children not only shows recurrent abdominal pain, diarrhea and extra-intestinal symptoms, but also causes delayed growth and delayed puberty. Besides, IBD has a long duration and recurrent attacks, causing immense suffering to the children’s body and mind, affecting the quality of life of the children, and at the same time bringing a great economic burden on the children’s families [Citation4]. Meanwhile, due to children’s imperfect development of the nervous system, low tolerance, a strong reaction during treatment, manifested as anxiety, crying, kicking, etc., influence the treatment effect. Therefore, high-quality care for children with IBD is especially important. Studies in recent years have shown that the nursing wisdom model [Citation8] can greatly improve the efficiency of nursing staff, save medical costs, and improve clinical outcomes in patients with IBD [Citation9]. However, so far, the effectiveness of IBD treatment remains unsatisfactory. Therefore, there is an urgent need to seek for novel and effective method for IBD therapy.
Dis-regulation of microRNA (miRNA) expression is involved in various pathophysiological processes [Citation10–13]. In recent years, the role of miRNAs in the pathogenesis and development of IBD and its molecular mechanisms have become hot topics [Citation14–20]. miR-449a has been studied in various diseases. For example, Gupta et al. [Citation21] suggested that miR-449a plays a key role in the regulation of the G2/M cell cycle checkpoint in prostate LNCaP cells under ionizing radiation. Wu et al. [Citation22] reported that miR-449a plays a protective role in osteoarthritis through promoting chondrocyte extracellular matrix degradation. Han et al. [Citation23] found that miR-449a could inhibit silica-induced pulmonary fibrosis through regulating autophagy. However, to the best of our knowledge, the expression and functional role of miR-449a in IBD remains unclear. Thus we conducted this study.
This study aimed to investigate the expression and role of miR-449a in the development of IBD, and further to explore the underlying mechanism.
Materials and methods
Ethics statement
All clinical samples used in this study were approved by each child patient and their guardian. Written informed consent forms were signed by all patients or their legal guardian. The present study was approved by the Ethical Committee of the First Hospital of Jilin University.
Clinical samples
A total of 30 colonic mucosa samples from 30 children with IBD or 30 children without IBD from December 2015 to December 2017 were included in this study. For each patient, colonic regions were sampled and collected by endoscopic lavage.
Cell culture and IBD model establishment
The normal intestinal epithelial cell line Caco-2 was obtained from Cell Biotechnology Co., Ltd (China). Caco-2 cells were grown in RPBM 1640 medium containing 10% fetal calf serum (FBS, Gibco; Thermo Fisher Scientifc, Inc.), 1% streptomycin-penicillin solution (Sigma-Aldrich; Merck KGaA, Darmstadt, Germany), and incubated at 37 °C with 5% CO2.
To establish the IBD inflammatory model in vitro, Caco-2 cells were treated with 2% dextran sulfate sodium (DSS) for 4 days [Citation24].
Cell transfection
For cell transfection, Lipofectamine2000 transfection reagent (Invitrogen) was used. miR-449a inhibitor, the negative control of miR-449a inhibitor (NC), control-siRNA, Notch1-siRNA or miR-449a inhibitor + Notch1-siRNA were transfected into Caco-2 cells by using Lipofectamine2000 transfection reagent (Invitrogen) following the manufacturer’s recommended protocol. Cells were then cultured for 4 days for further analysis.
Apoptosis assay
Caco-2 cells were transfected with miR-449a inhibitor, the negative control of miR-449a inhibitor (NC) or miR-449a inhibitor + Notch1-siRNA and treated with 2% DSS for 4 days. Then the cells from different groups were harvested and then stained with fluorescein (FITC)-conjugated Annexin V and propidium iodide (FITC-Annexin V/PI) (Cat no. 70-AP101-100; MultiSciences, Hangzhou, China) according to the manufacturer’s recommended protocol. Finally, cell apoptosis was analyzed using a FACSCalibur flow cytometer (FCM; BD Biosciences).
MTT assay
After certain treatments, MTT assay was performed to detect cell proliferation ability. Caco-2 cells were seeded into 96-well culture plates and cultured at 37 °C for 24 h. Then we added 20 mg/ml MTT solution (Amresco LLC, Solon, OH, USA) into each culture well and the wells were incubated for another 4 h at 37 °C. Finally, we assessed cell proliferation ability by detecting the optical density (OD) at 570 nm using a SynergyTM2 Multi-function Microplate Reader (Bio-Tek Instruments, Winooski, VT, USA).
Quantitative reverse transcription polymerase chain reaction (qRT-PCR)
Total RNA from cells (Caco-2 cells) and tissues (colonic mucosa samples) was isolated by using TRIZOL reagent (Invitrogen, Carlsbad, CA, USA) as per the manufacturer’s instructions. cDNAs were synthesized by using the TaqMan MicroRNA Reverse Transcription Kit (Applied Biosystems; Thermo Fisher Scientific, Inc.) following the manufacturer’s protocol. Then, we used the SYBR Premix Ex TaqTM II (TliRNaseH Plus) kit (Takara Bio, Inc., Otsu, Japan) to analyze the synthesized cDNAs. Amplification conditions for qPCR were as follows: 95˚C for 5 min, followed by 40 cycles of denaturation at 95˚C for 15 s and annealing/elongation at 60˚C for 30 s. U6 or GAPDH (glyceraldehyde 3-phosphate dehydrogenase) was used as the internal control. The primer sequences used were as follows:
TNF-α-Forward, 5′-GAACTGGCAGAAGAGGCACT-3′
TNF-α-Reverse, 5′-GGTCTGGGCCATAGAACTGA-3′;
IL-1β-Forward, 5′-TGTGAAATGCCACCTTTTGA-3′
IL-1β-Reverse, 5′-TGAGTGATACTGCCTGCCTG-3′;
IL-6-Forward, 5′-CCGGAGAGG AGACTTCACAG-3′;
IL-6-Reverse, 5′-CAGAATTGCCATTGCACA-3′;
miR-449a-Forward, 5′-TGGCGGTGGCAGTGTATTGTTA-3′;
miR-449a-Reverse, 5′-GTGCAGGGTCCGAGGT-3′;
Notch1-Forward: 5′-GAGGCGTGGCAGACTATGC-3′;
Notch1-Reverse: 5′-CTTGTACTCCGTCAGCGTGA-3′;
GAPDH-Forward: 5′-GAAGGTGAAGGTCGGAGTC-3′;
GAPDH-Reverse: 5′-GAAGATGGTGATGGGATTTC-3′;
U6-Forward: 5′-GGAGCGAGATCCCTCCAAAAT-3′;
U6-Reverse: 5′-GGCTGTTGTCATACTTCTCATGG-3′.
All reactions were performed in triplicate. To calculate the relative quantities of each gene, the 2−ΔΔCq method was applied [Citation25].
Western blot assay
The primary antibodies (TNF-α, IL-1β, IL-6, Notch1, Hes-1, Hey-1, Bcl-2, Bax and β-actin) and the horseradish peroxidase-conjugated secondary antibody were obtained from Cell Signaling Technology, Inc. (Danvers, MA, USA). Then we used a BCA protein assay kit (Beyotime, Shanghai, China) to quantify the protein samples following the manufacturer’s protocol. Equal amount of protein samples (25 µg/lane) were separated with 12% sodium dodecylsulfate-polyacrylamide gels and then transferred onto a polyvinylidene fluoride membrane (Millipore, Billerica, MA, USA). After blocking with 5% skim milk, the membranes were incubated overnight at 4 °C with primary antibodies, and then incubated with the secondary antibody at room temperature for 2 h. Finally, to visualize protein blots, SuperSignal™West Pico Chemiluminescent Substrate (Thermo Scientific) was used.
Dual luciferase reporter assay
TargetScan database was used to predict the binding sites between miR-449a and Notch1. To confirm the binding sites between miR-449a and Notch1, dual-luciferase reporter assay was applied. The full-length of Notch1 3’-UTR (untanslated region) sequence was amplified from human cDNA. The wild-type (Notch1-WT) and mutated (Notch1-MUT) 3’-UTR regions of Notch1 were cloned into the Xba I-site of pGL3 (Promega, Madison, WI, USA). Site-directed mutagenesis of the miR-449a target-site in the Notch1 3’-UTR was carried out using QuickChange Lightning Site-Directed Mutagenesis kit (Agilent Technologies, Santa Clara, CA, USA) following the manufacturer’s instructions. Then Caco-2 cells were seeded into a 24-well plate and cultured for 24 h; subsequently, the cells were co-transfected with Notch1-WT or Notch1-MUT and miR-449a mimic or mimic control vector using Lipofectamine® 3000 (Invitrogen, Carlsbad, CA, USA) in accordance with the manufacturer’s protocols. Then, 48 h after cell transfection, luciferase activity was detected using the dual-luciferase assay system (Promega Corporation, Madison, WI, USA) following the manufacturer’s protocol and normalized to Renilla luciferase activity.
Statistical analysis
Data were presented as the mean values with standard deviation (± SD). SPSS 17.0 statistical software (SPSS, Inc., Chicago, IL, United States) was performed for all statistical analysis. Student’s t-test was used to make comparison between two groups. One-way analysis of variance (ANOVA) followed by Tukey’s test was used to make comparison between multiple groups. Differences were considered statistically significant at a level of p < 0.05.
Results and discussion
In the present study, we for the first time identified that miR-449a was up-regulated in children with IBD, and Notch1 was a direct target of miR-449a. Down-regulation of miR-449a inhibited inflammatory response, promoted cell proliferation and reduced cell apoptosis by targeting Notch1 in the IBD cell model. Therefore, the miR-449a/Notch1 axis may be a novel and promising therapeutic target for IBD treatment.
The incidence of IBD has increased significantly over the past 50 years, with children with IBD (age <17 years) accounting for 25% of the total number of IBD patients [Citation26]. However, due to the unknown etiology of IBD, its treatment remains unsatisfactory. Therefore, exploring the potential pathogenesis of IBD and finding new effective treatment strategies have important clinical significance.miRNAs have various functions in the development of many diseases [Citation27]. miR-449a, a well studied miRNA in various types of cancers, participats in various pathological processes [Citation28–33]. However, to the best of our knowledge, the expression and functional role of miR-449a in IBD remains unclear. The present study was conducted to explore the role of miR-449a in the development of IBD, so as to provide more theoretical basis for the treatment of IBD.
miR-449a expression in IBD or DSS-induced caco-2 cells
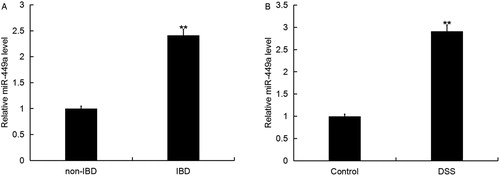
Firstly, we detected the expression of miR-449a in colonic mucosa of children with IBD or non-IBD using qRT-PCR, and we found that the level of miR-449a in the colonic mucosa of children with IBD was significantly higher than that in the colonic mucosa of children with non-IBD (). We also detected the level of miR-449a in the normal intestinal epithelial cells Caco-2 treated with or without DSS, and we found that miR-449a was significantly enhanced in Caco-2 cells treated with DSS ()
Figure 1. Expression of miR-449a in IBD. The expression level of miR-449a in IBD was detected using qRT-PCR. A: Relative miR-449a expression in colonic mucosa of 30 children with IBD or 30 children without IBD (** p < 0.01 vs. non-IBD); B: Relative miR-449a in the normal intestinal epithelial cells Caco-2 treated with or without DSS (**p < 0.01 vs. Control group). Data are displayed as mean values ± SD.
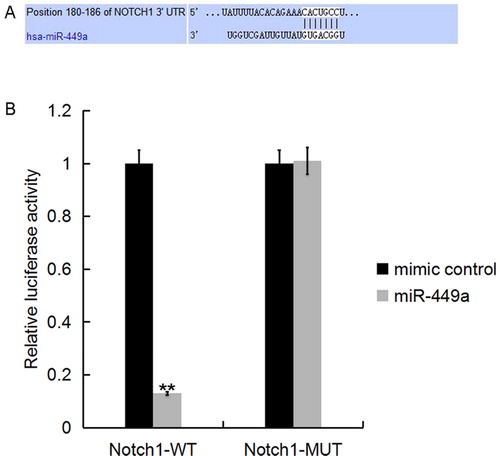
Furthermore, we used the TargetScan database to predict the potential targets of miR-449a, and found that hundreds of genes including Notch1 were promising targets of miR-449a (). As Notch1 plays an important role in the regulation of inflammatory response [Citation34] and cell growth [Citation35,Citation36], we chose Notch1 for further study. To investigate whether miR-449a directly targets Notch1, luciferase reporter assay was performed, and the results indicated that the miR-449a mimic significantly decreased the luciferase activity of Notch1-3’UTR in Caco-2 cells, but had no effect on the mutant form of Notch1-3’UTR (), indicating that Notch1 was a direct target of miR-449a in Caco-2 cells.
Figure 2. Notch1 was a direct target of miR-449a. A: Interaction between miR-449a and 3’UTR of Notch1 was predicted using microRNA target site prediction software; B: Luciferase activity of a reporter containing a wild-type Notch1 3’UTR or a mutant Notch1 3’UTR are presented. “Notch1-MUT” indicates the Notch1 3’UTR with a mutation in the miR-449a binding site. UTR, untranslated region. All data are presented as mean values ± SD of three independent experiments. **p < 0.01 vs. mimic control group.
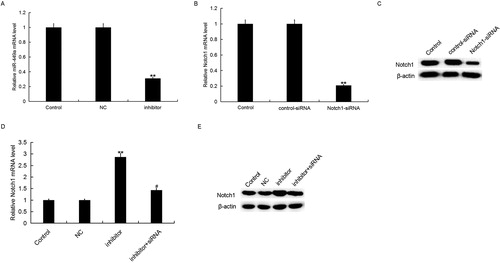
Then, to determine the role of miR-449a in IBD progression, we firstly transfected Caco-2 cells with miR-449a inhibitor, the negative control of miR-449a inhibitor (NC), control-siRNA, Notch1-siRNA or miR-449a inhibitor + Notch1-siRNA for 48 h, and the transfection efficiency was detected using qRT-PCR. As shown in , compared with the control group, the level of miR-449a significantly decreased in miR-449a inhibitor transfected cells. Notch1-siRNA significantly reduced both mRNA and protein levels of Notch1 () in Caco-2 cells. MiR-449a inhibitor significantly increased the mRNA and protein levels of Notch1, and these increases were inhibited by Notch1-siRNA (). These data further verified that miR-449a negatively mediated the levels of Notch1 by targeting the 3’UTR of Notch1 in IBD
Figure 3. miR-449a inhibitor increased Notch1 expression in Caco-2 cells. A: Relative miR-449a expression in Caco-2 cells in different groups; B and D: Relative Notch1 mRNA expression in Caco-2 cells in different groups; C and E: Protein level of Notch1 in Caco-2 cells in different groups. Data are displayed as mean values ± SD. ** p < 0.01 vs. control group; # p < 0.05 vs. inhibitor group.
Effects of miR-449a inhibitor on inflammatory response
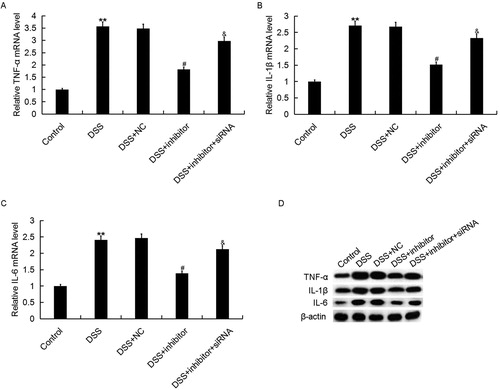
Many studies have confirmed that inflammatory response was involved in the development of IBD [Citation37]. Then we analyzed the effect of miR-449a on inflammatory response in DSS induced IBD cell model. The effect of miR-449a on inflammatory response in IBD was determined by detecting the levels of TNF-α, IL-1β and IL-6. Caco-2 cells were transfected with miR-449a inhibitor, the negative control of miR-449a inhibitor (NC) or miR-449a inhibitor + Notch1-siRNA and treated with 2% DSS for 4 days. Subsequently, the mRNA and protein levels of TNF-α, IL-1β, IL-6 were measured using qRT-PCR and western blot assay respectively. The results showed that compared with the control group, both the mRNA and protein levels of TNF-α, IL-1β and IL-6 in Caco-2 cells were enhanced in DSS treatment group. Moreover, we found that miR-449a inhibitor significantly reduced the expression levels of TNF-α, IL-1β and IL-6 in Caco-2 cells which were increased by DSS, while Notch1-siRNA notably eliminated these reductions (). The data indicated that miR-449a inhibitor may inhibit inflammatory response during IBD.
Figure 4. Effect of miR-449a inhibitor on TNF-α, IL-1β and IL-6 expression in Caco-2 cells. After specific treatment, the mRNA (A–C) and protein (D) level of TNF-α, IL-1β and IL-6 in Caco-2 cells in different groups was detected using qRT-PCR and western blot, respectively. Control: Caco-2 cells without any treatment; DSS: Caco-2 cells were treated with 2% DSS; DSS + NC: Caco-2 cells were treated with 2% DSS and transfected with the negative control of miR-449a inhibitor; DSS + inhibitor: Caco-2 cells were treated with 2% DSS and transfected with miR-449a inhibitor; DSS + inhibitor + siRNA: Caco-2 cells were treated with 2% DSS and co-transfected with miR-449a inhibitor and Notch1-siRNA. Data are displayed as mean values ± SD. **p < 0.01 vs. control group; #p < 0.05 vs. DSS group; &p < 0.05 vs. DSS + inhibitor group.
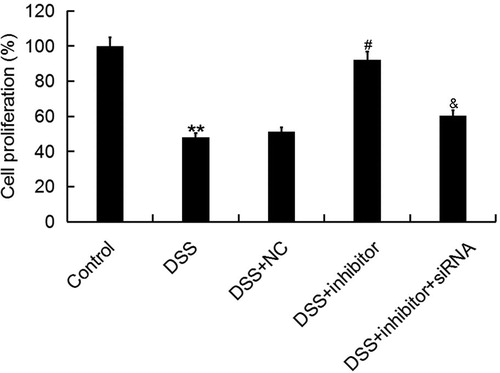
Effects of miR-449a inhibitor on cell proliferation ability and apoptosis
The relationship between cell apoptosis and gastrointestinal diseases and inflammatory reactions is a new area of research in recent years. Abnormal apoptosis is identified in the pathogenesis of IBD, and is affected by many factors. Apoptosis is one of the important mechanisms leading to tissue damage and immune disorders in the pathogenesis of IBD [Citation38]. At present, it is considered that the dysregulation of apoptosis in intestinal mucosa plays a very important role in the pathogenesis of IBD [Citation39,Citation40]. Thus, we investigated the effect of miR-449a on intestinal epithelial cell (Caco-2) proliferation and apoptosis in IBD in vitro. Cell proliferation ability was detected using MTT assay. As expected, our results showed that DSS treatment significantly reduced Caco-2 cell proliferation ability, and this reduction was prevented by miR-449a inhibitor. Meanwhile, we found that the effect of miR-449a inhibitor on Caco-2 cell proliferation ability was reversed by miR-449a inhibitor + Notch1-siRNA co-transfection (). Our results are consistent with other similar reports. Cai et al. [Citation41] found that miR-449a inhibits cell proliferation, migration and inflammation by regulating high-mobility group box protein 1 and forms a mutual inhibition loop with Yin Yang 1 in rheumatoid arthritis fibroblast-like synoviocytesis.
Figure 5. Effect of miR-449a inhibitor on Caco-2 cell proliferation ability. After specific treatment, Caco-2 cell proliferation ability was assessed by using MTT assay. Control: Caco-2 cells without any treatment; DSS: Caco-2 cells were treated with 2% DSS; DSS + NC: Caco-2 cells were treated with 2% DSS and transfected with the negative control of miR-449a inhibitor; DSS + inhibitor: Caco-2 cells were treated with 2% DSS and transfected with miR-449a inhibitor; DSS + inhibitor + siRNA: Caco-2 cells were treated with 2% DSS and co-transfected with miR-449a inhibitor and Notch1-siRNA.Data are displayed as mean values ± SD. **p < 0.01 vs. control group; #p < 0.05 vs. DSS group; &p < 0.05 vs. DSS + inhibitor group.
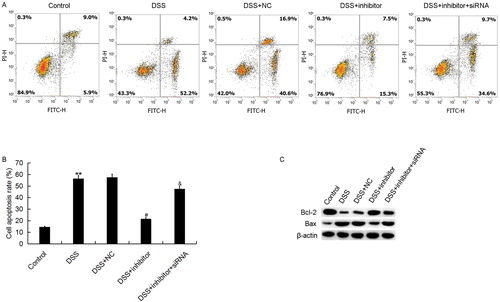
Caco-2 cell apoptosis was also determined in the present study. The results suggested that miR-449a inhibitor significantly reduced Caco-2 cell apoptosis that was increased by DSS treatment. Moreover, we found that the effect of miR-449a inhibitor on Caco-2 cell apoptosis was reversed by Notch1-siRNA (). These results indicated that miR-449a down-regulation significantly reduced the Caco-2 cell apoptosis induced by DSS. At the same time, the cell apoptosis related proteins (Bcl-2 and Bax) were determined in this study. We found that DSS treatment significantly enhanced the pro-apoptotic gene Bax protein expression and reduced the apoptosis suppressor gene Bcl-2 protein expression. These changes were prevented by miR-449a inhibitor. Interestingly, the effects of miR-449a inhibitor on Bcl-2 and Bax protein expression in Caco-2 cells were reversed by Notch1 silencing ().
Figure 6. Effect of miR-449a inhibitor on Caco-2 cell apoptosis. After specific treatment, Caco-2 cell apoptosis (early apoptosis + late apoptosis) was assessed by using FCM assay (A), and the data were analyzed (B). C: protein level of Bcl-2 and Bax in different groups. Control: Caco-2 cells without any treatment; DSS: Caco-2 cells were treated with 2% DSS; DSS + NC: Caco-2 cells were treated with 2% DSS and transfected with the negative control of miR-449a inhibitor; DSS + inhibitor: Caco-2 cells were treated with 2% DSS and transfected with miR-449a inhibitor; DSS + inhibitor + siRNA: Caco-2 cells were treated with 2% DSS and co-transfected with miR-449a inhibitor and Notch1-siRNA.Data were displayed as mean ± SD. **p < 0.01 vs. control group; #p < 0.05 vs. DSS group; &p < 0.05 vs. DSS + inhibitor group.
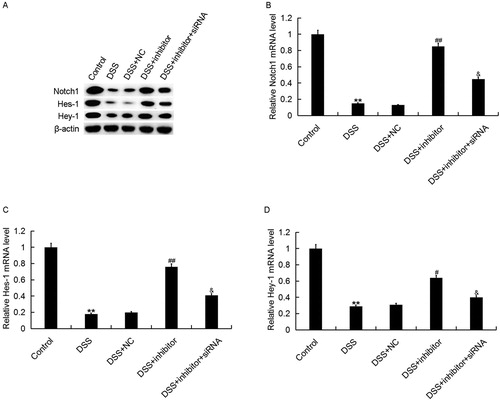
Roles of miR-449a inhibitor in Notch1 pathway
Finally, to explore the molecular mechanism of the effects of miR-449a on Caco-2 cells, the Notch1 pathway was analyzed. Accumulating evidence has verified that Notch1 pathway participates in diseases [Citation42,Citation43]. As shown in , DSS treatment significantly inhibited the expression of Notch1, Hes-1 and Hey-1 at both mRNA and protein levels, and these changes were repressed by miR-449a inhibitor. The effects of miR-449a inhibitor on Notch1, Hes-1 and Hey-1 expression in Caco-2 cells were reversed by Notch1 silencing, indicating that the Notch1 pathway was significantly inhibited in DSS treated Caco-2 cells, and miR-449a inhibition markedly promoted Notch1 pathway activation.
Figure 7. Effect of miR-449a inhibitor on Notch1 pathway in Caco-2 cells. After specific treatment, the protein (A) and mRNA (B–D) level of Notch1, Hes-1 and Hey-1 in Caco-2 cells in different groups was detected using western blot and qRT-PCR, respectively. Control: Caco-2 cells without any treatment; DSS: Caco-2 cells were treated with 2% DSS; DSS + NC: Caco-2 cells were treated with 2% DSS and transfected with the negative control of miR-449a inhibitor; DSS + inhibitor: Caco-2 cells were treated with 2% DSS and transfected with miR-449a inhibitor; DSS + inhibitor + siRNA: Caco-2 cells were treated with 2% DSS and co-transfected with miR-449a inhibitor and Notch1-siRNA. Data are displayed as mean values ± SD. **p < 0.01 vs. control group; #, ##p < 0.05, 0.01 vs. DSS group; &p < 0.05 vs. DSS + inhibitor group.
Conclusions
This study showed for the first time that miR-449a was up-regulated in children with IBD. miR-449a down-regulation could inhibit inflammatory response and reduce cell apoptosis in intestinal epithelial cells in IBD in vitro by regulating the Notch1 pathway. Therefore, miR-449a may be a novel and promising therapeutic target for the treatment of IBD. However, further research is required to confirm the role of miR-449a in IBD. For instance, the correlation of miR-449a expression with the clinical characteristics and prognosis in IBD children need to be studied. Besides, the expression and role of miR-449a in adults with IBD needed to be further investigated. Moreover, the in vitro model of IBD is significantly different from IBD in humans, so more in vivo experiments and clinical studies are needed to prove the role of miR-449a in IBD. We will conduct in-depth research on these issues in the future.
Acknowledgment
The authors are thankful to Wu Lan, the deputy chief physician, and attending doctor Pang Xiaoli, Dr. Huang Xinxing and Dr. Lv Xintong of The First Hospital of Jilin University, the Pediatric Gastrointestinal Department, for their guidance and help in the study and writing process.
Disclosure statement
No potential conflict of interest was reported by the author(s).
References
- Wehkamp J, Götz M, Herrlinger K, et al. Inflammatory bowel disease. Dtsch Arztebl Int. 2016;113(5):72–82.
- Engel MA, Khalil M, Neurath MF. Highlights in inflammatory bowel disease-from bench to bedside. Clin Chem Lab Med. 2012;50(7):1229–1235.
- Kaplan GG. The global burden of IBD: from 2015 to 2025. Nat Rev Gastroenterol Hepatol. 2015;12(12):720–727.
- Ng SC, Tang W, Ching JY, et al. Incidence and phenotype of inflammatory bowel disease based on results from the Asia-pacific Crohn’ s and colitis epidemiology study. Gastroenterology 2013;145(1):158–165.e2.
- Ng WK, Wong SH, Ng SC. Changing epidemiological trends of inflammatory bowel disease in Asia. Intest Res. 2016;14(2):111–119.
- Want XQ, Zhan BY, Xu CD, et al. Inflammatory bowel disease in Chinese children. Intest Res 2016;14(2):111–119.
- Hevman MB, Iirschner BS, Gold BD, et al. Children with early onset inllammatoxy bowel disease (IBD): analysis of a pediatric IBD consortium registry. J Pediatr. 2005;146(1):35–40.
- Matney SA, Avant K, Staggers N. Toward an understanding of wisdom in nursing. Online J Issues Nurs. 2015;21(1):9. DOI: 10.1016/j.jpeds.2004.08.043.
- Luo D, Lin Z. Research progress on wisdom nursing model in nursing intervention of inflammatory bowel disease. Chin Nurs Res 2017;31:3767–3772.
- Hammond SM. An overview of microRNAs. Adv Drug Deliv Rev. 2015;87:3–14.
- Soifer HS, Rossi JJ, Saetrom P. MicroRNAs in disease and potential therapeutic applications. Mol Ther. 2007;15(12):2070–2079.
- Krol J, Loedige I, Filipowicz W. The widespread regulation of microRNA biogenesis, function and decay. Nat Rev Genet. 2010;11(9):597–610.
- O’Connell RM, Rao DS, Chaudhuri AA. Physiological and pathological roles for microRNAs in the immune system. Nat Rev Immunol. 2010;10(2):111–122.
- Ghorpade DS, Sinha AY, Holla S, et al. NOD2-nitric oxide-responsive microRNA-146a activates Sonic hedgehog signaling to orchestrate inflammatory responses in murine model of inflammatory bowel disease. J Biol Chem. 2013;288(46):33037–33048.
- Maharshak N, Shenhar-Tsarfaty S, Aroyo N, et al. MicroRNA-132 modulates cholinergic signaling and inflammation in human inflammatory bowel disease. Inflamm Bowel Dis. 2013;19(7):1346–1353.
- Olaru AV, Yamanaka S, Vazquez C, et al. MicroRNA-224 negatively regulates p21 expression during late neoplastic progression in inflammatory bowel disease. Inflamm Bowel Dis. 2013;19(3):471–480.
- Schönauen K, Le N, von Arnim U, et al. Circulating and fecal microRNAs as biomarkers for inflammatory bowel diseases. Inflamm Bowel Dis. 2018;24(7):1547–1557.
- De Iudicibus S, Lucafò M, Vitulo N, et al. High-throughput sequencing of microRNAs in glucocorticoid sensitive paediatric inflammatory bowel disease patients. Int J Mol Sci 2018;19(5):1399.
- Whiteoak SR, Felwick R, Sanchez-Elsner T, et al. MicroRNAs in inflammatory bowel diseases: paradoxes and possibilities. Inflamm Bowel Dis. 2015;21(5):1160–1165.
- Mohammadi A, Kelly OB, Filice M, et al. Differential expression of microRNAs in peripheral blood mononuclear cells identifies autophagy and TGF-beta-related signatures aberrantly expressed in inflammatory bowel disease. J Crohns Colitis. 2018;12(5):568–581.
- Gupta S, Silveira DA, Mombach J. Modeling the role of microRNA-449a in the regulation of the G2/M cell cycle checkpoint in prostate LNCaP cells under ionizing radiation. PLoS One. 2018;13(7):e0200768.
- Wu J, Zou M, Ping A, et al. MicroRNA-449a upregulation promotes chondrocyte extracellular matrix degradation in osteoarthritis. Biomed Pharmacother. 2018;105:940–946.
- Han R, Ji X, Rong R, et al. MiR-449a regulates autophagy to inhibit silica-induced pulmonary fibrosis through targeting Bcl2. J Mol Med. 2016;94(11):1267–1279.
- Nighot P, Young K, Nighot M, et al. Chloride channel ClC-2 is a key factor in the development of DSS-induced murine colitis. Inflamm Bowel Dis. 2013;19(13):2867–2877.
- Livak KJ, Schmittgen TD. Analysis of relative gene expression data using real-time quantitative PCR and the 2(-Delta Delta C(T)) Method. Methods 2001;25(4):402–408.
- Levine A, Griffiths A, Markowitz J, et al. Pediatric modification of the Montreal classification for inflammatory bowel disease: the Paris classification. Inflamm Bowel Dis. 2011;17(6):1314–1321.
- Liu X, Chen J, Guan T, et al. Correction to: miRNAs and target genes in the blood as biomarkers for the early diagnosis of Parkinson’s disease. BMC Syst Biol. 2019;13(1):20.
- He YM, Ji AJ, Xu XY, et al. miR-449a: a potential therapeutic agent for cancer. Anticancer Drugs 2017;28(10):1067–1078.
- Chen W, Liu Y, Chen H, et al. Loss of miR-449a-caused PrLZ overexpression promotes prostate cancer metastasis. Int J Oncol. 2017;51(2):435–444.
- Li L, Liu H, Du L, et al. MiR-449a suppresses LDHA-mediated glycolysis to enhance the sensitivity of non-small cell lung cancer cells to ionizing radiation. Oncol Res. 2018;26(4):547–556.
- Li F, Liang J, Bai L. MicroRNA-449a functions as a tumor suppressor in pancreatic cancer by the epigenetic regulation of ATDC expression. Biomed Pharmacother. 2018;103:782–789.
- Xu B, Zhang X, Wang S, et al. MiR-449a suppresses cell migration and invasion by targeting PLAGL2 in breast cancer. Pathol Res Pract. 2018;214(5):790–795.
- Zhang C, Ma C, Zhang L, et al. MiR-449a-5p mediates mitochondrial dysfunction and phenotypic transition by targeting Myc in pulmonary arterial smooth muscle cells. J Mol Med. 2019;97(3):409–422.
- Zeng Q, Jin C, Ao L, et al. Cross-talk between the Toll-like receptor 4 and Notch1 pathways augments the inflammatory response in the interstitial cells of stenotic human aortic valves. Circulation 2012;126(11_suppl_1):S222–S230.
- Tohda S. NOTCH signaling roles in acute myeloid leukemia cell growth and interaction with other stemness-related signals. Anticancer Res. 2014;34(11):6259–6264.
- Guo D, Li C, Teng Q, et al. Notch1 overexpression promotes cell growth and tumor angiogenesis in myeloma. Neoplasma 2012;60(01):33–40.
- Liu R, Tang A, Wang X, et al. Inhibition of lncRNA NEAT1 suppresses the inflammatory response in IBD by modulating the intestinal epithelial barrier and by exosome-mediated polarization of macrophages. J Mol Med 2018;42(5):2903–2913.
- Kruse ML, Friedrich M, Arlt A, et al. Colonic lamina propria inflammatory cells from patients with IBD induce the nuclear factor-E2 related factor-2 thereby leading to greater proteasome activity and apoptosis protection in human colonocytes. Inflamm Bowel Dis. 2016;22(11):2593–2606.
- Li M, Zhang S, Qiu Y, et al. Upregulation of miR-665 promotes apoptosis and colitis in inflammatory bowel disease by repressing the endoplasmic reticulum stress components XBP1 and ORMDL3. Cell Death Dis. 2017;8(3):e2699–e2699.
- Gu L, Ge Z, Wang Y, et al. Activating transcription factor 3 promotes intestinal epithelial cell apoptosis in Crohn’s disease. Pathol Res Pract. 2018;214(6):862–870.
- Cai Y, Jiang C, Zhu J, et al. miR-449a inhibits cell proliferation, migration, and inflammation by regulating high-mobility group box protein 1 and forms a mutual inhibition loop with Yin Yang 1 in rheumatoid arthritis fibroblast-like synoviocytes. Arthritis Res Ther. 2019; 21(1):134.
- Zong D, Li J, Cai S, et al. Notch1 regulates endothelial apoptosis via the ERK pathway in chronic obstructive pulmonary disease. Am J Physiol Cell Physiol. 2018;315(3):C330–C340.
- Zhao NJ, Liao MJ, Wu JJ, et al. Curcumin suppresses Notch‑1 signaling: improvements in fatty liver and insulin resistance in rats. Mol Med Rep. 2018;17(1):819–826.