
Abstract
Rutin (Vitamin P1) is an antioxidant and anti-inflammatory flavonoid. This study examined the effect of rutin on the potential of cisplatin to cause oxidative and proinflammatory damage in blood serum, ureter, bladder and urethra in rats. Animals were divided into four groups: (i) healthy (HG), (ii) 50 mg/kg of rutin + 5 mg/kg of cisplatin (C + R50), (iii) 100 mg/kg of rutin + 5 mg/kg of cisplatin (C + R100) and (iv) only cisplatin (CG). Rutin and distilled water were applied once a day for eight days. Cisplatin was injected intraperitoneally at a dose of 5 mg/kg for eight days, once every two days. Finally, animals were sacrificed by high -dose anesthesia after blood samples were taken. Ureter, bladder and urethra tissues were removed and malondialdehyde (MDA), myeloperoxidase (MPO), total glutathione (tGSH), superoxide dismutase (SOD) interleukin beta (IL-1β) and tumor necrosis factor alpha (TNF-α) levels were measured. The results showed that the levels of MDA, MPO, IL-1β and TNF-α in the blood serum of the CG group increased significantly (p < 0.0001) and the tGSH and SOD levels decreased compared to the HG. Rutin administration reversed the effect as seen in C + R50 and C + R100 groups. However, there was no statistically significant difference in the levels of MDA, MPO, tGSH, SOD, IL-1β and TNF-α in ureter, bladder and urethra tissue (p > 0.05).This suggests that cisplatin produces oxidative stress in the blood serum but not in the ureter, bladder and urethra tissues. It was observed that rutin prevented the cisplatin-related oxidative and proinflammatory damage in the blood serum.
Introduction
Cisplatin (cis-dichlorodiaminplatin II) is a platinum-derived anticancer medicine used in the treatment of many malignant diseases in pediatric and adult patients [Citation1]. On the other hand, cisplatin causes severe side effects in doses showing anticancer activity and leads to the termination of the treatment [Citation2]. Increased production of reactive oxygen species (ROS) and proinflammatory cytokines and the reduction of antioxidant systems have been implicated as responsible for the pathogenesis of cisplatin-related tissue damage.
A study by Turan et al. [Citation3] reported that cisplatin increases the lipid peroxidation in brain tissue, myeloperoxidase (MPO) activity and the level of 8-hydroxyguanine, which is an oxidative DNA damage product, and decreases the levels of antioxidants such as glutathione (tGSH) and superoxide dismutase (SOD). It has also been found that oxidative stress is responsible for cisplatin neurotoxicity [Citation3]. Karakurt et al. [Citation4] have shown that animals with high levels of malondialdehyde (MDA), interleukin 1 beta (IL-1β) and tumor necrosis factor alpha (TNF-α) and low level of total glutathione (tGSH) in the blood serum of the cisplatin group develop severe damage in the retina histopathologically. In recent studies, cisplatin-induced neuropathic pain has been associated with oxidative stress [Citation5]. It has also been documented that cisplatin causes damage to the inner ear tissue with oxidative stress [Citation6]. It has been reported that the oxidative damage caused by cisplatin in the cardiovascular tissue is reduced by an antioxidant drug [Citation7]. Sener et al. [Citation8] have argued that cisplatin causes severe oxidative damage to kidney tissue. Recent studies have shown that oxidant and proinflammatory markers are elevated in the kidney tissue of animals treated with cisplatin, whereas enzymatic and non-enzymatic antioxidants are decreased and cause severe renal dysfunction [Citation9]. It has been expressed that infertility due to oxidative ovary-damage caused by cisplatin would be treated with antioxidant [Citation10]. cisplatin also causes oxidative stress in the lung, liver, stomach and testicle tissues [Citation11–14]. However, there are not many studies regarding whether cisplatin causes oxidative damage on the bladder, ureter and urethra and with reference to the protective effect of rutin against the cisplatin-induced oxidative damage.
Rutin (3,3,4,5,7-pentahydroxyflavone-3-rhamnoglucoside) to be examined in terms of its effect on cisplatin’s prospective oxidative and proinflammatory damage on blood serum, ureter, bladder and urethra is a Vitamin P1 flavonoid [Citation15]. Dietary antioxidants such as flavonoids found in vegetables, fruits and beverages are known to protect the human body against a range of diseases such as cancer, cardiovascular, diabetes, osteoporosis and neurodegenerative disorders [Citation16]. Herbal remedies are the mainstay of 75-80% of the world’s population in developing countries, mainly due to better compatibility with the human body and fewer side effects [Citation17]. It is known that rutin has biological roles such as antioxidant and anti-inflammatory properties, cytokine inhibitionand bronchoalveolar polymorphonuclear granulocyte infiltration inhibition [Citation18, Citation19]. Further studies have shown that rutin suppresses TNF-α and IL-1β production, which are known as proinflammatory. Moreover they have also revealed that the rutin reduces the levels of oxidants such as MDA and MPO and increases the level of tGSH which is an antioxidant [Citation20]. All the data suggested that rutin would be benefical in preventing oxidative and proinflammatory damage related to cisplatin. No data were found regarding the effect of rutin on cisplatin-induced oxidative and proinflammatory damage of bladder, ureter and urethra in the literature review. The aim of the study is to investigate the effect of rutin on cisplatin’s prospective oxidative and proinflammatory damage on blood serum, ureter, bladder and urethra in rats biochemically.
Materials and methods
Animals
Animals were obtained from Ataturk University Medical Experimental Application and Research Center. A total of 24 albino Wistar male rats with the weight ranging between 260-285 g were used in the experiment. The animals were kept and fed in groups in the normal laboratory environment (22 °C) prior to the experiment.
Ethics statement
All stages of our study were carried out in accordance with the Ataturk University Local Animal Experimentation Ethics Committee (Date: 22.11.2018, meeting no: 213/12).
Chemicals
cisplatin CDDP vials (50 mg/100 mL; Cisplatin-Ebewe) were provided by Liba-Turkey, thiopental sodium was supplied from IE Ulagay-Turkey and rutin was obtained from Solgar (USA).
Experiment groups
The experimental animals were divided into four groups: (i) healthy group (HG), (ii) the ones which were only given cisplatin (CG), (iii) the ones which were given 50 mg/kg of rutin + 5 mg/kg of cisplatin (C + R50) and (iv) the ones which were given 100 mg/kg of rutin + 5 mg/kg of cisplatin (C + R100).
Experimentation
In this study, 50 mg/kg of rutin was applied to the C + R50 group (n-6) and 100 mg/kg of rutin was applied to the C + R100 group (n-6). Distilled water as solvent was given to the HG group (n-6) and was applied orally with a catheter. One hour after the application of rutin and distilled water, cisplatin at a dose of 5 mg/kg was injected intraperitoneally to C + R50, C + R100 and CG rat groups in every two days for eight days. Rutin and distilled water were applied once a day for eight days. At the end of this period, blood samples were taken from the tail veins of all of the animals. After the blood samples were taken, the animals were killed with high dose of anesthesia and their ureter, bladder and urethra tissues were removed. MDA, MPO, tGSH, SOD, IL-1β and TNF-α levels were measured in the blood samples and ureter, bladder and urethra tissue samples obtained from the animals. The results of the rutin administered groups were compared with the results of HG and CG groups.
Sample preparation
Blood samples from the rats were collected into separation gel vacutainer serum tubes. All blood samples were incubated for 15 min at room temperature and then serum layers were separated by centrifugation at 1500 g for 15 min. Afterwards, all serum samples were stored at −80 °C until the day of biochemical analysis. Prior to dissection, all tissues were rinsed with phosphate buffered saline solution. The tissues (ureter, bladder and urethra) were homogenized in ice-cold phosphat buffers (50 mM, pH 7,4) which were proper for the variable to be measured. The tissue homogenates were centrifuged at 5,000 rpm for 20 min at 4 °C, and the supernatants were extracted in order to analyze MDA, MPO, tGSH, SOD, IL-1β, TNFα, and protein concentration. The protein concentration of the supernatant was measured using the method described by Bradford. Tissue results were expressed as g protein.
MDA analysis in serum and tissues
MDA measurements were based on the method used by Ohkawa et al., involving spectrophotometrical measurement of absorbance of the pink-colored complex formed by thiobarbituric acid (TBA) and MDA. The serum/tissue-homogenate sample (0.1 mL) was added to a solution containing 0.2 mL of 80 g/L sodium dodesil sulfate, 1.5 mL of 200 g/L acetic acid, 1.5 mL of 8 g/L 2-thiobarbiturate, and 0.3 mL distilled water. The mixture was incubated at 95 °C for 1 h upon cooling and 5 mL of n-butanol: pyridine (15:1) was added. Then, the mixture was vortexed for 1 min and centrifuged for 30 min at 4000 rpm. The absorbance of the supernatant was measured at 532 nm. The Standard curve was obtained by using1,1,3,3- tetramet hoxypropane [Citation21].
MPO analysis in serum and tissue
According to the method defined by Bradley et al. to determine MPO activity in serum/tissue-homogenates, H2O2 in phosphate buffer (50 mM, pH 6) was used as the substrate. Assay buffer was prepared (7,5 mg o-dianisidine-HCl, 5 mL 0.0005% H2O2 in 40 mLphosphate buffer). 20 µL serum/tissue-homogenate was added to 280 µL assay buffer. The MPO activity was kinetically measured at 460 nm for 5 min [Citation22].
tGSH analysis in serum and tissues
According to the method defined by Sedlak and Lindsay. DTNB (5,5’-dithiobis 2-nitrobenzoic acid) disulfide is chromogenic in the medium, and DTNB is reduced easily by sulfhydryl groups. The yellow color produced during the reduction was measured by spectrophotometry at 412 nm. For the measurement, a cocktail solution (5.85 mL 100 mmol/L Na-phosphate buffer, 2.8 mL 1 mmol/L DTNB, 3.75 mL 1 mmol/L NADPH) and 80 µL 625 U/L Glutathione reductase were prepared. Before the measurement, 0.1 mL meta-phosphoric acid was added to 0.1 mL serum/tissue-homogenate and centrifuged for 2 min at 2000 rpm for deproteinization. The 0.15 mL of cocktail solution was added to 50 µL of supernatant. The Standard curve was obtained by using GSSG [Citation23].
SOD activity in serum and tissues
Measurements were performed according to the method described by Sun et al. [Citation24] when xanthine was converted into uric acid by xanthine oxidase. If nitro blue tetrazolium (NBT) was added to this reaction, SOD would react with NBT, producing a purple-colored formazan dye. The measurement mixture, containing 200 μL measurement mixture (0.3 mmol/L xanthine, 0.6 mmol/L EDTA, 150 μmol/L NBT, 0.4 mol/L Na2CO3, 1 mg/mL bovine serum albumin), 20 μL serum and 10 μL xanthine oxidase (167 U/L) was vortexed and then incubated for 20 min. At the end of the reaction, formazan was produced. The absorbance of the purple colored formazan was measured at 560 nm. The more of the enzyme exists, the less O2− radical that reactig with NBT occurs [Citation24].
IL-1β and TNF-α analysis in serum and tissues
Serum and tissue-homogenate IL-1β and TNF-α concentrations were measured using rat-specific sandwich enzyme-linked immunosorbent assay (ELISA) Rat Interleukin 1β Kit (Cat no: YHB0616Ra, Shanghai LZ) and Rat Tumor Necrosis Factor α ELISA kit (Cat no: YHB1098Ra, Shanghai LZ). Analyses were performed according to the manufacturers’ instructions. Briefly, monoclonal antibody specific for rat IL-1β and TNF-α were coated on to the wells of the microplates. The serum samples, standards and biotinylated monoclonal antibody specific and streptavidin-HRP were pipetted into these wells and then incubated at 37 °C for 60 min. After washing, chromogen reagent A and chromogen reagent B were added, acted by the bound enzyme to produce a color. It was incubated at 37 °C for 10 min. Then stop solution was added. The intensity of this colored product is directly proportional to the concentration of rat IL-1β and TNF-α present in the original specimen. At the end of the course, the well plates were read at 450 nm by means of a microplate reader (Bio-Tek, USA). The absorbance of the samples was estimated with formulas having Standard graphics.
Statistical analysis
The results were expressed as “mean ± standard error of mean” (x ± SEM) . Significance of differences between the groups was determined using one-way analysis of variance (ANOVA) followed by Fisher’s post-hoc LSD (least significant differences) test. All statistical analyses were performed with “SPSS Statistics Version 18” statistical software and p values <0.05 were considered significant.
Results and discussion
MDA, MPO, tGSH and SOD levels in blood serum
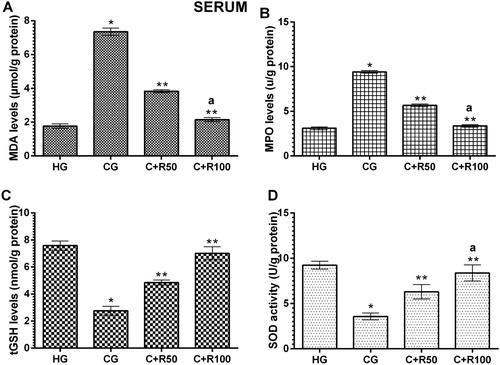
As seen in , the amount of MDA in the serum of the HG group was found to be 1.77 ± 0.13 µmol/g protein. It increased to 7.35 ± 0.22 µmol/g protein in the CG group rats, and there was a statistically significant difference compared to the HG group (p < 0.0001). MDA levels in the C + R50 and C + R100 groups decreased to 3.83 ± 0.9 and 2.15 ± 0.12 µmol/g, respectively (p < 0.0001, vs. CG group). In addition, the difference between MDA levels of C + R100 and HG groups was found to be statistically insignificant (p > 0.05) (). Serum MPO level of the HG group was measured 3.10 ± 0.15 U/g protein. MPO level increased to 9.42 ± 0.15 U/g protein in the CG group rats (p < 0.0001, vs. HG group). MPO levels in the C + R50 and C + R100 groups decreased to 5.67 ± 0.16 and 3.37 ± 0.13 U/g, respectively (p < 0.0001, vs. CG group). The difference between MDA levels of C + R100 and HG groups was found to be statistically insignificant (p > 0.05) (). Serum tGSH level of the HG group was measured as 7.58 ± 0.14 nmol/g protein. tGSH decreased to 2.77 ± 0.13 nmol/g protein in the CG group rats (p < 0.0001, vs. HG group). tGSH levels in the C + R50 and C + R100 groups increased to 4.85 ± 0.08 and 7.02 ± 0.19 nmol/g, respectively (p < 0.0001, vs. CG group) (). Serum SOD level of the HG group was measured as 9.07 ± 0.19 U/g protein. SOD decreased to 3.57 ± 0.15 U/g protein in the CG group rats (p < 0.0001, vs. HG group). SOD levels in the C + R50 and C + R100 groups increased to 6.30 ± 0.32 and 8.38 ± 0.36 U/g, respectively (p < 0.0001, vs. CG group) ().
Figure 1. Levels of MDA (A), MPO (B), tGSH (C) and SOD (D) in blood serum.
* p < 0.0001 vs. HG group, ** p < 0.0001 vs. CG group and a p > 0.05 vs. HG group.
MDA, MPO, tGSH and SOD levels in ureter tissue
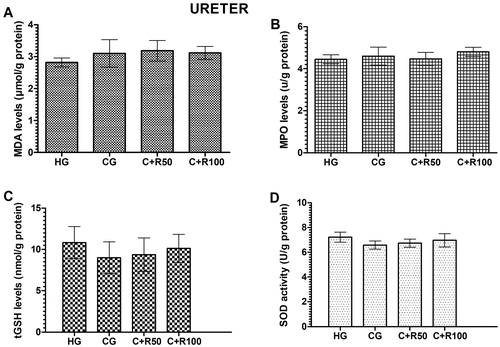
The amount of MDA in the ureter tissue of the HG, CG, C + R50 and C + R100 group rats were measured as 2.82 ± 0.14, 3.10 ± 0.43, 3.18 ± 0.32 and 3.12 ± 0.50 µmol/g protein, respectively. There was no statistically significant difference (p > 0.05, vs. HG group) (). MPO levels in the ureter tissue of the HG, CG, C + R50 and C + R100 group rats were measured as 4.45 ± 0.21, 4.60 ± 0.43, 4.47 ± 0.31 and 4.80 ± 0.22 U/g protein, respectively. There was no statistically significant difference (p > 0.05, vs. HG group) (). tGSH levels in the ureter tissue of the HG, CG, C + R50 and C + R100 group rats were measured as 10.83 ± 0.79, 9.00 ± 0.79, 9.37 ± 0.83 and 10.13 ± 0.67 nmol/g protein respectively. There was no statistically significant difference (p > 0.05, vs. HG group) (). SOD levels in the ureter tissue of the HG, CG, C + R50 and C + R100 group rats were measured as 7.21 ± 0.17, 6.75 ± 0.12, 6.73 ± 0.13 and 6.97 ± 0.22 U/g protein, respectively. There was no statistically significant difference (p > 0.05, vs. HG group) ().
Figure 2. Levels of MDA (A), MPO (B), tGSH(C) and SOD (D) in ureter tissue.
MDA, MPO, tGSH and SOD levels in bladder tissue
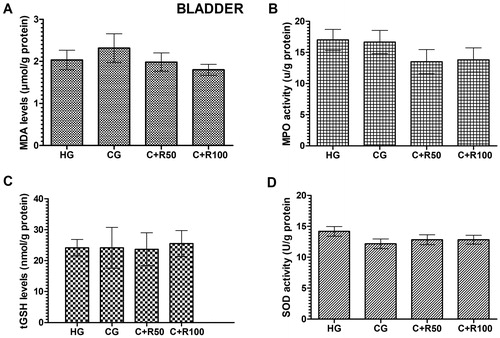
The amount of MDA in the bladder tissue of the HG, CG, C + R50 and C + R100 group rats were measured as 2.03 ± 0.14, 2.32 ± 0.34, 1.98 ± 0.22 and 1.80 ± 0.13 µmol/g protein respectively. There was no statistically significant difference (p > 0.05, vs. HG group) (). MPO levels in the ureter tissue of the HG, CG, C + R50 and C + R100 group rats were measured as 17.00 ± 1.69, 16.68 ± 1.86, 13.52 ± 1.94 and 13.80 ± 1.93 U/g protein, respectively. There was no statistically significant difference (p > 0.05, vs. HG group) (). tGSH levels in the ureter tissue of the HG, CG, C + R50 and C + R100 group rats were measured as 24.17 ± 1.08, 24.17 ± 2.70, 23.67 ± 2.17 and 25.50 ± 1.73 nmol/g protein, respectively. There was no statistically significant difference (p > 0.05, vs. HG group) (). SOD levels in the bladder tissue of the HG, CG, C + R50 and C + R100 group rats were measured as 14.17 ± 0.79, 12.17 ± 0.79, 12.83 ± 0.79 and 12.83 ± 0.70 U/g protein, respectively. There was no statistically significant difference (p > 0.05, vs. HG group) ().
Figure 3. Levels of MDA (A), MPO (B), tGSH (C) and SOD (D) in bladder tissue.
MDA, MPO, tGSH and SOD levels in urethra tissue
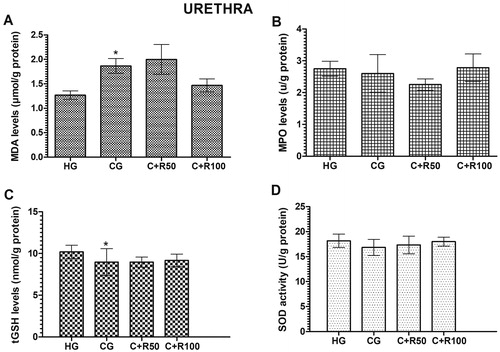
The amount of MDA in the urethra tissue of the HG group was measured as 1.27 ± 0.09 µmol/g protein. MDA level increased to 1.87 ± 0.15 µmol/g protein in the CG group rats (p < 0.05, vs. HG group). MDA levels in the C + R50 and C + R100 groups measured as 2.00 ± 0.30 and 1.47 ± 0.13 respectively (p > 0.05, vs. CG group) (). MPO levels in the urethra tissue of the HG, CG, C + R50 and C + R100 group rats were measured as 2.75 ± 0.24, 2.60 ± 0.59, 2.25 ± 0.18 and 2.78 ± 0.43 U/g protein respectively. There was no statistically significant difference (p > 0.05, vs. HG group) (). The amount of tGSH in the urethra tissue of the HG group was measured 10.20 ± 0.32 nmol/g protein. tGSH level decreased to 8.97 ± 0.66 nmol/g protein in the CG group rats (p < 0.05, vs. HG group). tGSH levels in the C + R50 and C + R100 groups measured as 8.97 ± 0.25 and 9.17 ± 0. 31 nmol/g protein, respectively (p > 0.05, vs. CG group) (). SOD levels in the urethra tissue of the HG, CG, C + R50 and C + R100 group rats were measured as 18.17 ± 0.54, 16.83 ± 0.65, 17.33 ± 0.72 and 18.00 ± 0.37 U/g protein, respectively. There was no statistically significant difference (p > 0.05, vs. HG group) ()
Figure 4. Levels of MDA (A), MPO (B), tGSH (C) and SOD (D) in urethra tissue.
* p < 0.05 vs. HG group.
IL-1β and TNF-α levels in blood serum
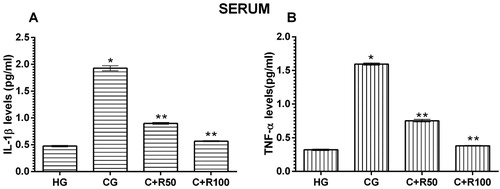
Serum IL-1β level of the HG group was measured as 0.48 ± 0.13 pg/mL. IL-1β level increased to 1.93 ± 0.05 pg/mL in the CG group rats (p < 0.0001, vs. HG group). IL-1β levels in the C + R50 and C + R100 groups decreased to 0.90 ± 0.02 and 0.57 ± 0.01 pg/mL, respectively (p < 0.0001, vs. CG group) (). Serum TNF-α level of the HG group was measured as 0.32 ± 0.01 pg/mL. TNF-α level increased to 1.70 ± 0.02 pg/mL in the CG group rats (p < 0.0001, vs. HG group). TNF-α levels in the C + R50 and C + R100 groups decreased to 0.75 ± 0.02 and 0.38 ± 0.01 pg/mL, respectively (p < 0.0001, vs. CG group) ().
Figure 5. Levels of IL-1β (A) and TNF-α (B) levels in blood serum.
* p < 0.0001 vs. HG group, ** p < 0.0001 vs. CG group.
IL-1β and TNF-α levels in ureter tissue
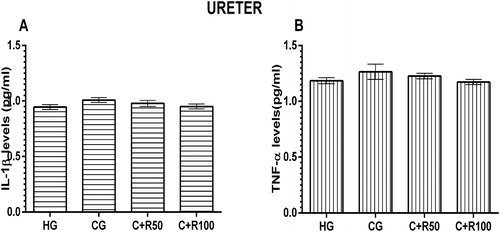
IL-1β levels in the ureter tissue of the HG, CG, C + R50 and C + R100 group rats were measured as 0.95 ± 0.02, 1.01 ± 0.02, 0.98 ± 0.03 and 0.95 ± 0.02 pg/mL, respectively. There was no statistically significant difference (p > 0.05, vs. HG group) (). TNF-α levels in the ureter tissue of the HG, CG, C + R50 and C + R100 group rats were measured as 1.19 ± 0.03, 1.27 ± 0.07, 1.23 ± 0.03 and 1.17 ± 0.02 pg/mL, respectively. There was no statistically significant difference (p > 0.05, vs. HG group) ().
Figure 6. Levels of IL-1β (A) and TNF-α (B) levels in ureter tissue.
IL-1β and TNF-α levels in bladder tissue
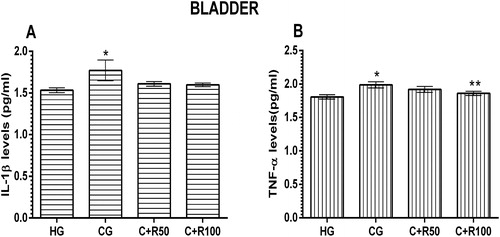
IL-1β level in the bladder tissue of the HG group was measured as 1.53 ± 0.03 pg/mL. IL-1β level increased to 1.77 ± 0.12 pg/mL in the CG group rats (p < 0.05, vs. HG group). IL-1β levels in the C + R50 and C + R100 groups were measured as 1.61 ± 0.03 and 1.60 ± 0. 02 nmol/g protein, respectively (p > 0.05, vs. CG group) (). TNF-α level in the bladder tissue of the HG group was measured 1.81 ± 0.03 pg/mL. TNF-α level increased to 1.99 ± 0.05 pg/mL in the CG group rats (p < 0.05, vs. HG group). TNF-α levels in the C + R50 group decreased to 0.92 ± 0.04 but there was no statistically significant (p > 0.05, vs. CG group) TNF-α levels in the C + R100 group decreased to 0.92 ± 0.04 (p < 0.05, vs. CG group) ().
Figure 7. Levels of IL-1β (A) and TNF-α (B) levels in bladder tissue.
* p < 0.05 vs. HG group, ** p < 0.05 vs. CG group.
IL-1β and TNF-α levels in urethra tissue
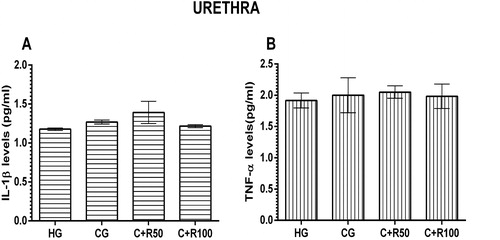
IL-1β levels in the urethra tissue of the HG, CG, C + R50 and C + R100 group rats were measured as 1.18 ± 0.02, 1.27 ± 0.03, 1.39 ± 0.14 and 1.22 ± 0.02 pg/mL, respectively. There was no statistically significant difference (p > 0.05, vs. HG group) (). TNF-α levels in the urethra tissue of the HG, CG, C + R50 and C + R100 group rats were measured as 1.92 ± 0.12, 2.00 ± 0.28, 2.05 ± 0.10 and 1.98 ± 10.20 pg/mL, respectively. There was no statistically significant difference (p > 0.05, vs. HG group) ().
Figure 8. Levels of IL-1β (A) and TNF-α (B) levels in urethra tissue.
The biotransformation of drugs, xenobiotics and environmental pollutants leads to overproduction of reactive oxygen species (ROS) that cause lipid peroxidation and oxidative stress in the body. ROS disrupts cellular balance through oxidative and inflammatory signaling and causes mitogenesis, mutagenesis, genotoxicity and cytotoxicity [Citation25]. Therefore, a phytochemical antioxidants were developed for the prevention and treatment of many diseases and toxicities. The study, the prospective toxic effects of cisplatin on blood serum, ureter, bladder and urethra were examined and the protective effect of the rutin on these organs was investigated in this study. Our biochemical test results showed that cisplatin significantly increased the MDA level in the blood serum of the animals but did not lead to a significant change in the MDA level in the ureter, bladder and urethra tissues. The increase in the MDA level in the blood serum of the cisplatin treated animals indicated that lipid peroxidation (LPO) was initiated. LPO is a process causing damage in many organisms which starts with the oxidation of polyunsaturated fatty acids by ROS and continues in the form of auto-catalytic chain reactions [Citation26]. MDA is well-known for the various aldehydes caused by LPO. MDA can also cause serious damages to membrane proteins by neutralizing the receptors and enzymes bounded to membranes, leading to cross-linking and polymerisation of the membrane components [Citation27]. Recently, cisplatin has been reported to elevate the MDA level in blood serum. In addition, it has been noted that increase in MDA levels in blood serum with cisplatin causes damages in tissue as well [Citation4]. Cisplatin has been reported to perform such effects by increasing the ROS production and in addition to an increase in the production of superoxide anion, hydrogen peroxide and hydroxyl radicals [Citation28]. On the other hand, it is interesting that the cisplatin did not increase the MDA and MPO levels in the ureter, bladder and urethra tissues in our study.
Furthermore, it has been noted that cisplatin increases the MPO activity in blood serum without altering MPO levels in the ureter, bladder, and urethra tissues. MPO enzyme is a specific enzyme for PNLs and is considered as a marker of proinflammatory damage [Citation29]. Moreover, it was found that cisplatin increased blood MPO activity. However, no studies were found showing that cisplatin increased MPO activity in the ureter, bladder and urethra. This information suggests that cisplatin does not have any toxic effect on ureter, bladder and urethra tissues. It has been histopathologically proven by Taşlı et al. [Citation30] that oxidative damage develops in optic nerve tissue of animals whose blood serum MPO activity is increased by cisplatin.
There are numbers of antioxidant defense mechanisms in vital organisms in order to prevent the deleterious effects of ROS leading to an increased production of MDA, MPO and many other oxidants. GSH is one of the most important antioxidants known in living tissues. GSH is a tripeptide composed by L-glutamate, L-cysteine and glycine and found in many cells. By means of catalysis with GPx enzyme containing selenium in the GSH active region, it reacts with hydrogen peroxides and organic peroxides. It shows an antioxidant effect and removes hydrogen peroxide away from the cells. GSH detoxifies hydrogen peroxide or organic oxides chemically protect cells from ROS damage [Citation31]. As it could be understood from our experiment results, that the tGSH level in the blood serum of the cisplatin group decreased while the MDA and MPO levels increased. On the other hand, no changes were observed in the tGSH level of the ureter, bladder and urethra tissues. There are studies reporting that there is a relationship between decreased level of tGSH in blood serum and tissue damage [Citation30]. However, no information has been found to discuss and clarify our experiment results in the literature. It was observed that cisplatin significantly reduced SOD activity in blood serum of animals in the study. A recent study has shown that cisplatin reduces SOD activity in blood serum [Citation32]. All types of SODs are enzymes that catalyzing the dismutation of superoxide and the conversion of superoxide to hydrogen peroxide and molecular oxygen [Citation33]. The data obtained from the literature indicates that SOD is an endogenous antioxidant enzyme inhibiting ROS production and protecting tissues from ROS damage. However, there was no significant change in SOD activity in ureter, bladder and urethral tissues. No studies have found showing that cisplatin inhibits SOD activity in ureter, bladder and urethral tissues.
Furthermore, it was also noted in our study that IL-1β and TNF-α levels have increased in the blood serum of the group given cisplatin and these parameters were found to be at reference levels in ureter, bladder and urethra tissues. Although it is not known whether cisplatin has any effects to the proinflammatory IL-1β and TNF-α levels in ureter, bladder and urethra in literature, it has been found that it increases the level of these cytokines in the uterus, ovary and many organ tissues [Citation34, Citation35]. In addition, it was stated that cisplatin elevated IL-1β and TNF-α levels in renal tissue at oxidative stress-forming dose [Citation36]. Hazman et al. [Citation35] have expressed that the increased level of IL-1β and TNF-α in blood serum with cisplatin is associated with tissue damage. TNF-α and IL-1β are seen in the early stage of inflammation and initiate the release of ROS [Citation37]. Ibrahim et al. [Citation38] reported the role of increased oxidant and proinflammatory cytokines on the basis of cisplatin-associated renal dysfunction and damage. They also found that the increase of IL-1β and TNF-α is associated with the increase of oxidants.
In our study, rutin used in response to the oxidative damage of cisplatin reduced the MDA, MPO, TNF-α and IL-1β levels of blood serum with the dose-dependent cisplatin. However, the parameters not affected by cisplatin showed no significant change in ureter, bladder and urethra tissues. As previously stated, it has been revealed that rutin suppresses MDA, MPO, TNF-α and IL-1β production and prevents tGSH to reduction [Citation20]. It was reported that rutin provides a protective effect with an antioxidant activity in different organ tissues. In addition, the protective effect of rutin on tissues has been associated with the inhibition of TNF-α and IL-1β production [Citation39]. It has been noted that rutin prevents MDA, MPO, TNF-α and IL-1β levels to increase in blood serum by cisplatin and tGSH level to decrease and preserves the tissue from oxidative and proinflammatory damage [Citation30].
Conclusions
Based on the obtained results, cisplatin increased the oxidant and proinflammatory parameters in blood serum. It changed the oxidant-antioxidant balance in favor of oxidants. Ureter, bladder and urethra tissues were not affected by cisplatin toxicity. Rutin suppressed the cisplatin’s oxidant and proinflammatory parameters in blood serum. Moreover, it provided a change in the oxidant-antioxidant balance in favor of antioxidants. Rutin did not change the MDA, MPO, tGSH, TNF-α and IL-1β levels of normal tissues. Our results indicate that rutin inhibited the increase of MDA, MPO, tGSH, TNF-α and IL-1β levels with cisplatin, but had no direct effect on these parameters.
Units of measurement
MDA: µmol/g protein MPO: U/g protein, tGSH: nmol/g protein, IL-1β and TNFα: pg/mL
| Abbreviations | ||
| MDA | = | malondialdehyde |
| MPO | = | myeloperoxidase |
| tGSH | = | total glutathione |
| LPO | = | Lipid peroxidation |
| IL-1β | = | Interleukin beta |
| SOD | = | Superoxide dismutase |
| TNF-α | = | tumor necrosis factor alpha |
Disclosure statement
No potential conflict of interest was reported by the author(s).
Additional information
Notes on contributors
Hirik Erkan
EH and ZS conceived and designed the study and wrote the manuscript. AB and EK performed the experiments and collected the data. AE analyzed the data and made the graphs.
Bozkurt Aliseydi
EH and ZS conceived and designed the study and wrote the manuscript. AB and EK performed the experiments and collected the data. AE analyzed the data and made the graphs.
Ercument Keskin
EH and ZS conceived and designed the study and wrote the manuscript. AB and EK performed the experiments and collected the data. AE analyzed the data and made the graphs.
Erdogan Abdullah
EH and ZS conceived and designed the study and wrote the manuscript. AB and EK performed the experiments and collected the data. AE analyzed the data and made the graphs.
Suleyman Halis
EH and ZS conceived and designed the study and wrote the manuscript. AB and EK performed the experiments and collected the data. AE analyzed the data and made the graphs.
Suleyman Zeynep
EH and ZS conceived and designed the study and wrote the manuscript. AB and EK performed the experiments and collected the data. AE analyzed the data and made the graphs.
References
- McKeage MJ. Comparative adverse effect profiles of platinum drugs. Drug Saf. 1995;13(4):228–244.
- Khan R, Khan AQ, Qamar W, et al. Chrysin abrogates cisplatin-induced oxidative stress, p53 expression, goblet cell disintegration and apoptotic responses in the jejunum of Wistar rats. Br J Nutr. 2012;108(9):1574–1585.
- Turan MI, Cayir A, Cetin N, et al. An investigation of the effect of thiamine pyrophosphate on cisplatin-induced oxidative stress and DNA damage in rat brain tissue compared with thiamine: thiamine and thiamine pyrophosphate effects on cisplatin neurotoxicity. Hum Exp Toxicol. 2014;33(1):14–21.
- Karakurt Y, Ucak T, Tasli G, et al. The Effects of Lutein on Cisplatin Induced Retinal Injury: an Experimental Study. Cutan Ocul Toxicol. 2018;37:1–18.
- Onk D, Mammadov R, Suleyman B, et al. The effect of thiamine and its metabolites on peripheral neuropathic pain induced by cisplatin in rats. Exp Anim. 2018;67(2):259–269.
- Kuduban O, Kucur C, Sener E, et al. The role of thiamine pyrophosphate in prevention of cisplatin ototoxicity in an animal model. ScientificWorld Journal. 2013;2013:1–5.
- Coskun R, Turan MI, Turan IS, et al. The protective effect of thiamine pyrophosphate, but not thiamine, against cardiotoxicity induced with cisplatin in rats. Drug Chem Toxicol. 2014;37(3):290–294.
- Sener MT, Sener E, Tok A, et al. Biochemical and histologic study of lethal cisplatin nephrotoxicity prevention by mirtazapine. Pharmacol Rep. 2012;64(3):594–602.
- Abdel-Daim MM, Aleya L, El-Bialy BE, et al. The ameliorative effects of ceftriaxone and vitamin E against cisplatin-induced nephrotoxicity. Environ Sci Pollut Res. 2019;26(15):15248–15254.
- Borekci B, Yapca OE, Turan MI, et al. Prevention of ovarian oxidative stress - related infertility associated with cisplatin in rats with thiamine pyrophosphate. Lat. Am. J. Pharm. 2013;32:512–517. http://www.latamjpharm.org/resumenes/32/4/LAJOP_32_4_1_7.pdf
- Afsar T, Razak S, Almajwal A, et al. Acacia Hydaspica R. Parker Ameliorates Cisplatin Induced Oxidative Stress, DNA Damage and Morphological Alterations in Rat Pulmonary Tissue. BMC Complement Altern Med. 2018;18(1):49.
- Chandel SS, Shirsat M, Sahu RK, et al. Modulatory effect of dietary inclusion of Aegle marmelos Fruits against cisplatin-induced hepatotoxicity in wistar rats. Ann Hepatol. 2018;17(3):482–489.
- Adefisayo MA, Adeyemi WJ, Alabi QK. Combined but not single administration of vitamin C and l-carnitine ameliorates cisplatin-induced gastric mucosa damage in male rats. Can J Physiol Pharmacol. 2018;20:1–9.
- Boroja T, Katanic J, Rosic G, et al. Summer Savory (Satureja Hortensis L.) Extract: Phytochemical Profile and Modulation of Cisplatin-Induced Liver, Renal and Testicular Toxicity. Food Chem Toxicol. 2018;118:252–263.
- Harborne JB. Nature, distribution and function of plant flavonoids. Prog Clin Biol Res. 1986;213:15–24.
- Yeung AWK, Tzvetkov NT, El-Tawil OS, et al. Antioxidants:scientific literature landscape analysis. Oxid Med Cell Longev. 2019;2019:1–11.
- Abdel-Daim MM, Aly SM, Abo-El-Sooud K, et al. Role of natural products in ameliorating drugs and chemicals toxicity. Evid Based Complement Alternat Med. 2016;2016:1–2.
- Ganeshpurkar A, Saluja AK. The Pharmacological Potential of Rutin. Saudi Pharm J. 2017;25(2):149–164.
- Yeh CH, Yang JJ, Yang ML, et al. Rutin decreases lipopolysaccharide-induced acute lung injury via inhibition of oxidative stress and the MAPK-NF-κB pathway. Free Radic Biol Med. 2014;69:249–257.
- Tasli NG, Cimen FK, Karakurt Y, et al. Int J Ophthalmol 2018;11:780–785.
- Ohkawa H, Ohishi N, Yagi K. Assay for lipid peroxides in animal tissues by thiobarbituric acid reaction. Anal Biochem. 1979;95(2):351–358.
- Bradley PP, Priebat DA, Christensen RD, et al. Measurement of cutaneous inflammation: estimation of neutrophil content with an enzyme marker. J Invest Dermatol. 1982;78(3):206–209.,
- Sedlak J, Lindsay RH. Estimation of total, protein-bound, and nonprotein sulfhydryl groups in tissue with Ellman’s reagent. Anal Biochem. 1968;25:192–205.
- Sun Y, Oberley LW, Li Y. A simple method for clinical assay of superoxide dismutase. Clin Chem. 1988;34(3):497–500.
- Abdel-Daim MM, Moustafa YM, Umezawa M, et al. Applications of Antioxidants in Ameliorating Drugs and Xenobiotics Toxicity: Mechanistic Approach. Oxid Med Cell Longev. 2017;2017:1–2., 2
- Davies KJ, Goldberg AL. Oxygen radicals stimulate intracellular proteolysis and lipid peroxidation by independent mechanisms in erythrocytes. J Biol Chem. 1987;262(17):8220–8226. https://www.jbc.org/content/262/17/8220.long
- Goulart M, Batoreu MC, Rodrigues AS, et al. Lipoperoxidation products and thiol antioxidants in chromium exposed workers. Mutagenesis. 2005;20(5):311–315.
- Rehman MU, Tahir M, Khan AQ, et al. limonene suppresses doxorubicin-induced oxidative stress and inflammation via repression of COX-2, iNOS, and NFκB in kidneys of Wistar rats. Exp Biol Med. 2014;239:465–476.
- Ormrod DJ, Harrison GL, Miller TE. Inhibition of neutrophil myeloperoxidase activity by selected tissues. J Pharmacol Methods. 1987;18(2):137–142.
- Tasli NG, Ucak T, Karakurt Y, et al. The effects of rutin on cisplatin induced oxidative retinal and optic nerve injury: an experimental study. Cutan Ocul Toxicol. 2018;37:252–257.
- R, Murray PA, Mayes VW, Rodwell DK. Granner, Harper’s biochemistry. 25th ed. McGraw-Hill Press; 2000.
- Bazmandegan G, Amirteimoury M, Kaeidi A, et al. Sumatriptan ameliorates renal injury induced by cisplatin in mice. Iran J Basic Med Sci. 2019;22(5):563–567.
- Buettner GR, Ng CF, Wang M, et al. A new paradigm: manganese superoxide dismutase influences the production of H2O2 in cells and thereby their biological state. Free Radic Biol Med. 2006;41(8):1338–1350.
- Kaygusuzoglu E, Caglayan C, Kandemir FM, et al. Zingerone ameliorates cisplatin-induced ovarian and uterine toxicity via suppression of sex hormone imbalances, oxidative stress, inflammation and apoptosis in female wistar rats. Biomed Pharmacother. 2018;102:517–530.
- Hazman Ö, Bozkurt MF, Fidan AF, et al. The Effect of Boric Acid and Borax on Oxidative Stress, Inflammation, ER Stress and apoptosis in cisplatin toxication and nephrotoxicity developing as a result of toxication. Inflammation. 2018;41(3):1032–1048.
- Abdel-Daim MM, Abushouk AI, Donia T, et al. The nephroprotective effects of allicin and ascorbic acid against cisplatin-induced toxicity in rats. Environ Sci Pollut Res. 2019;26(13):13502–13509.
- Dinarello CA. Proinflammatory cytokines. Chest. 2000;118(2):503–508.
- Ibrahim A, Al-Hizab FA, Abushouk AI, et al. Nephroprotective effects of benzyl ısothiocyanate and resveratrol against cisplatin-ınduced oxidative stress and ınflammation. Front Pharmacol. 2019;9:1268.
- Nayki U, Nayki F, Keskin Cimen M, Kulhan, et al. The effect of rutin on ovarian ischemia-reperfusion injury in a rat model. Gynecol Endocrinol. 2018;34:1–6.