
Abstract
Mesenchymal stem cells (MSCs) migrate to sites of inflammation and tumor formation in the body. In this way, MSCs become activated and release a plethora of growth factors and cytokines that are involved in the regulation and remodeling of the tumor microenvironment. The effect of MSCs on tumor cells is bipolar by nature and the data on this interaction is quite contradictory. The purpose of this work is to investigate the interaction between MSCs of different origin (bone marrow, adipose tissue) and PC-3 tumor cell line derived from prostate cancer in a long-term (9 days) cultivation. Our study assessed the proliferation, vitality and apoptosis of PC-3 tumor cells exposed to MSCs’ contact and products. As a result, we observed a significant growth inhibitory effect on PC-3 cells due to cell-to-cell contact with MSCs. Furthermore, tumor cells also showed contact-mediated increase in apoptosis levels. In addition, bone marrow-derived MSCs had a stronger effect on the PC-3 cell line compared to adipose tissue-derived MSCs.
Introduction
Mesenchymal stem cells (MSCs) are localized in all types of tissues in the adult organism and are subject to extensive research in the recent 20 years. Their ability to self-renew, to differentiate into various cell types of mesenchymal and non-mesenchymal origin, their relative accessibility as a waste product from standard surgical interventions (removal of adipose tissue beneath the incision of the skin and bone marrow via lavage of bone canal) and the lack of ethical obstructions (compared to embryonic stem cells) make them suitable to develop cell-based therapies for the treatment of diseases of diverse etiology [Citation1–3]. One highly favorable characteristic, often being referred to as homing [Citation4], is MSCs ability to migrate to places of inflammation and tumor formation [Citation5]. Through homing, they can modulate the microenvironment at the tumor sites by secreting various factors [Citation6, Citation7]. Therefore, MSCs can be used as vectors for delivery of anti-tumor agents [Citation8–11].
Recently, the number of reports of the anti-tumor effect of MSCs has increased. The majority of MSCs-tumor cell in vitro studies employ 24 to 72 h treatments, with 48 h most frequently. There is no data on the behavior of tumor cells in contact with MSCs lasting more than 72 h. However, in any therapy associated with transplantation of MSCs, these cells will remain in the body for a longer time. In 2011 Klopp et al. suggested that the timing of MSCs application into the tumor’s microenvironment is essential for the outcome of the study [Citation12].
Therefore, the aim of the present study was to investigate the effect of MSCs on PC-3 tumor cells in long-term in vitro cultivation. PC-3 cell line is derived from bone metastasis of an aggressive form of castration-resistant prostate adenocarcinoma [Citation13]. Particularly, epidemiological data show that prostate cancer is approximately 50% of all newly diagnosed cancers in men and the fifth cause of death [Citation14].
Materials and methods
Ethics statement
All patients provided written informed consent forms. Ethical approval for this study was acquired from the local Ethics Committee.
Cell cultures
For the aim of the present study, we isolated adipose tissue-derived MSCs (AT-MSCs) from 19 donors and bone marrow-derived MSCs (BM-MSCs) from 12 donors and used them in experiments of MSCs and PC-3 interactions after a preceding standard flow cytometry phenotypic characterisation (analysis of specific membrane proteins expression - data not shown). MSCs were obtained from bone marrow aspirates and subcutaneous adipose tissue fragments from adult patients undergoing hip surgery, after signing of informed consent. The used protocols are described by Bochev et al. [Citation15]. Isolated MSC-primary cultures between passages 3 and 10 were used in the experiments. PC-3 cell line (grade IV, adenocarcinoma) was purchased from ATCC (Manassas, USA). AT-MSCs, BM-MSCs and PC-3 cells were maintained in DMEM-LG complete medium (DMEM Low glucose (Sigma-Aldrich), supplemented with 10% Fetal calf serum (FCS, Sigma-Aldrich), 1% Antibiotic/Antimycotic Solution (Sigma-Aldrich)) at 37 °C, 5% CO2 and 95% humidity. The culture medium was changed every 3-4 days.
Obtaining of MSCs-Conditioned medium
To produce MSCs-conditioned medium (MSCs-CM), a fresh 48-hour culture medium from MSCs monolayer was collected, centrifuged at 500 x g for 10 min to eliminate cell debris and mixed ½ v/v with DMEM-LG complete medium.
Proliferation assessment
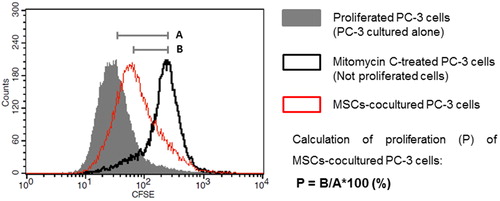
PC-3 cells were cultured to 80% confluence, detached by Trypsin-EDTA solution 0.25% (2.5 g porcine trypsin and 0.2 g EDTA, Sigma-Aldrich) and washed twice with PBS. The tumor cells were stained with 50 μmol/L 5(6)-Carboxyfluorescein diacetate N-succinimidyl ester (CFSE, Sigma-Aldrich) for 5 min at room temperature and blocked with ice-cold FCS. PC-3 cells were washed with DMEM-LG complete and seeded in concentration 0.5 × 10⁴/cm2. The tumor cells were cultured on a monolayer of MSCs or alone with supplementation of MSCs-CM for 5 and 9 days. MSCs in co-cultures were precluded from proliferation by contact inhibition. Culture medium was changed every 48 h. PC-3 cells cultured alone were used as a positive control, and Mitomycin C-treated cells were used as a negative control for proliferation. On day 5 and day 9 the cells from the experiments were harvested and analyzed by BD FACSCalibur and CellQuest Pro Software. Data were presented as overlaid histograms (). The proliferation of tumor cells cultured alone (untreated PC-3 cells) was presented as the difference between the mean fluorescence intensity of the non-proliferating PC-3 (Mitomycin C-treated cells) and the mean fluorescence intensity of untreated PC-3 cells. In every experiment these values were considered as 100% proliferation (, Line A) according to which the contact and paracrine effects of MSCs were compared. The proliferation of co-cultured and MSCs-CM-cultured PC-3 was calculated as a percentage of the difference between the mean fluorescence intensity of the non-proliferating PC-3 and the mean fluorescence intensity of the investigated cells (, Line B).
Figure 1. Schematic representation of overlapping histograms of positive control for proliferation (PC-3 cells cultured alone), negative control (Mitomycin C-treated PC-3 cells) and MSCs-co-cultured PC-3 cells and formula used to calculate the proliferation.
Cells viability assay
MSCs (1.5 × 10⁴ cells/cm2) were seeded in a 96-well plate (Corning Costar) and were cultured 48 h until reaching 100% confluency. After that, PC-3 cells (0.5 × 10⁴ cells/cm2) were seeded alone or over the MSCs monolayer. Confluent, non-proliferating MSCs cultured alone served as a control for co-cultured MSCs viability, and their OD values were used to calculate tumor cell-ODs from the co-cultures. Cell viability was measured every 48 h until day 9. Briefly, 500 μg/mL 3-(4,5-Dimethyl-2-thiazolyl)-2,5-diphenyl-2H-tetrazolium bromide (MTT, Sigma-Aldrich) solution in DMEM-LG medium were added to the cells. After 4 h incubation at 37 °C and 5% CO2, the supernatant was discarded and the formed formazan was dissolved in 100 μL DMSO (Sigma-Aldrich). The absorbance of the supernatant was measured at 544 nm by FLUOstar OPTIMA microplate reader after 5 min incubation.
Apoptosis assay
At day 5 and day 9 of culturing with MSCs or alone, PC-3 cells were stained with Annexin V Apoptosis Detection Kit APC (eBioscience) according to the manufacturer’s instructions. Co-cultured cells and control cells were analyzed by BD FACSCalibur and CellQuest Pro Software.
Statistical analysis
Data were presented as mean values with standard error (±SE). To compare outcomes between two independent groups, an unpaired t-test was used. For MTT experiments, the data were analyzed by a two-way analysis of variance (ANOVA). Significance was defined as a *p < 0.05, **p < 0.01, ***p < 0.001, ****p < 0.0001.
Results and discussion
Decreased proliferation and viability of PC-3 cells at cell-to-cell interaction with MSCs
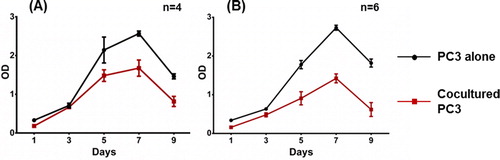
To investigate whether MSCs affect tumor cell proliferation in in vitro conditions, a CFSE assay was performed. PC-3 cells pre-stained with CFSE were cultured over a monolayer of AT-MSCs, BM-MSCs or with supplementation of MSCs-CM. FACS analysis showed a significant decrease of PC-3 cell proliferation when maintained in direct contact with MSCs compared to control PC-3 cultured alone in 5 and 9 day culturеs (, panel A). The most pronounced decrease was observed by co-culturing with BM-MSCs for 5 days (18.67% ± 5.92%). PC-3 cells cultured with AT-MSCs showed 6.08% ± 3.06% decrease in proliferation at day 5. At day 9, we observed equal retardation in PC-3 cell proliferation in both co-cultures, i.e. 9.52% ± 2.11% in AT-MSCs and 9.48% ±1.87% in BM-MSCs. In contrast, tumor cells cultured with MSCs-CM did not show altered proliferation at day 5 (, panel B). At day 9, AT-MSCs-CM decreased the proliferation of PC-3 by 3.7%± 1.01% and BM-MSCs-CM by 4.5%± 0.55%. Further, the viability of PC-3 cells cultured in contact with MSCs or alone was assessed for 9 days. A monolayer of non-proliferating AT-MSCs and BM-MSCs cultured alone served as controls. As a result, we observed a significant decrease in PC-3 cell viability after the third day of co-culturing with AT-MSCs and BM-MSCs (). The effect reached 70% of the control PC-3 viability levels for AT-MSCs co-cultures and 51% for BM-MSCs co-cultures at day 5. The reduced viability was maintained until day 9 of co-cultivation.
Figure 2. A graph of the proliferation of PC-3 cells cultured with MSCs (A) and MSCs-CM (B). Proliferation was measured by CFSE dilution via flow cytometry and calculated as a percentage of the proliferation of control cells cultured alone (100%). Culture duration: 5 days (■); 9 days (●). Statistically significant differences, unpaired t-test (*p < 0.05, **p < 0.01, ***p < 0.001, ****p < 0.0001).
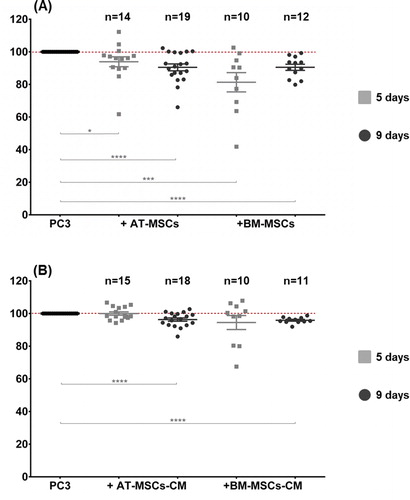
Figure 3. MSCs induce significant suppression of PC-3 viability. PC-3 cells were cultured on a monolayer of AT-MSCs (A) and BM-MSCs (B) for 9 days. Cell viability was measured by MTT test every 48 h from day 1 to day 9. Statistically significant differences, two-way ANOVA test (p < 0.0001).
In the present study, we investigated the effect of AT-MSCs and BT-MSCs on the PC-3 tumor cell line at day 5 and day 9 in vitro cultivation. We first assessed the proliferation of PC-3 when cultured in contact with two types of MSCs or with fresh conditioned medium of MSCs for 5 and 9 days. Our findings showed a cell-to-cell mediated delay of the proliferation of PC-3 cells, which resulted from the influence of MSCs. This effect was stronger in co-cultures with BM-MSCs for 5 days of cultivation (18.67%), and we can speculate a different impact of MSCs on tumor cells depending on their source. Klopp et al. also suggest that the controversy in reports of mesenchymal stem cells and tumor cells interactions is due to a different source of MSCs used [Citation12]. Interestingly, for tumor cells co-cultured with AT-MSCs, the observed effect increased in time and showed 6.08% delay of proliferation at day 5 and 9.52% at day 9. Moreover, we found that PC-3 cell viability strongly decreased during co-culturing with both types of MSCs. The decrease was visible after the 3rd day of co-culturing, and at day 5, the PC-3 viability reached 51% of the primary viability levels when cultured with BM-MSCs and 70% when cultured with AT-MSCs. Furthermore, this effect remained stable until day 9 of co-cultivation. Other groups also reported decreased proliferation and viability of PC-3 as a result of interaction with MSCs from different sources [Citation16,Citation17,Citation18]. Takahara et al. have suggested that the anti-proliferative effect of MSCs on prostate carcinoma cell lines (LnCaP and PC-3) is due to TGF-β1 secretion and signaling [Citation17]. On the other hand, Zhu et al. have reported that MSCs inhibit the proliferation of tumor cells of two lines with hematopoietic origin (K562, HL60) and one adenocarcinoma cell line (MCF7) and the inhibitory effect was achieved through secretion of a soluble molecule DKK-1 due to blocking of WNT signaling pathway [Citation19]. Ramasamy et al. have demonstrated an inhibition of tumor cell lines with lymphoid, myeloid, erythroid, and non-hematopoietic origin by soluble factors secreted by MSCs [Citation20]. However, our results showed slight effect on the proliferation of PC-3 cells cultured with conditioned medium from MSCs for 5 days. Noteworthy, this effect increased over time and reached 4.15% on day 9. Therefore, we assume that the retardation of PC-3 cell proliferation by MSCs is contact-mediated.
MSCs enhance apoptosis of PC-3 cells
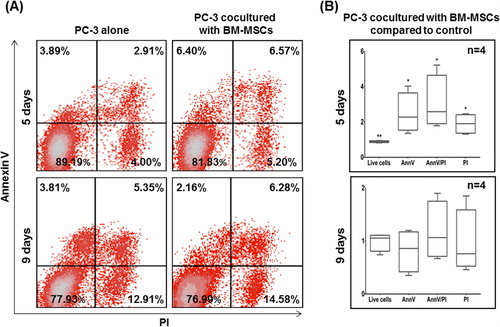
Escape from apoptosis is a major mechanism for tumor cell survival in many cancers [Citation21]. The level of apoptosis of PC-3 tumor cells was evaluated by AnnexinV (AnnV) and propidium iodide (PI) analysis and flow cytometry. The same experimental conditions described previously in the proliferation assay of co-cultures were also applied in this assay. MSCs were excluded from the analysis via preceding CFSE staining. At day 5, PC-3 cells co-cultured with AT-MSCs displayed a trend toward increased late apoptotic cells (AnnV+/PI+) () compared to tumor cells cultured alone. At day 9, a similar trend was observed with both late apoptotic (AnnV+/PI+) and necrotic (AnnV-/PI+) cells, but no statistical significance was observed. presents the apoptotic levels of PC-3 cells co-cultured with BM-MSCs. At day 5, the number of early apoptotic (AnnV+/PI-) tumor cells was 1.64-fold higher, late apoptotic cells were double (2.26-fold) and necrotic cells were 1.3-fold increased compared to control PC-3 cells. Overall, we observed 0.9-fold decrease in the total number of live cells (AnnV-/PI-), corresponding to the reduced viability described above. At day 9, this effect was not maintained, although the trend toward the increase of late apoptotic and necrotic cells continued to be observed.
Figure 4a. (A) Representative flow cytometry dot plots for AnnV and PI of PC-3 cells co-cultured with AT-MSCs. (B) Living (AnnV-/PI-), early apoptotic (AnnV+/PI-), late apoptotic (AnnV+/PI+) and necrotic cells (AnnV-/PI+) are presented in the fold change versus control cells.
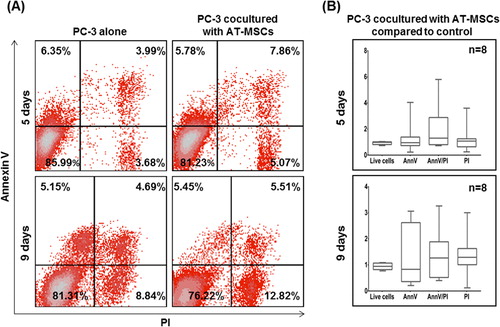
Figure 4b. (A) Representative flow cytometry dot plots for AnnV and PI of PC-3 cells co-cultured with BM-MSCs. (B) Living (AnnV-/PI-), early apoptotic (AnnV+/PI-), late apoptotic (AnnV+/PI+) and necrotic cells (AnnV-/PI+) are presented in the fold change versus control cells. Statistically significant differences, unpaired t-test (*p <0.05, **p < 0.01).
In general, our results showed a significant increase of apoptotic and necrotic PC-3 cells when cultured with BM-MSCs. Inversely, the effect on apoptosis of PC-3 cells was not so pronounced when they are co-cultured with AT-MSCs. Altogether our observations support the hypothesis of varying effects of MSCs types on PC-3 cells. In recent years several groups have reported an enhancement of apoptosis of different tumor cell lines induced by MSCs with different origin [Citation16, Citation17, Citation20, Citation22, Citation23]. It is known that inhibition of apoptosis is a key mechanism of survival of cancer cells. The most frequent mechanism for avoiding apoptosis used by cancer cells is mutations in the p53 gene. Often p53 is called “the genome guardian”, and its mutations are found in more than 50% of human cancers [Citation24, Citation25], finally leading to loss of protein functionality. Although the PC-3 cell line also expresses a non-functional p53 [Citation18], our results showed an increase in apoptosis of PC-3 cells as a result of interaction with BM-MSCs. According to these observations, it can be speculated that the apoptosis of PC-3 cells is induced in a p53-independent pathway. One possibility is via expression of mTRAIL - membrane-bound tumor necrosis factor-related apoptosis-inducing ligand on MSCs. TRAIL may increase dramatically under certain conditions [Citation23] and can induce p53-independent apoptosis via binding with DR4 and DR5 receptors on tumor cells [Citation21, Citation26].
Conclusions
Taken together, the decreased proliferation, the diminished cell viability and the increased apoptosis of PC-3 cells can be considered as a pronounced anti-tumor effect of MSCs on PC-3 tumor cell line when maintained in direct contact in vitro for a long time. The observed effect was more substantial under the influence of BM-MSCs and its peak was observed on the fifth day of co-cultivation.
Disclosure statement
No potential conflict of interest was reported by the author(s).
Additional information
Funding
References
- Tonti GA, Mannello F. From bone marrow to therapeutic applications: Different behaviour and genetic/epigenetic stability during mesenchymal stem cell expansion in autologous and foetal bovine sera? Int J Dev Biol. 2008;52(8):1023–1032.
- Wong R. Mesenchymal stem cells: Angels or demons?. J Biomed Biotechnol. 2011;2011:1–8.
- de Araújo Farias V, Carrillo-Gálvez AB, Martín F, et al. TGF-β and mesenchymal stromal cells in regenerative medicine, autoimmunity and cancer. Cytokine Growth Factor Rev. 2018;43(June):25–37.
- Sohni A, Verfaillie CM. Mesenchymal stem cells migration homing and tracking. Stem Cells Int. 2013;2013:1–8.
- Avnet S, Lemma S, Cortini M, et al. Pre-clinical models for studying the interaction between mesenchymal stromal cells and cancer cells and the induction of stemness. Front Oncol. 2019;9(APR):1–8.
- Adamo A, Dal Collo G, Bazzoni R, et al. Role of mesenchymal stromal cell-derived extracellular vesicles in tumour microenvironment. Biochim Biophys Acta - Rev Cancer. 2019;1871(1):192–198.
- Laplagne C, Domagala M, Le Naour A, et al. Latest Advances in Targeting the Tumor Microenvironment for Tumor Suppression. IJMS. 2019;20(19):4719.
- Rhee KJ, Lee JI, Eom YW. Mesenchymal stem cell-mediated effects of tumor support or suppression. IJMS. 2015;16(12):30015–30033.
- Barcellos-de-Souza P, Gori V, Bambi F, et al. Tumor microenvironment: Bone marrow-mesenchymal stem cells as key players. Biochim Biophys Acta - Rev Cancer. 2013;1836(2):321–335.
- Nakamizo A, Marini F, Amano T, et al. Human Bone Marrow – Derived Mesenchymal Stem Cells in the Treatment of Gliomas. Cancer Res. 2005;65(8):3307–3318.
- Khakoo AY, Pati S, Anderson S. a, et al. Human mesenchymal stem cells exert potent antitumorigenic effects in a model of Kaposi’s sarcoma. J Exp Med. 2006;203(5):1235–1247.
- Klopp AH, Gupta A, Spaeth E, et al. Concise review: Dissecting a discrepancy in the literature: Do mesenchymal stem cells support or suppress tumor growth?. Stem Cells. 2011;29(1):11–19.
- Tai S, Sun Y, Squires JM, et al. PC3 is a cell line characteristic of prostatic small cell carcinoma. Prostate. 2011;71(15):1668–1679.
- Bray F, Ferlay J, Soerjomataram I, et al. Global cancer statistics 2018: GLOBOCAN estimates of incidence and mortality worldwide for 36 cancers in 185 countries. CA Cancer J Clin. 2018;68(6):394–424.
- Bochev I, Elmadjian G, Kyurkchiev D, et al. Mesenchymal stem cells from human bone marrow or adipose tissue differently modulate mitogen-stimulated B-cell immunoglobulin production in vitro. Cell Biol Int. 2008;32(4):384–393.
- Han I, Yun M, Kim E-O, et al. Umbilical cord tissue-derived mesenchymal stem cells induce apoptosis in PC-3 prostate cancer cells through activation of JNK and downregulation of PI3K/AKT signaling. Stem Cell Res Ther. 2014;5(2):54.
- Takahara K, Ii M, Inamoto T, et al. Adipose-derived stromal cells inhibit prostate cancer cell proliferation inducing apoptosis. Biochem Biophys Res Commun. 2014;446(4):1102–1107.
- Cavarretta IT, Altanerova V, Matuskova M, et al. Adipose tissue-derived mesenchymal stem cells expressing prodrug-converting enzyme inhibit human prostate tumor growth. Mol Ther. 2010;18(1):223–231.
- Zhu Y, Sun Z, Han Q, et al. Human mesenchymal stem cells inhibit cancer cell proliferation by secreting DKK-1. Leuk off J Leuk Soc Am Leuk Res Fund, UK. 2009;23(5):925–933.
- Ramasamy R, Lam E-F, Soeiro I, et al. Mesenchymal stem cells inhibit proliferation and apoptosis of tumor cells: impact on in vivo tumor growth. Leukemia. 2007;21(2):304–310.
- Lowe SW, Lin AW. Apoptosis in cancer. Carcinogenesis. 2000;21(3):485–495.
- Yang C, Lei D, Ouyang W, et al. Conditioned media from human adipose tissue-derived mesenchymal stem cells and umbilical cord-derived mesenchymal stem cells efficiently induced the apoptosis and differentiation in human glioma cell lines in vitro. Biomed Res Int. 2014;2014:1–13.
- Du J, Zhou L, Chen X, et al. IFN-γ-primed human bone marrow mesenchymal stem cells induce tumor cell apoptosis in vitro via tumor necrosis factor-related apoptosis-inducing ligand. Int J Biochem Cell Biol. 2012;44(8):1305–1314.
- Fernald K, Kurokawa M. Evading apoptosis in cancer. Trends Cell Biol. 2013;23(12):620–633.
- Brown JM, Attardi LD. The role of apoptosis in cancer development and treatment response. Nat Rev Cancer. 2005;5(3):231–237.
- Rahman M, Davis SR, Pumphrey JG, et al. TRAIL induces apoptosis in triple-negative breast cancer cells with a mesenchymal phenotype. Breast Cancer Res Treat. 2009;113(2):217–230.