
 ?Mathematical formulae have been encoded as MathML and are displayed in this HTML version using MathJax in order to improve their display. Uncheck the box to turn MathJax off. This feature requires Javascript. Click on a formula to zoom.
Abstract
To keep plant height (PH) stable in various densities, mapping QTL underlying te response of PH to density is of importance for soybean breeding. In this study, two soybean RIL populations were planted under two densities in two environments and PH at the pod-bearing stage (PBS), seed-filling stage (SFS) and maturity stage (MS) were measured to identify QTL controlling PH and its response to density increment. Expression of QTL controlling PH varied due to the change of seeding density, and the response to density (RD) of PH at SFS and MS surpassed that at PBS in both populations. Total 25 PH QTL and 8 RD QTL were identified which functioned on PH at three developmental stages. Of 25 PH QTL, 14, 8 and 8 were detected at PBS, SFS and MS, respectively. Three QTL could be expressed at two stages, and thirteen, seven and six QTL played roles separately at PDS, SFS and MS, respectively. Four QTL were expressed in the two seeding densities, and twelve and ten QTL showed effects specifically at low and high seeding density, respectively. Among eight RD QTL, five, two and one acted on PH at PBS, SFS and MS, and five and three QTL functioned in two environments, respectively. The information found in the present research lays the foundation for molecular design breeding on improving PH with stability in multiple densities in soybean.
Introduction
Due to the high protein and oil content, soybean [Glycine max (L.) Merr.] has become a major source of plant oil and edible protein for humans and animals. Plant height (PH) is an important agronomic trait which determines soybean yield [Citation1–5], for PH influences adaptive traits [Citation6], the number of pods on the main stem [Citation7],and the harvest index [Citation3, Citation8], which affect the yield [Citation2, Citation3, Citation6, Citation8–11]. PH is a quantitative trait that is controlled by multiple genes and is easily influenced by environmental conditions [Citation2–4, Citation11–16]. With the development of molecular marker techniques, quantitative trait loci (QTL) have been gradually mapped to plant chromosomes [Citation11, Citation15, Citation17, Citation18]. In the last 20 years, linkage maps constructed from multiple populations have been used for QTL mapping studies on plant height [Citation1, Citation4, Citation9, Citation11, Citation13, Citation19, Citation20]. Lee et al. [Citation3] identified a major effector locus for plant height, Dt1, on linkage group (LG) L, which could explain 67.7% of the total variation for plant height. Mansur et al. [Citation9] identified a locus that could explain 31.6% of the total variation in plant height. Zhang et al. [Citation20] identified three loci on LG C2 that could explain 20% of the total variation. By June 2019, 256 plant height QTL had been mapped to 20 soybean chromosomes (https://www.soybase.org/). Furthermore, Diers et al. [Citation21] identified 15 QTL related to PH by a Nested Association Mapping (NAM) Recombinant Inbred Lines (RIL). Xue et al. [Citation22] identified 19 novel QTL for PH in a four-way RIL population. Su et al. [Citation23] mapped 9 QTL controlling PH. In previous studies, QTL for soybean PH were identified predominantly based on the phenotypes at maturation, which cannot explain the genetic effects at specific development stages [Citation14]. In contrast, dynamic development trait mapping has been performed in some studies, such as in rice and cotton [Citation24, Citation25]. Sun et al. [Citation14] mapped dynamic development changes in plant height in soybean using 10-day intervals. Seeding density is one of the important cultivation techniques that affects PH in soybean, and generally PH extends with the increase of seeding density [Citation26–30]. Additionally, different genotypes have different responses to the change in seeding density [Citation31]. However, the influence of seeding density on the developmental process of PH and its genetic basis has not been explored.
In the present study, two soybean recombinant inbred line (RIL) populations (RIL3613 and RIL6013) with a common female parent were used to identify QTL associated with PH and its response to densities at the pod-bearing stage, seed-filling stage and maturity stage. The objective is to analyze the QTL basis of PH development under two seeding densities in soybean.
Materials and methods
Design and construction of the genetic populations
In 2005, three soybean cultivars with large plant height differences were selected, including Dongnong L13 (PH 135 cm) as a common female parent and Heihe 36 (PH 78 cm) and Henong 60 (PH 62 cm) as male parents to produce the crosses (Dongnong L13 × Heihe 36 and Dongnong L13 × Henong 60). Single seed descent was used in each generation to obtain the progeny, and the seperate individuals were derived from single seeds from the F2 to F5 generations. In the F6 generation, individuals were planted to form plant lines, and two recombinant inbred populations, RIL3613 from Dongnong L13 ×Heihe 36 and RIL6013 from Dongnong L13 × Henong 60, were constructed with 134 and 156 lines [Citation32].
Plant density and field experiment design
The entire field experiment was carried out in Keshan (E125°N48°) and Harbin (E 128°N45°) in 2015. In Keshan, the planting density was 2.6 × 10⁵ plants/ha (termed 2015KD1) and 3.5 × 10⁵ plants/ha (termed 2015KD2), and 2.2 × 10⁵ plants/ha (termed 2015HD1) and 3.1 × 10⁵ plants/ha (termed 2015HD2) in Harbin. The main planting factors are listed in Supplemental Table S1. A complete randomized block design with three replicates was adopted for the field experiments. Three-line plots were used with 5 m length and 0.67 m width. The plant distances for 2015KD1, 2015KD2, 2015HD1 and 2015HD2 were 6, 4.4, 7, and 10 cm, respectively.
Plant height measurements
Five plants were marked and their PH was measured at the pod-bearing period (R4 stage), seed-filling period (R6 stage) and maturity period (R8 stage), which were specified according Fehr et al. [Citation33] for 2015KD1, 2015KD2, 2015HD1 and 2015HD2. The specific measurement method included randomly selecting five individuals from every line and measuring the distance from the cotyledonary nod to the top of the growing point. The mean value of five individuals was taken as the PH at different periods.
Data statistics and analysis
Descriptive statistics were used to evaluate the mean plant height values for each stage of each density for each environment. Analysis of variance (ANOVA) including the effects of environment, genotypes, densities and genotype × density interaction effects was conducted for the mean of PH, and the variance components were estimated by a mixed model method. The following equation was used to estimate heritability:
where,
is heritability,
is the genetic variance component,
is the variance of genotype × density interaction component,
is the error variance component, d is the level of density treatment,
is the number of environments.
Microsoft Excel 2010 (Microsoft Corporation, Albuquerque, NM, US) was used for the descriptive statistics and analysis of the data. ANOVA was carried out using the generalized liner model (GLM) procedure in SAS 9.2 software, and
and
were estimated via the MIXED procedure in SAS9.2.
Estimation of response to density
Response to density (RD) could be measured by the net effect of density on PH, which was carried out according to the condition variable method proposed by Zhu [Citation34]. The specific calculation method for RD was to subtract the background of normal seeding density (the first density) from the PH phenotype of the higher density (second density). The specific equation is shown as follows:
where PH2 is the plant height at the second planting density, C(1,2) is the covariance of plant height under the two planting densities,
is the mean plant height under the first planting density, and V1 is the variance of plant height under the first planting density.
RD was calculated using the formulas available in Excel 2010.
Mapping QTL
PH QTL mapping was carried out using the data of PH under various seeding density in each location, and RD QTL mapping was conducted via the estimated RD values.
Based on the constructed genetic map in a previous study [Citation32], inclusive composite interval mapping (ICIM) [Citation35], composite interval mapping (CIM) [Citation36] and single marker analysis (SMA) was applied to detect GDE and DE QTL. The log of odd (LOD) scores for ICIM and CIM was 2.5, and a probability level of p < 0.05 of F-value from SMA was used as a significance threshold to detect QTL. QTL that were simultaneously detected by at least two methods and with a phenotypic variance explained (PVE) over 2% or coefficient of determination (R2) greater than 0.1 were regarded as QTL. ICIM-ADD was implemented using IciMapping 4.1 (http://www.isbreeding.net/software/). CIM and SMA were implemented using WinQTLCart 2.5 (https://brcwebportal.cos.ncsu.edu/ qtlcart/WQTLCart.htm).
Naming conventions for QTL
We used q to represent QTL, PH to represent plant height traits, and RD to represent response of PH to density. QTL were named according to qPH/qRDPH + chromosome name + sequence number. QTL that were mapped to the same marker region were given the same sequence number. Unified numbering was used for the two populations (RIL3613 and RIL6013).
Results and discussion
Phenotypic analysis
The genotype variation of PH for each population reached significance at 0.01 level under each density treatment in the studied environments, which showed that difference in gene expression existed between the two populations. Comparing the two populations, there were no distinct differences in the mean values, standard deviations and ranges, which showed that there was maybe a similar power to detect QTL in these two populations. Furthermore, the mean of variance from genotype × density interaction effects reached significance, which showed that the expression of QTL controlling PH varied according to the change of seeding density. The RD on PH varied depending on developmental stages, for both populations. The mean of RD at SFS and MS exceeded that at PBS, which showed that the influence of density on PH at SFS and MS surpassed that at PBS. The standard deviation and range of RD in Harbin was higher than that in Keshan, which indicates that the extension of the response of genotypes to density in Harbin was larger than in Keshan. There were significant variations between the two environments, and the means, standard deviations and ranges of PH showed difference. The significant genetic variance, genotype × density interaction effects variance and environmental variance of PH also indicated the possibility to identify different QTL under the variation of seeding density and plant locations. The heritabilities of PH ranged from 0.57 at PBS to 0.71 at MB for RIL3613, and from 0.42 at MB to 0.70 at SFS for RIL6013, respectively (Supplemental Table S2).
Kurtosis and skewness showed that the data of PH and RD of two the populations in all environments followed continuous normal distribution with an extensive phonemic variation, which indicate it is feasible to conduct genetic analysis based on these data (Supplemental Table S3, Supplemental Table S4 and Supplemental Figure S1, Supplemental Figure S2).
QTL detected by combination of multiple statistical methods
QTL mapping methods include SMA, CIM, ICIM, etc., and each mapping method uses different statistical principles with differing parameter estimation and significance testing approaches [Citation31]. A combination of multiple statistical methods could decrease false positive QTL [Citation37]. SMA is the simplest analysis method and only tests one marker at a time without background control. This may result in false positive QTL [Citation38]. But the region where QTL are located in IM is easily disturbed by background variables, resulting in biased estimation. CIM and ICIM can improve QTL detection power and decrease deviations from estimations of QTL location and effects by background controlling [Citation35]. While differences existed in selection of molecular markers as background which led to different QTL mapping results. Therefore, the joint use of multiple mapping methods can increase the reliability of the QTL identification results [Citation39]. To decrease the false positive ratio, we used at least two methods simultaneously in QTL selection. Furthermore, there were differences in the estimation of genetic contribution of QTL to Phenotype according to the statistical methods. To select QTL with bigger contribution to target traits, the second standard was set of a Phenotypic variance explained (PVE) over 2% or coefficient of determination (R2) greater than 0.1. Combining the above two standards, 25 PH and eight RD QTL for PH were screened from 58, 35, and 570 QTL for PH and RD detected in the RIL3613 and RIL6013 populations using the CIM, ICIM, and SMA methods, respectively. The results supported each other and some false positive QTL that were present from the single mapping methods were filtered out, ensuring the authenticity of the detected QTL loci. Selecting QTL that are authentic and have high contribution rates according to the plant height target has significance in selective breeding.
Mapping of plant height QTL at different developmental stages
In the case of dynamic traits, the phenotype changes over time, which indicates that the genetic role on dynamic traits differs in the process of development. Based on the previous research on PH of rice [Citation25], triticale [Citation40], soybean [Citation14], biomass and developmental stage of triticale [Citation41], QTL associated with dynamic traits functioned at one stage specifically or multiple periods. In the present study, a total of 13, 8 and 6 QTL () were detected by over two methods in the RIL3613 and RIL6013 populations at PBS, SFS and MS with PVE (ICIM) of 2.0% −12.63 or R2 (CIM) of 0.08 - 0.42, PVE (ICIM) of 7.21%-11.8% or R2 (CIM) of 0.06 – 0.32, PVE (ICIM) of 5.31%-11.69 or R2 (CIM) of 0.10-0.30 for single QTL, respectively, which were located at the A2, B1, B2, C1, D1a, E, F, G, H, I, K, L, M and N linkage groups. Among the whole PH QTL, three QTL were identified in two developmental stages, i.e. qPH-C1-1 and qPH-M-4 at SFS and MS, and qPH-M-2 at PBS and SFS, whereas the remaining 21 QTL were specific for PBS, SFS or MS. In line with previous reports [Citation14, Citation22, Citation24, Citation25, Citation43], in this experiment, QTL for PH are generally expressed dynamically, and PH is controlled by different combinations of QTL throughout PH development.
Table 1. QTL for plant height at pod bearing stage.
Table 2. QTL for plant height at seed filling period.
Table 3. QTL for plant height at maturity period.
Stable and specific QTL at different density
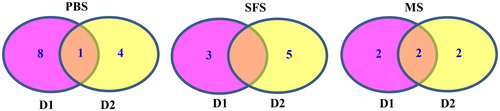
Soybean plant height is a quantitative trait that is controlled by both genetic and environmental factors [Citation11, Citation14, Citation16]. Therefore, QTL can be classified as stable QTL and environmentally specific QTL. The former refer to QTL that are expressed in multiple environments, whereas the latter represents QTL functioning in single environments. QTL mapping of these two types of loci is usually achieved through multi-year and multi-site experiments. Lee et al. [Citation44] used single factor ANOVA to map six QTL that were stably expressed in multiple environments. In this study, we detected QTL controlling PH at two plant densities. At low density (2015HD1 and 2015KD1), 20 QTL associated with PH were detected only in one stage, whereas at high density (2015HD2 and 2015KD2), four QTL identified in two stages, i.e. qPH-M-2 at PBS and SFS, qPH-L-2 at PBS and MS, and qPH-G-1 and qPH-C1-1 at SFS and MS. There were three QTL detected simultaneously at the two seeding densities, i.e. qPH-M-2 at PBS, and qPH-B1-2 and qPH-G-2 at MS, and 13 QTL and 11 QTL were only discovered at low density (2015HD1 and 2015KD1) and high density (2015HD2 and 2015KD2) (). By comparing the number of two kinds of QTL, it could be shown that selection of a variety suitable for a special environment is easier than breeding a line with a stable PH in multiple environments ().
Figure 1. Temporal contribution of QTL.
Temporal development of PVE or R2 of the QTL detected at PBS, SFS and MS for PH under low seeding density (Left) and high density (Right)
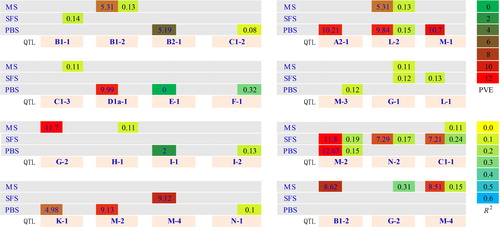
Figure 2. Venn diagram for QTL related to PH detected under two densities at three developmental stages.
PBS: Pod bearing stage; SFS: Seeds filling stage; MS: Maturity stage
D1: Planting density of 2.2 × 10⁵ plants/hm2 in Harbin OR 2.6 × 10⁵ plants/hm2 in Keshan; KD2 means planting density of 3.1 × 10⁵ plants/hm2 in Harbin OR 3.5 × 10⁵ plants/hm2 in Keshan
Genetic basis for the response to seeding density of PH
Density is an important environmental factor that affects plant height in soybeans: plant height increases generally as seeding density increases [Citation26, Citation28, Citation29]. Different varieties have different responses to increase in seeding density [Citation45]. Generally, the existence of the integral variation of this response could be tested by the significance of the genotype-by-environment interaction, but little attention has been paid to the response of single lines to density increase. In this research, we used RD to indicate the lines’ response to density increase, which showed wide variation for the two populations under two environments. Therefore, genetic factors play an important role in altering plant height when density increases. However, no studies on the genetic basis in soybeans in response to changes in density have been conducted previously. Here, based on the phenotypic data of RD, we identified five RD QTL (qRDPH-A2-1, qRDPH-F-1, qRDPH-G-1, qRDPH-G-2 and qRDPH-M-1), two RD QTL (qRDPH-D1b-1 and qRDPH-M-2) and one RD QTL (qRDPH-B1-1) underlying the response to the change in the density identified at PBS, SFS and MS with PVE (ICIM) of 9.30% −10.99% or R2 (CIM) of 0.01 - 0.25, R2 (CIM) of 0.07 – 0.08, R2 (CIM) of 0.04-0.23 for single QTL, respectively, which were located at the A2, B1, D1b, F, G and M linkage groups. These QTL adjusted the phenotype of PH according to planting density through additive effects, i.e. the allelic genes from Dongnong L13 at qRDPH-A2-1, qRDPH-M-2, qRDPH-B1-1 and qRDPH-F-1, the allelic genes from Heihe 36 at qRDPH-M-1 and qRDPH-D1b-1, and the allelic genes from Henong 60 at qRDPH-G-1 and qRDPH-G-2 would increase PH as the planting density was increased. These were the molecular bases of the influence of density on plant height changes. Regarding the developmental stages, the number and effects of RD QTL in PBS (five QTL) were larger than those in SFS (two QTL) and MS (one QTL) (), which showed the most active response to density appeared in PBS. Under the effects of these QTL, soybean plant height exhibited large differences under different densities.
Co-mapping in multiple genetic backgrounds
By anchoring the QTL for PH found in the present and previous researches on a public linkage map [Citation42], a comparison of the genomic region could be conducted (Supplemental Table S5). The corresponding locus of the qPH-M-4 QTL that was mapped in this study lies at 62.13–76.41 cM (Satt536–Satt655) in the public map. There are reports on five similar QTL in the region where this QTL is located [Citation9, Citation15, Citation43, Citation46–48]. The corresponding locus of the qPH-B1-2 QTL that was mapped in this study lies at 46.38–102.55 (Satt197–Satt359) in the public map. Four similar QTL in the region where this QTL is located have been described [Citation2, Citation14, Citation49]. The corresponding locus of the qPH-C1-1 QTL that was mapped in this study lies at 0.00–88.94 cM (satt565–Satt713) in the public map. Three similar QTL in the region where this QTL is located have been reported [Citation2, Citation50]. The corresponding locus of the qPH-D1a-1 QTL that was mapped in this study lies at 5.93–104.27 cM (Sat_413–Sat_160) in the public map, and four similar QTL in the region where this QTL is located have been discussed [Citation14, Citation43, Citation51, Citation52]. The corresponding locus of the qPH-G-2-2 QTL that was mapped in this study lies at 68.76–76.76 cM (Satt503–Satt288) in the public map. There is a report on one similar QTL in the region where this QTL is located [Citation14].
The corresponding locus of the qPH-M-4 QTL that was mapped in this study lies at 33.47–85.34 cM (Satt567–Satt697) in the public map; and one similar QTL in the region where this QTL is located has been reported [Citation46]. Although qRDPH-A2-1, qPH-B1-1, qRDPH-B1-1, qPH-B2-1, qPH-E-1, qPH-F-1, qRDPH-F-1, qRDPH-G-2, qPH-I-1, qPH-I-2, qPH-L-1, qPH-L-2, qPH-M-1, qRDPH-M-1 and qRDPH-M-2 were not mapped to multiple environments, these QTL have been mapped in some studies (Supplemental Table S5). The QTL qPH-C1-3, qPH-C1-2, qPH-G-1, qRDPH-G-1, qPH-H-1 and qPH-N-2 that were mapped in this study were not mapped in other studies and may constitute new loci, so these six QTL are novel and need further analysis.
Molecular marker-assisted selection protocol for plant height
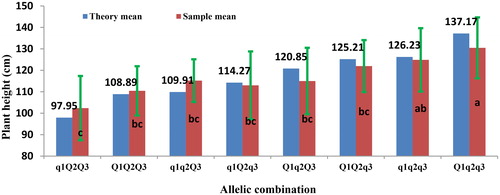
The QTL for PH and RD identified in a specific combination of density and location could be used to design a molecular breeding scheme to achieve a breeding goal of PH. For QTL associated with PH, allele genotype of QTL carried by a specific parent that showed an additive effect on PH could be estimated by the posterior probability [Citation35]. Then the breeding goal could be predicted in each developmental stage separately by the sum of additive effects from alleles in the combination of whole QTL (). For example, of the combination of QTL detected in RIL3613 in MS under the planting density 2.6 × 10⁵ plants/ha in Keshan, three QTL, i.e. qPH-C1-3 (Satt396- Sat_367), qPH-B1-2 (Satt197- Satt359) and qPH-G-2 (Satt503- Satt288), were detected with positive, negative and negative additive effect, respectively. There may be eight combinations of alleles which showed that the sum of additive effects ranged from -19.61 to 19.61 (). There was significant difference of the sample means among the eight combinations of alleles (p < 0.01) (Supplemental Table S6, ). For each combination of alleles, the difference between the theoretical mean and the sample mean was non-significant (Supplemental Table S7). Depending on the analysis above, the allelic combination could be selected based on the breeding objective of PH, i.e. if the breeding objective of PH is 126.23 ∼ 137.17 cm, the allelic combination should be q1q2q3 and Q1q2q3, and if we hope to breed varieties with PH under 97.95 cm, the optimal allelic combination should be q1Q2Q3. In a similar way, we could choose an optimal allelic combination of QTL for a special environment.
Figure 3. Additive effects of QTL for PH and AED detected in two populations under two kinds of densities over two location.
In the name of QTL, 36- or 60- represent QTL detected in RIL3613 or RIL6013 population; D1 or D2 indicate QTL detected under the first or second kind of density; qph and qphae represent QTL of PH and AED; B1, I, …, represent linkage groups; the number, i.e., 1,2, 3,4 represent the sequence of QTL in one linkage group.
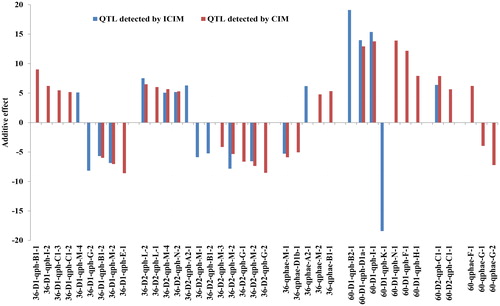
Figure 4. Additive effects of allelic combination of QTL qph-C1-3, qph-B1-2, qph-G-2 associated with PH at maturity stages.
Q1 and q1 represent allele of qph-C1-3 carried by Dongnong L13 and Heihe36, Q2 and q2 represent allele of qph- B1-2 carried by Dongnong L13 and Heihe36, Q3 and q3 represent allele of qph- G -2 carried by Dongnong L13 and Heihe36.
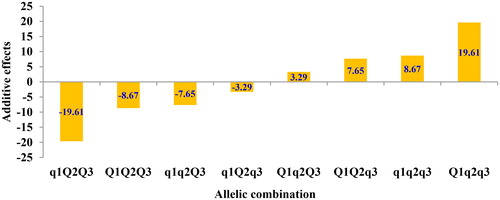
Figure 5. Theory and sample means of allelic combination of QTL qph-C1-3, qph-B1-2, qph-G-2 associated with PH at maturity stages.
Q1 and q1 represent allele of qph-C1-3 carried by Dongnong L13 and Heihe36, Q2 and q2 represent allele of qph-B1-2 carried by Dongnong L13 and Heihe36, Q3 and q3 represent allele of qph-G-2 carried by Dongnong L13 and Heihe36.
a, b, c indicate the significance of difference between the phenotype means of allelic combination, i.e., no same letter means difference between two allelic combination was significant at 0.05 level, the reverse is also true.
Conclusions
Fourteen, eight and eight QTL controlling PH, and five, two and one QTL associated with response of PH to density were detected at PBS, SFS and MS. The individual and cumulative actions of these QTL lead to difference in development and final PH. The QTL identified in the present research are of importance for the molecular breeding design of PH.
Disclosure statement
No potential conflict of interest was reported by the authors.
Correction Statement
This article has been republished with minor changes. These changes do not impact the academic content of the article.
Additional information
Funding
References
- Chapman A, Pantalone VR, Ustun A, et al. Quantitative trait loci for agronomic and seed quality traits in an F2 and F4:6 soybean population. Euphytica. 2003;129(3):387–393.
- Lee SH, Bailey MA, Mian MA, et al. Identification of quantitative trait loci for plant height, lodging, and maturity in a soybean population segregating for growth habit. Theoret Appl Genetics. 1996;92(5):516–523.
- Lee SH, Bailey MA, Mian MAR, et al. Molecular markers associated with soybean plant height, lodging, and maturity across locations. Crop Sci. 1996;36(3):728–735.
- Panthee DR, Pantalone VR, Saxton AM, et al. Quantitative trait loci for agronomic traits in soybean. Plant Breed. 2007;126(1):51–57.
- Wilcox JR, Sediyama T. Interrelationships among height, lodging and yield in determinate and indeterminate soybeans. Euphytica. 1981;30(2):323–326.
- Cober ER, Morrison MJ. Regulation of seed yield and agronomic characters by photoperiod sensitivity and growth habit genes in soybean. Theor Appl Genet. 2010;120(5):1005–1012.
- Jacobson J, Kassem MA. Genomic regions containing QTL for plant height, internodes length, and flower color in soybean[Glycine max (L.) Merr.]. BIOS. 2007;78:119–126.
- Neumann K, Kobiljski B, Dencic S, et al. Genome-wide association mapping: a case study in bread wheat. Mol Breed. 2011;27(1):37–58.
- Mansur LM, Orf JH, Chase K, et al. Genetic mapping of agronomic traits using recombinant inbred lines of soybean. Crop Sci. 1996;36(5):1327–1336.
- Mian MAR, Ashly DA, Vencil WK, et al. QTLs conditioning early growth in a soybean population segregating for growth habit. Theor Appl Genet. 1998;97:1210–1216.
- Liu Y, Li Y, Reif JC, et al. Identification of quantitative trait loci underlying plant height and seed weight in soybean. Plant Genome. 2013;6:841–856.
- Njiti VN, Meksem K, Iqbal MJ, et al. Common loci underlie field resistance to soybean sudden death syndrome in Forrest, Pyramid, Essex, and Douglas. Theor Appl Genet. 2002;104(2):294–300.
- Orf JH, Chase K, Adler FR, et al. Genetics of soybean agronomic traits: II. Interactions between yield quantitative trait loci in soybean. Crop Sci. 1999;39(6):1652–1657.
- Sun D, Li W, Zhang Z, et al. Quantitative trait loci analysis for the developmental behavior of soybean (Glycine max L. Merr.). Theor Appl Genet. 2006;112(4):665–673.
- Wang D, Graef GL, Procopiuk AM, et al. Identification of putative QTL that underlie yield in interspecific soybean backcross populations. Theor Appl Genet. 2004;108(3):458–467.
- Yang Q, Wang JL. The analysis of genetic parameter for different types of soybean by diallel crosses. Sci Agric Sin. 1995;28:76–80.
- Lam H, Xu X, Liu X, et al. Resequencing of 31 wild and cultivated soybean genomes identifies patterns of genetic diversity and selection. Nat Genet. 2010;42(12):1053–1059.
- Sun YN, Luan HH, Qi ZM, et al. Mapping and Meta-Analysis of Height QTLs in Soybean. Legum Genom Genet . 2012;3:1–7.
- Tanksley SD. Mapping polygenes. Annu Rev Genet. 1993;27(1):205–233.
- Zhang W, Wang Y, Luo G, et al. QTL mapping of ten agronomic traits on the soybean ( Glycine max L. Merr.) genetic map and their association with EST markers. Theor Appl Genet. 2004;108(6):1131–1139.
- Diers BW, Specht J, Rainey KM, et al. Genetic architecture of soybean yield and agronomic traits. G3 Genes Genomes Genet.. 2018;8(10):3367–3375.
- Xue H, Tian X, Zhang K, et al. Mapping developmental QTL for plant height in soybean [Glycine max (L.) Merr.] using a four-way recombinant inbred line population. PLoS One. 2019;14(11):e0224897.
- Su D, Jiang S, Wang J, et al. Identification of major QTLs associated with agronomical traits and candidate gene mining in soybean. Biotechnol Biotechnol Equip. 2019;33(1):1481–1493.
- Wu W, Li W, Tang D, et al. Time-related mapping of quantitative trait loci underlying tiller number in rice. Genetics. 1999;151(1):297–303.
- Yan J, Zhu J, He C, et al. Molecular dissection of developmental behaviour of plant height in rice (Oryza sativa L.). Genetics. 1998;150(3):1257–1265.
- Doss BD, Thurlow DL. Irrigation, row width, and plant population in relation to growth characteristics of two soybean varieties. Agron J. 1974;66(5):620–623.
- Johnson BJ, Harris HB. Influence of plant population on yield and other characteristics of soybeans. Agron J. 1967;59(5):447–449.
- Shafshak SE, Hassan MZ, Mohamed MSA. Evaluation of six soybean genotypes under different population densities and two sowing dates. Ann Agric Sci Moshtohor. 1997;12:652–654.
- Shamsi K, Kobraee S. Effect of plant density on the growth, yield and yield components of three soybean varieties under climatic conditions of Kermanshah, Iran. J Animal Plant Sci. 2009;2:96– 99.
- Weber CR, Shibles RM, Byth DE. Effect of plant population and row spacing on soybean development and production. Agron J. 1966;58(1):99–102.
- Kassem M, Shultz J, Meksem K, et al. An updated ‘Essex’ by ‘Forrest’ linkage map and first composite map of QTL underlying six soybean traits. Theor Appl Genet. 2006;113(6):1015–1026.
- Ning H, Yuan J, Dong Q, et al. Identification of QTL related to the vertical distribution and seed-set of pod number in soybean [Glycine max (L.) Merri]. PLoS One. 2018;13(4):e0195830.
- Fehr WR, Caviness CE. Stages of soybean development. Cooperative extension service: agriculture and home economics experiment station. Vol 80. Ames (IA): Iowa state university. 1997;p. 11.
- Zhu J. Analysis of conditional genetic effects and variance components in developmental genetics. Genetics. 1995;141(4):1633–1639.
- Li H, Ye G, Wang J. A modified algorithm for the improvement of composite interval mapping. Genetics. 2007;175(1):361–374.
- Zeng ZB. Precision mapping of quantitative trait loci. Genetics. 1994;136(4):1457–1468.
- Mackay I, Powell W. Methods for linkage disequilibrium mapping in crops. Trends Plant Sci. 2007;12(2):57–63.
- Pillen K, Zacharias A, Léon J. Advanced backcross QTL analysis in barley (Hordeum vulgare L). Theor Appl Genet. 2003;107(2):340–352.
- Ravi K, Vadez V, Isobe S, et al. Identification of several small main-effect QTLs and a large number of epistatic QTLs for drought tolerance related traits in groundnut . Theor Appl Genet. 2011;122(6):1119–1132.
- Würschum T, Liu W, Busemeyer L, et al. Mapping dynamic QTL for plant height in triticale. BMC Genet. 2014;15(1):59.
- Busemeyer L, Ruckelshausen A, Möller K, et al. Precision phenotyping of biomass accumulation in triticale reveals temporal genetic patterns of regulation. Sci Rep. 2013;3(1):2442.
- Song QJ, Marek LF, Shoemaker RC, et al. A new integrated genetic linkage map of the soybean. Theor Appl Genet. 2004;109(1):122–128.
- Lark KG, Chase K, Adler F, et al. Interactions between quantitative trait loci in soybean in which trait variation at one locus is conditional upon a specific allele at another. PNAS. 1995;92(10):4656–4660.
- Lee S, Jun TH, Andrew P, et al. SNP markers linked to QTL conditioning plant height, lodging, and maturity in soybean. Euphytica. 2015;203(3):521–532.
- El-Badawy MEM, Mehasen SAS. Correlation and path coefficient analysis for yield and yield components of soybean genotypes under different planting density. Asian J Crop Science. 2012;4(4):150–158.
- Guzman PS, Diers BW, Neece DJ, et al. QTL Associated with Yield in Three Backcross-Derived Populations of Soybean. Crop Sci. 2007;47(1):111–122.
- Mansur LM, Lark KG, Kross H, et al. Interval mapping of quantitative trait loci for reproductive, morphological, and seed traits of soybean (Glycine max L.). Theoret Appl Genetics. 1993;86(8):907–913.
- Specht JE, Chase K, Macrander M, et al. Soybean response to water: a QTL analysis of drought tolerance. Crop Sci. 2001;41(2):493–509.
- Gai J, Wang Y, Wu X, et al. A comparative study on segregation analysis and QTL mapping of quantitative traits in plants-with a case in soybean. Front Agric China. 2007;1(1):1–7.
- Kim KS, Diers BW, Hyten DL, et al. Identification of positive yield QTL alleles from exotic soybeam germplasm in two backcross populations. Theor Appl Genet. 2012;125(6):1353–1369.
- Chen Q-s, Zhang Z-c, Liu C-y, et al. QTL analysis of major agronomic traits in soybean. J Integr Agric. 2007;6(4):399–405.
- Kabelka EA, Diers BW, Fehr WR, et al. Putative alleles for increased yield from soybean plant introductions. Crop Sci. 2004;44(3):784–791.