
Abstract
The PEBP family members are reported to play important roles in plant flowering and reproductive organ formation. However, this gene family has not been identified nor their functions have been analyzed in Brassica oleracea. In this study, 10 PEBP genes were identified in the B. oleracea genome. These genes were categorized as TFL1, FT and MFT subfamilies according to the phylogeny and gene structure analysis. All the 10 PEBP genes were randomly distributed on seven of the nine chromosomes in B. oleracea. The expression profiles of the 10 PEBP genes in different tissues of cauliflower were evaluated through quantitative Real-Time polymerase chain reaction (qRT-PCR), and we found that FT and TFL1 genes tend to be expressed in reproductive organs and at high levels in the meristem, whereas the MFT genes showed no or very low expression in all tested tissues. Notably, the five TFL1 genes might be sub-functionalized in cauliflower. Bol026421 and Bol032920 were specifically expressed in SAMbr, maintaining the indeterminate growth of shoot apical meristem, whereas the other three genes (Bol015337, Bol005471 and Bol010027) were highly expressed in curd stages. Highly expressed TFL1 group genes with low mRNA levels of the flowering-promoting genes (FT, TSF), might be one of the important reasons of curd formation in cauliflower. Generally, the results obtained in this study will help further studies on the roles of PEBP genes during curd development and flowering initiation, leading to crop improvement.
Introduction
Floral initiation is an important developmental event in plants, which is regulated by endogenous and environmental factors, marking the transition from vegetative to reproductive growth. So far, Arabidopsis flowering regulation research has been the most productive and a series of flowering-related genes have been identified [Citation1]. These genes are mainly involved in five flowering pathways, including vernalization, photoperiod, ambient temperature, plant hormone (gibberellin) and autonomy [Citation2–5]. Although different genes participate in different flowering regulation pathways, each pathway is coordinated by several key genes, such as FT (FLOWERING LOCUS T), LFY (LEAFY), FLC (FLOWERING LOCUS C), CO (CONSTANS) and SOC1 (SUPPRESSOR OF OVEREXPRESSION OF CONSTANS1) [Citation6].
The FT gene encodes a long-distance mobile signaling protein called “florigen”, which plays a central role in flowering regulation [Citation3,Citation7,Citation8]. This gene belongs to the phosphatidylethanolamine-binding protein (PEBP) gene family, which exists in all kingdoms of life [Citation9]. A total of six PEBP members have been found in Arabidopsis, including FT, TSF (Twin Sister of FT)], TFL1 (Terminal Flower 1), BFT ( Brother of FT and TFL1), ATC (Arabidopsis thaliana CENTRORADIALIS homologue)] and MFT ( Mother of FT and TFL1) [Citation10–13]. FT protein is synthesized in leaves and then transported through the phloem to the shoot apical meristem (SAM). In the SAM, FT binds to FD (a bZIP transcription factor) and 14-3-3 proteins, forming a flowering activation complex, which up-regulates the expression of flowering time genes including APETALA 1 (AP1) and FRUITFULL (FUL) [Citation14]. TSF is an ortholog of FT with similar functions and belongs to the FT-like subfamily. In Arabidopsis, over-expression of TSF also leads to early flowering [Citation15]. TFL1 has an amino acid sequence that is highly similar to FT but with the opposite function, inhibition of the floral primordial formation and delay flowering [Citation16,Citation17]. The ATC and the BFT genes also belong to the TFL1 subfamily. The over-expression of the ATC gene can complement the late flower phenotype of the tfl1 mutant, but the atc mutant has no obvious phenotype, indicating its redundant functions with TFL1 [Citation18]. The BFT gene has been reported to function in a TFL1-like manner as a repressor of flowering [Citation19]. The MFT subfamily has just one gene, MFT, which is mainly expressed in seeds and plays important roles in seed development and germination by regulating ABA and GA signaling pathways [Citation20].
To date, members of the PEBP family have also been identified in other plant species, such as tobacco [Citation21], maize [Citation22], rice [Citation23–25], poplar [Citation26,Citation27], soybean [Citation28,Citation29] and so on. Many members of this gene family show conserved functions as in Arabidopsis, whereas some species-specific functions have also been detected. For example, the potato (Solanum tuberosum) [Citation30] and onion (Allium cepa) [Citation31] FT homologs, StSP6a and AcFT1/4, function in photoperiod-sensitive tuberization and bulb formation, respectively. Cauliflower is an important Brassica oleracea vegetable planted worldwide [Citation32]. It has a specific white flower curd, consisting of a large number of shortened branches of indeterminate inflorescences [Citation33]. So far, the molecular mechanism of cauliflower curd formation is unclear. Despite the importance of the question whether the PEBP members are also related to the formation of cauliflower curd, there have been no relevant research reports. In this study, we firstly identified all the potential PEBP members from the Brassica oleracea genome databases. The phylogenetic relationships, chromosomal locations, gene structure and motifs of the PEBP proteins were analyzed. Moreover, we studied their expression patterns on a large range of cauliflower tissues. This work not only helps us to further clarify the biological functions of the PEBP family members, but also provides a lot of useful information regarding for the molecular mechanism underlying the curd formation of cauliflower.
Materials and methods
Database search and identification of PEBP family genes
The genome sequences of three Brassica species, B. oleracea, B. rapa and B. napus were downloaded from the respective databases, http://www.ocri-genomics.org/bolbase/, http://brassicadb.org/brad/index.php and http://www.genoscope.cns.fr/brassicanapus/. The sequences of Arabidopsis PEBP proteins were obtained from http://www.arabidopsis.org and used as BLASTP queries through the above three Brassica genome databases. All the candidate proteins were examined by SMART (http://smart.embl-heidelberg.de) and Pfam (http://pfam.sanger.ac.uk) to further confirm the presence of the conserved PEBP domain (PF01161). The sequences without or with an incomplete PEBP domain were deleted.
Phylogenetic tree construction
Two phylogenetic trees were constructed in this study. One was for the PEBP proteins from B. oleracea and A. thaliana and the other was the inclusion of B. oleracea, B. rapa, B. napus and A. thaliana. The sequences of the PEBP proteins from different species were aligned using ClustalW with default settings. Subsequently, the alignment data were imported into MEGA6.0 to construct the phylogenetic trees using the neighbor-joining method. The parameter setting of bootstrap analysis was adjusted to 1000 replications.
Conserved motifs and gene structure analysis of PEBP proteins
The program Multiple Em for Motif Elicitation (http://meme-suite.org/tools/meme) was used to investigate the conserved motifs in three Brassica PEBP protein sequences. Except for the maximum number of motifs, which was set to 10, the other parameters had the default values. The PEBP genes structure was identified by the program of GSDS2.0 (Gene Structure Display Server, http://gsds.cbi.pku.edu.cn/).
Chromosomal location and gene duplication
The physical locations of PEBP genes along each chromosome were obtained from the B. oleracea genomics database. According to previous studies, the occurrence of gene duplication events was considered to meet the following criteria: (1) the query coverage rate of the longer gene was more than 80%; (2) the alignment identity of two genes was more than 85%. Two duplicated genes with a physical distance of less than 50 kb are considered tandem duplication pairs. The Plant Genome Duplication Database (http://chibba.agtec.uga.edu/duplication) was used to identify the segmental duplication genes.
Plant materials
A late-flowering accession of cauliflower (BC4229) was used in this study. Two sets of tissues were selected for quantitative Real-Time (qRT)-PCR analysis. One set contained seven types of tissues including root, stem, leaf, curd, bud, flower and silique. Another set of tissues included shoot apical meristem at the seedling stage with three true leaves before vernalization (SAMbv) and curd at four developmental stages after vernalization. Curd stage 1–4 (CS1–4) indicates a period in which the diameter of the curd is about 7 (curd emergence), 13 (mid-curd growth), 17 (curd maturity) and 26 cm (curd bolting period), respectively. All samples were frozen immediately in liquid nitrogen and stored in −80 °C.
QRT-PCR analysis
Specific primers for all PEBP CDS sequences were designed using Primer-Blast online software from NCBI (). An RNA kit (RNAprep Pure Plant Kit, Tiangen, China) was used to isolate the total RNA of the frozen samples according to the manufacturer’s instructions. First-strand cDNA was synthesized from 1 mg of total RNA using PrimeScript RT reagent Kit. QRT-PCR assays were carried out using ABI StepOne Plus machine with SYBR® Premix Ex Taq™ (TaKaRa, Japan). A 25 μL reaction mixture was used with 20-50 ng of first-strand cDNA products, 12.5 μL of 2 × SYBR Green PCR Master Mix (Applied Biosystems) and 500 nmol of each primer. The PCR program was 95 °C for 10 min, then 40 cycles of 10 s at 95 °C, 60 °C for 15 s, and 72 °C for 30 s. The amplification efficiency of each primer pair was estimated from calibration curves produced by continuous dilution of cDNAs. Two stably expressed genes BoACT and BoEF1a in cauliflower were selected as reference genes. The relative expression levels of each gene were calculated by the 2−ΔCt value. Three biological and three technical replicates were carried out on each sample.
Table 1. PEBP gene family identified in Brassica oleracea.
Results and discussion
Identification and phylogenetic analysis of PEBP family genes in Brassica oleracea
With the release of the sequencing data of B. napus, B. rapa and B. oleracea genomes, the genetic and molecular functions of Brassica crops have entered a new era. Cauliflower is an important Brassica oleracea vegetable grown worldwide. Curd development and bloom time are important agronomic traits in cauliflower breeding and production [Citation34]. The PEBP family genes are relatively conserved and play important roles in plant flowering, seed development and germination. Characterization and function studies have been previously reported on several Cruciferous crops including A. thaliana [Citation10], B. napus [Citation35,Citation36] and B. rapa [Citation37], but not B. oleracea. In this study, a total of 10 PEBP family genes with a complete PEBP domain were identified in the B. oleracea genome using Name and HMM analysis. Details on locus name, chromosome location, coding sequence (CDS) length, protein length and molecular weight, intron number, and protein isoelectric point (pI) are listed in .
The overall variation of CDS length, protein length and molecular weight was relatively narrow, ranging from 471 (Bol017639) to 609 bp (Bol039209), 156 to 202 aa and 17.76 to 22.9 kDa, respectively. The pI values ranged from 7.5 (Bol012573) to 10.13 (Bol015337).
Phylogenetic analysis of PEBP family genes in Brassica oleracea
An unrooted N-J phylogenetic tree was constructed based on the sequence of PEBP proteins from B. oleracea and A. thaliana (). The B. oleracea PEBP members were classified into three categories, including TFL1, FT and MFT. The TFL1 subfamily was the largest, possessing 5 genes, whereas the FT and MFT subfamilies contained three and two genes, respectively. Compared to A. thaliana, the genes of these three subfamilies were expanded by gene duplication, and the TFL1 subfamily had the highest expansion degree. A new Arabidopsis PEBP gene named AT5G01300.1 was identified because it contains a complete PEBP conserved domain, which was defined as FT-like subgroup. However, this branch gene has no paralogs in the B. oleracea genome.
Figure 1. Phylogenetic tree of PEBP genes from A. thaliana and B. oleracea (a), B. rapa, B. napus (b) using the neighbor-joining method.
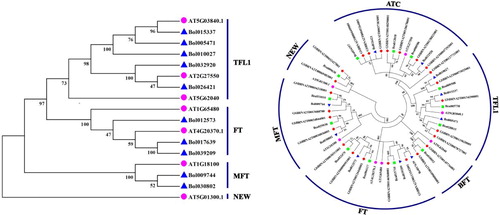
The polyploidization event is the main driving force for gene family expansion [Citation38,Citation39]. After polyploidization, the number of genes increases exponentially. Compared with A. thaliana, B. oleracea plants experienced an extra recent whole-genome triplication (WGT) event [Citation40]. In this study, 10 PEPB genes were identified in the genomes of B. oleracea, which is much less than the number of Arabidopsis genes after triploidization. The causes of this phenomenon may be chromosome rearrangements and gene loss after genomic duplication to maintain a metabolic balance [Citation41].
In order to explore the evolution pattern of the B. oleracea PEBP genes in Brassica crops, another phylogenetic tree was also constructed with the PEBP protein sequences from A. thaliana and three Brassica species including B. oleracea, B. rapa and B. napus (). In general, most PEBP members in the three Brassica species showed expansion compared to those from A. thaliana except for the newly identified FT-like branch, which contained just one and two PEBP genes from B. rapa and B. napus, respectively. In the two subfamilies of MFT and FT, the number of PEBP genes present in B. napus was approximately equal to the sum of the number of PEBP genes in B. oleracea and B. rapa. However, 16 B. napus TFL1 genes were identified, which is much more than the sum of B. oleracea and B. rapa TFL1 genes.
Brassica napus is formed by natural hybridization of B. rapa and B. oleracea about 7 500–12,500 years ago [Citation42]. In the present report, 25 PEBP genes were identified in B. napus, which is more or less the sum of the genes in B. rapa and B. oleracea. Reduced probability of gene loss in the rapeseed genome might be due to the short evolutionary time and the buffering effect of polyploids on the heterologous genomes.
Conserved motifs and gene structure analysis of PEBP members
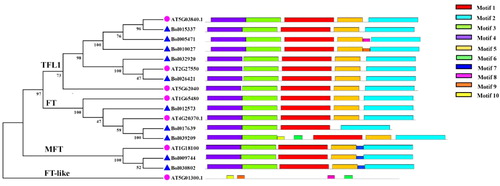
The Intron-Exon structure patterns of B. oleracea PEBP genes were investigated by alignment of their full-length cDNA and genomic DNA sequences. Overall, the structural differences in PEBP genes between different subgroups were similar. Seven PEBP genes contained 3 introns and the other three genes consisted of 4 introns ().
The MEME online software was previously reported to be used to identify conserved motifs of different protein sequences [Citation43,Citation44]. shows the PEBP protein structures from B. oleracea and A. thaliana investigated by MEME. Ten motifs were identified with 6 to 50 amino acids in length. Motifs 1 to 5 were present in all B. oleracea PEBP proteins, except for Bol017639, which contained just motifs 1-4, lacking 5. Bol005471 and Bol010027 contained the sixth motif 8 and 9, respectively. Bol009744 and Bol030802 have another identical motif 7. Bol039209 contained two additional motifs of 6 and 10. In the Arabidopsis genome, all PEBP proteins contained motif 1 to 5 except AT5G01300.1, which had a completely different motif structure.
Figure 2. Conserved motifs distribution of PEBP proteins from B. oleracea and A. thaliana using MEME.
Chromosomal location and gene duplication of PEBP members
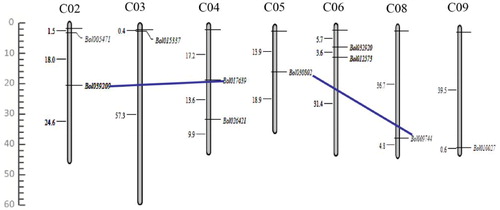
The physical distributions of the ten PEBP genes were mapped to B. oleracea chromosomes. It is well known that the B. oleracea genome has a total of 9 chromosomes, 7 of which contained PEBP genes, except for chromosomes 1 and 7 (). Chromosome 2, 4, and 6 each harbored two PEBP genes, whereas each of the remaining four chromosomes (chromosome 3, 5, 8, and 9) possessed only one PEBP gene. Notably, two segmental duplication groups were identified by the PGDD database. A duplicated segment of the Bol039209 region in the middle of chromosome 2 was present in a similar location of chromosome 4, where Bol017639 was located. The region of Bol030802 on chromosome 5 had a segmental duplication (Bol009744), which was present on chromosome 8. However, no tandem-duplicated paralogous genes were found in B. oleracea PEBP members.
Figure 3. Distribution of B. oleracea PEBP genes on seven chromosomes.
Chromosome numbers are written as C01 to C09 above each chromosome. Tandemly duplicated genes are shown by black vertical lines. The size of each chromosome was estimated as Mb on the left side of the figures.
Expression patterns of PEBP genes in different cauliflower tissues
The PEBP members have been reported to play important roles in protein recognition and signal transduction during plant flowering. Therefore, the expression patterns of 10 B. oleracea PEBP genes were evaluated by qRT-PCR in the following cauliflower tissues: root, stem, leaf, curd, bud, flower and silique (). Six genes were expressed in at least one tissue, whereas the other 4 genes showed no or very low expression.
Figure 4. Expression patterns of PEBP genes in cauliflower tissues of root, stem, leaf, curd, bud, flower, and silique (a) by qRT-PCR (b). A1, The tissues of root, stem and leaf from 25-day-old plant; A2, The curd 80 days after transplanting; A3, The bud 100 days after transplanting; A4, The fully opened flowers during the flowering period; A5, The siliques 25 days after pollination. The standard deviations of three biological replicates are represented by the error bars.
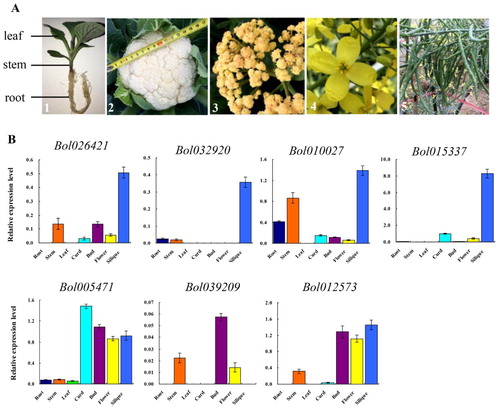
Two MFT (Bol030802 and Bol009744) and FT (Bol017639 and Bol039209) groups of genes showed no or very low expression at the mRNA level in all tested tissues. The third FT gene (Bol012573) was expressed in the tissues of stem, bud, flower and silique. The TFL1 group of genes had the most diverse expression patterns. Bol026421 had a certain level of expression in the tissues of stem, bud, and silique tissues, whereas Bol032920 was specifically expressed in silique. Bol010027 mRNA was detected in all tested tissues except leaf. Bol015337 and Bol005471 are biased to be expressed in the reproductive organs and had the highest levels of transcription in tissues of silique and curd tissues, respectively.
The PEBP gene family is cataloged into three subfamilies, of which the FT and TFL1 genes are the most studied, and their functions are relatively clear [Citation5, Citation45]. In plants, FT promotes the transition from vegetative growth to reproductive development and subsequent flowering, whereas TFL1 represses this transition [Citation11, Citation46]. However, there is little understanding of the MFT genes function in plants, perhaps acting redundantly with FT [Citation47]. In cauliflower, one FT (Bol017639) and two MFT (Bol030802 and Bol009744) homologous genes showed no or very low expression in all tested tissues, indicating no participation or redundancy. The other genes presented higher expression levels in reproductive organs than in vegetative tissues. Notably, in curd, three TFL1 genes showed high expression levels and two FT genes were hardly expressed, whereas in the flower organ, the expression patterns of the two groups of genes were just the opposite. Curd is the special reproductive organ of cauliflower and is composed of inflorescence meristems. The highly expressed TFL1 genes might inhibit the expression of the flower-promoting FT genes, thereby promoting the continuous division and growth of the inflorescence meristem, and finally curd formation.
The TFL1 genes were usually expressed in the apical meristem of the vegetative growth and inflorescence growth stages to maintain the infinity of the SAM and the inflorescence meristem, thereby regulating the processes of vegetative and reproductive growth [Citation17]. In the present study, five TFL1 group genes were all expressed in silique, especially Bol015337 showed the highest expression level. Therefore, in cauliflower, the TFL1 group genes formed by polyploidization had new functionalization during evolution, which might play a role in silique or seed development.
PEBP genes involved in cauliflower curd development
In order to further explore the roles of PEBP genes in curd formation of cauliflower, we also analyzed their expression patterns in the tissues of SAM before vernalization (SAMbr) and curd at different developmental stages (CS1 ∼ 4) by qRT-PCR (). The results indicated that two MFT group genes (Bol030802 and Bol009744) and three FT group genes (Bol017639, Bol039209 and Bol012573) showed no or very low expression in all tested tissues. Two TFL1/ATC-like genes (Bol026421 and Bol032920) displayed similar expression modes, which were both specifically expressed in SAMbr. Moreover, Bol026421 showed the highest transcription levels in SAMbr. Three TFL1/TFL-like genes had different expression patterns. Bol010027 and Bol015337 were both expressed in all tested tissues except for SAMbr and the overall transcription level of Bol015337 was higher than that of Bol010027. Bol005471 was widely and highly expressed in all tested tissues with a tendency to gradually decrease in the four curd development periods including CS1 to CS4.
Figure 5. Expression profiles of B. oleracea PEBP genes in SAM before vernalization (SAMbr) and curd at different developmental stages (CS1 ∼ 4) (a and b) by qRT-PCR(c) analysis. A/B1, SAMbr; A/B2-5 correspond to the curd different developmental stages (CS1 ∼ 4). The standard deviations of three biological replicates are represented by the error bars.
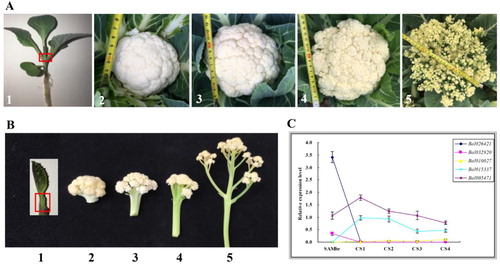
Previous studies had reported that the curd formation of cauliflower could be related to BoCAL and BoAP1 genes, and the bocal mutant allele was really present in cauliflower [Citation48,Citation49]. However, other studies had detected only a weak relationship between cauliflower arrest and boap1/bocal mutations [Citation50,Citation51]. In addition, Lan and Paterson reported that the curd phenotype was multi-gene controlled [Citation52]. Overall, the molecular mechanism of cauliflower curd formation is still unclear. In this study, the results of the expression analysis indicated that five TFL1 group genes were sub-functionalized in cauliflower. Bol026421 and Bol032920 were specifically expressed in SAMbr, maintaining the infinity of vegetative growth. Compared with Bol026421, Bol032920 expressed in a very low amount and might be redundant. The other three TFL1 genes were all expressed in the four developmental stages of curd, but the expression abundance was different, among which Bol010027 was the lowest, Bol015337 was the second, and Bol005471 was the highest. Interestingly, the expression levels of Bol015337 and Bol005471 decreased as the curd developmental period progressed. Therefore, we hypothesized that the high expression of the TFL1 genes in curd inhibited the expression of the flowering induction genes (FT, TSF), whose transcripts were almost undetectable in the tissues of CS1 to CS4, thus ensuring the continuous growth of the inflorescence meristem. However, this inhibition was steadily weakening. When a threshold of the inhibition was broken, the flowering genes would initiate expression, thereby promoting flowering.
Conclusions
The PEBP family members were key flowering regulatory genes, which played important roles in plant flowering, reproductive organ formation and seed development. In the present paper, we focused on the B. oleracea PEBP gene family, which encodes PEBP proteins and is involved in curd development and flowering initiation in cauliflower. Ten PEBP genes were identified in the B. oleracea genome. A WGT event contributed to the expansion of B. oleracea PEBP gene family, but subsequent natural evolution and artificial selection caused partial loss of the amplified genes. The phylogenetic relationships, chromosomal locations and gene structures of the identified PEBP genes were also comprehensively analyzed. Moreover, those genes showed different expression patterns in different tissues and curd stages. Based on the preliminary analysis results, we hypothesized that high expression of the TFL1 genes in curd inhibited the transcriptional level of the flowering-promoting genes (FT, TSF), which might be one of the important reasons of curd formation in cauliflower. Generally, our analysis of the B. oleracea PEBP gene family provided useful information for understanding the molecular regulation of curd formation and flower development, and further functional characterization of those genes in cauliflower.
Supplemental Material
Download PDF (107.7 KB)Acknowledgements
The authors are grateful to Dr Wan Hongjian of Zhejiang Academy of Agricultural Sciences, Hangzhou, China, for providing guidance on the use of analysis tools.
Disclosure statement
No potential conflict of interest was reported by the author(s).
Additional information
Funding
References
- Bouché F, Lobet G, Tocquin P, et al. FLOR-ID: an interactive database of flowering-time gene networks in Arabidopsis thaliana. Nucleic Acids Res. 2016;44(D1):D1167–D1171.
- Amasino R. Seasonal and developmental timing of flowering. Plant J. 2010;61(6):1001–1013.
- Andres F, Coupland G. The genetic basis of flowering responses to seasonal cues. Nat Rev Genet. 2012;13(9):627–639.
- Blazquez MA, Ahn JH, Weigel D. A thermosensory pathway controlling flowering time in Arabidopsis thaliana. Nat Genet. 2003;33(2):168–171.
- Bradley D, Ratcliffe O, Vincent C, et al. Inflorescence commitment and architecture in Arabidopsis. Science. 1997;275(5296):80–83.
- Roux F, Touzet P, Cuguen J, et al. How to be early flowering: an evolutionary perspective. Trends Plant Sci. 2006;11(8):375–381.
- Fang M, Zhou Z, Zhou X, et al. Overexpression of OsFTL10 induces early flowering and improves drought tolerance in Oryza sativa L. PeerJ. 2019;7:e6422
- Shan H, Cheng J, Zhang R, et al. Developmental mechanisms involved in the diversification of flowers. Nat Plants. 2019;5(9):917–923.
- Turck F, Fornara F, Coupland G. Regulation and identity of florigen: FLOWERING LOCUS T moves center stage. Annu Rev Plant Biol. 2008;59:573–594.
- Fornara F, de Montaigu A, Coupland G. SnapShot: control of flowering in Arabidopsis. Cell. 2010;141(3):550–550.e2.
- Kardailsky I, Shukla VK, Ahn JH, et al. Activation tagging of the floral inducer FT. Science. 1999;286(5446):1962–1965.
- Karlgren A, Gyllenstrand N, Källman T, et al. Evolution of the PEBP gene family in plants: functional diversification in seed plant evolution. Plant Physiol. 2011;156(4):1967–1977.
- Mátyás KK, Hegedűs G, Taller J, et al. Different expression pattern of flowering pathway genes contribute to male or female organ development during floral transition in the monoecious weed Ambrosia artemisiifolia L. (Asteraceae). PeerJ. 2019;7:e7421
- Yoo SC, Chen C, Rojas M, et al. Phloem long-distance delivery of FLOWERING LOCUS T (FT) to the apex. Plant J. 2013;75(3):456–468.
- Chautard H, Jacquet M, Schoentgen F, et al. Tfs1p, a member of the PEBP family, inhibits the Ira2p but not the Ira1p Ras GTPase-activating protein in Saccharomyces cerevisiae. Eukaryotic Cell. 2004;3(2):459–470.
- Ahn JH, Miller D, Winter VJ, et al. A divergent external loop confers antagonistic activity on floral regulators FT and TFL1. Embo J. 2006;25(3):605–614.
- Hanano S, Goto K. Arabidopsis TERMINAL FLOWER1 is involved in the regulation of flowering time and inflorescence development through transcriptional repression. Plant Cell. 2011;23(9):3172–3184.
- Huang N, Jane W, Chen J, et al. Arabidopsis thaliana CENTRORADIALIS homologue (ATC) acts systemically to inhibit floral initiation in Arabidopsis. Plant J. 2012;72(2):175–184.
- Yoo SJ, Chung KS, Jung SH, Yoo SY, et al. BROTHER OF FT AND TFL1 (BFT) has TFL1-like activity and functions redundantly with TFL1 in inflorescence meristem development in Arabidopsis. Plant J. 2010;63(2):241–253.
- Xi W, Liu C, Hou X, et al. MOTHER OF FT AND TFL1 regulates seed germination through a negative feedback loop modulating ABA signaling in Arabidopsis. Plant Cell. 2010;22(6):1733–1748.
- Harig L, Beinecke FA, Oltmanns J, et al. Proteins from the FLOWERING LOCUS T-like subclade of the PEBP family act antagonistically to regulate floral initiation in tobacco. Plant J. 2012;72(6):908–921.,
- Meng X, Muszynski MG, Danilevskaya ON. The FT-Like ZCN8 gene functions as a floral activator and is involved in photoperiod sensitivity in maize. Plant Cell. 2011;23(3):942–960.
- Cai Y, Chen X, Xie K, et al. Dlf1, a WRKY transcription factor, is involved in the control of flowering time and plant height in rice. PLoS One. 2014;9(7):e102529
- Wu C, You C, Long T, et al. RID1, encoding a Cys2/His2-type zinc finger transcription factor, acts as a master switch from vegetative to floral development in rice. Proc Natl Acad Sci USA. 2008;105(35):12915–12920.
- Wu W, Zheng XM, Lu G, et al. Association of functional nucleotide polymorphisms at DTH2 with the northward expansion of rice cultivation in Asia. Proc Natl Acad Sci USA. 2013;110(8):2775–2780.
- Hsu CY, Adams JP, Kim H, et al. FLOWERING LOCUS T duplication coordinates reproductive and vegetative growth in perennial poplar. Proc Natl Acad Sci USA. 2011;108(26):10756–10761.
- Mohamed R, Wang CT, Ma C, et al. Populus CEN/TFL1 regulates first onset of flowering, axillary meristem identity and dormancy release in Populus. Plant J. 2010;62(4):674–688.
- Li Q, Fan C, Zhang X, et al. Identification of a soybean MOTHER OF FT and TFL1 homolog involved in regulation of seed germination. PLoS One. 2014;9(6):e99642
- Nan H, Cao D, Zhang D, et al. GmFT2a and GmFT5a redundantly and differentially regulate flowering through interaction with and upregulation of the bZIP transcription factor GmFDL19 in soybean. PLoS One. 2014;9(5):e97669
- Navarro C, Abelenda JA, Cruz-Oró E, Cuéllar CA, et al. Control of flowering and storage organ formation in potato by FLOWERING LOCUS T. Nature. 2011;478(7367):119–122.
- Lee R, Baldwin S, Kenel F, et al. FLOWERING LOCUS T genes control onion bulb formation and flowering. Nat Commun. 2013;4:2884.
- Picchi V, Migliori C, Scalzo RL, et al. Phytochemical content in organic and conventionally grown Italian cauliflower. Food Chem. 2012;130(3):501–509.
- Zhao ZQ, Gu HH, Sheng XG, et al. Genome-wide single-nucleotide polymorphisms discovery and high-density genetic map construction in cauliflower using specific-locus amplified fragment sequencing. Front Plant Sci. 2016;7:334
- Sheng XG, Zhao ZQ, Wang JS, et al. Genome wide analysis of MADS-box gene family in Brassica oleracea reveals conservation and variation in flower development. BMC Plant Biol. 2019;19(1):106
- Schiessl S, Samans B, Hüttel B, et al. Capturing sequence variation among flowering-time regulatory gene homologs in the allopolyploid crop species Brassica napus. Front Plant Sci. 2014;5:404
- Schiessl S, Huettel B, Kuehn D, et al. Targeted deep sequencing of flowering regulators in Brassica napus reveals extensive copy number variation. Sci. Data. 2017;4:170013.
- Zhang X, Meng L, Liu B, et al. A transposon insertion in FLOWERING LOCUS T is associated with delayed flowering in Brassica rapa. Plant Sci. 2015;241:211–220.
- Doyle JJ, Flagel LE, Paterson AH, Rapp RA, et al. Evolutionary genetics of genome merger and doubling in plants. Annu Rev Genet. 2008;42:443–461.
- Otto SP, Whitton J. Polyploid incidence and evolution. Annu Rev Genet. 2000;34:401–437.
- Liu SY, Liu YM, Yang XH, et al. The Brassica oleracea genome reveals the asymmetrical evolution of polyploid genomes. Nat Commun. 2014;5:3930
- Nakano T, Suzuki K, Fujimura T, et al. Genome-wide analysis of the ERF gene family in Arabidopsis and rice. Plant Physiol. 2006;140(2):411–432.
- Chalhoub B, Denoeud F, Liu SY, et al. Plant genetics. Early allopolyploid evolution in the post-Neolithic Brassica napus oilseed genome. Science. 2014;345(6199):950–953.
- Feng CY, Chen ZF, Pei LL, et al. Genome-wide identification, phylogeny, and expression analysis of the CA gene family in tomato. Biotechnol Biotec Eq. 2020;34(1):70–83.
- Teng RM, Wang YX, Wang WL, et al. Genome-wide identification, classification and expression pattern of LBD gene family in Camellia sinensis. Biotechnol Biotec Eq. 2018;32(6):1387–1397.
- Li Z, Jiang D, He Y. FRIGIDA establishes a local chromosomal environment for FLOWERING LOCUS C mRNA production. Nat Plants. 2018;4(10):836–846.
- Kobayashi Y, Kaya H, Goto K, et al. A pair of related genes with antagonistic roles in mediating flowering signals. Science. 1999;286(5446):1960–1962.
- Yoo S, Kardailsky I, Lee JS, et al. Acceleration of flowering by over-expression of MFT (MOTHER OF FT AND TFL1). Mol Cells. 2004;17:95–101.
- Duclos DV, Björkman T. Meristem identity gene expression during curd proliferation and flower initiation in Brassica oleracea. J Exp Bot. 2008;59(2):421–433.
- Yu J, Zhao M, Wang X, et al. Bolbase: a comprehensive genomics database for Brassica oleracea. BMC Genomics. 2013;14:664
- Bowers JE, Chapman BA, Rong J, et al. Unravelling angiosperm genome evolution by phylogenetic analysis of chromosomal duplication events. Nature. 2003;422(6930):433–438.
- Saha G, Park JI, Jung HJ, et al. Genome-wide identification and characterization of MADS-box family genes related to organ development and stress resistance in Brassica rapa. BMC Genomics. 2015;16:178
- Lan TH, Paterson AH. Comparative mapping of quantitative trait loci sculpting the curd of Brassica oleracea. Genetics. 2000;155(4):1927–1954.