
Abstract
Castor (Ricinus communis L.) is one of the world's top ten oil crops. China is the second largest producer of castor beans, but China's castor bean acreage has been declining. A principal reason for this decline is the prevalence of weeds and the absence of herbicide resistant varieties of castor plants. In this study, we used Agrobacterium-mediated gene transfer to introduce the EPSPS (5-enolpyruvylshikimate-3-phosphate synthase) gene, which confers resistance to glyphosate, and the Bar (phosphinothricin N-acetyltransferase) gene, encoding resistance to glufosinate, into castor 2129 (high stem excellent recovery line) and CSR 181 (dwarf stem excellent recovery line). The transgenic plants exhibited significantly increased expression of the EPSPS and Bar genes and significantly increased resistance to glyphosate and glufosinate. Proteomic analysis showed differences in the amounts of 20 proteins in the dwarf stem transgenic plants. Nine of these proteins are involved in photosynthesis and indirectly related to the mechanism of action of the Bar gene. Eight proteins are involved in defense, repair, stress response, oxidative phosphorylation, and metabolic pathways and are indirectly related to the mechanism of action of the EPSPS gene. These results provide a foundation for the preparation of high herbicide resistant castor varieties.
Introduction
Weeds are a serious problem in any agricultural system because they compete with crops for nutrients, light, and other important resources. Weed infestation poses a challenge to crop yield, productivity and plant survival [Citation1]. Compared with mechanical weeding, the application of herbicides saves time and is highly efficient. At present, herbicide resistant crop varieties are highly valued worldwide, and they have provided good economic, social and ecological benefits. Most herbicide-resistant crops are resistant to glyphosate (N-phosphonomethyl-glycine) and glufosinate-ammonium. These herbicides are broad spectrum, they are highly effective with low toxicity, they decompose readily with low residue, and they are eco-friendly [Citation2].
Glyphosate works primarily by disrupting the shikimate pathway, which is essential for the biosynthesis of tyrosine, tryptophan and phenylalanine in plants, fungi and bacteria [Citation3]. EPSPS (5-enolpyruvylshikimate-3-phosphate synthase) catalyzes the partial transfer of enolpyruvate of phosphoenolpyruvate (PEP) to the 5-hydroxyl group of shikimate-3-phosphate (S3P) to form 5-enolpyruvylshikimate-3-phosphate (EPSP). Glyphosate is chemically similar to the intermediate PEP; it forms a dead-end complex with the EPSPS enzyme causing complete inhibition of the shikimate pathway [Citation4]. Thus, unable to synthesize aromatic amino acids, the plant wilts and eventually dies. The bacterial type II EPSP synthetase is completely tolerant to glyphosate, thus, it is widely used to create glyphosate-tolerant transgenic crops [Citation5].
Glufosinate, also known as phosphinothricin, is a broad-spectrum herbicide produced by Streptomyces spp. Glufosinate is an analogue of glutamate that irreversibly inhibits glutamine synthase (GS), thereby blocking the nitrogen assimilation function of GS [Citation6]. In plants, inhibition of GS leads to glutamine deficiency and ammonia accumulation, which indirectly inhibits photosynthesis [Citation7]. The pat (phosphinothricin N-acetyltransferase) gene from Streptomyces viridochromeogenes and related Bar gene from S. hygroscopicus encode, respectively, resistance to phosphinothricin (PAT) and bialaphos (L-Alanyl- L-alanyl-phosphinothricin; Bar); bialaphos is metabolized in plants to liberate phosphinothricin. Thus, investigators have used the Pat and Bar genes in basic plant research and in creating genetically engineered crops [Citation8].
Castor (Ricinus communis L.) is an annual or perennial dicotyledon apetalous herb of the genus Ricinus in Euphorbiaceae [Citation9–11]. Because of its high height, well-developed roots, and deep soil penetration, castor has excellent characteristics such as resistance to cold, drought, heavy metals, salt and alkali [Citation12,Citation13]. Castor seeds contain a large amount of oil, making castor one of the world's top ten oil crops. With the increasing shortage of non-renewable resources such as petroleum and coal, castor oil is regarded as a renewable "green oil" resource with potential for development; castor is the only vegetable oil that has been used in aviation. Therefore, castor oil is indispensable as a sustainable renewable energy source [Citation14,Citation15]. However, despite the economic and environmental importance of the plant, there has been little research devoted to herbicide resistant castor.
The EPSPS and Bar genes have been introduced into pepper, soybean, maize, millet, potato, and other crops, and they have yielded high glyphosate- [Citation16,Citation17] and glufosinate- [Citation18,Citation19] resistance. Herbicide resistance among weeds is inevitable, and long-term use of a single herbicide will spread herbicide resistance. Because the possibility of weeds acquiring simultaneous resistance to two herbicides is extremely small, providing two or more herbicide resistance factors to crops would enable continuous crop exposure to herbicide without imposing selection pressure on weeds [Citation20]. Thus, in this study, we used Agrobacterium-mediated gene transfer to introduce the EPSPS gene (resistance to glyphosate) and the Bar gene (resistance to glufosinate) into castor 2129 (high stalk excellent restorer line) and CSR 181 (dwarf excellent restorer line). We performed molecular level identification, plant resistance detection and differential protein analysis of the transgenic plants to reveal the mechanism of action of EPSPS and Bar genes in castor.
Molecular level identification was done. The transgenic plants exhibited significantly increased expression of the EPSPS and Bar genes found by a herbicide resistance test. The leaves of high-stalk transgenic plants had higher than 1.0 mg/mL glyphosate resistance and 0.5 mg/mL glufosinate resistance, whereas those of dwarf-stem transgenic plants had glyphosate resistance higher than 2.0 mg/mL and 1.0 mg/mL glufosinate resistance. Proteomic analysis showed differences in the amounts of 20 proteins in the dwarf stem transgenic plants. Nine of these proteins are involved in photosynthesis and are indirectly related to the mechanism of action of the Bar gene. Eight proteins are involved in defense, repair, stress response, oxidative phosphorylation and metabolic pathways and are indirectly related to the mechanism of action of the EPSPS gene.
Materials and methods
Plant material and treatment
As described below, we created 12 strains of high-stalk double-herbicide resistant transgenic castor, designated 2129-BE+, and 12 strains of dwarf double-herbicide resistant castor, designated CSR·181-BE+. The leaves of transgenic plants (treatment group) and non-transgenic plants (control group) were sprayed with 5.6% glyphosate and 4.4% glufosinate. Each leaf was sprayed with about 5 mL glyphosate or glufosinate. Each plant was sprayed 3 times. The plant leaves were photographed three days and seven days after herbicide application. All materials were provided by The Engineering Technology Research Center of Castor Oil Industry of Inner Mongolia University for Nationalities.
Construction of plant expression vector pCAMBIA3301-Bar-EPSPS
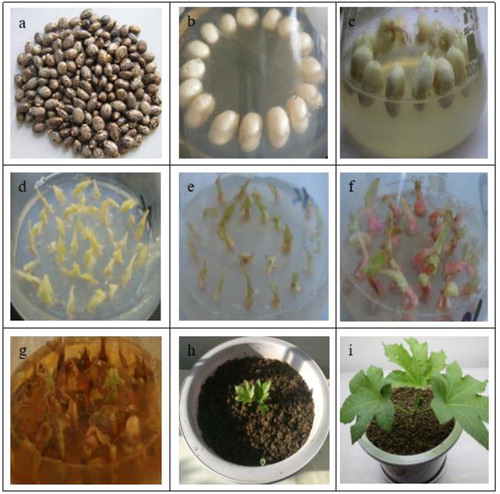
The EPSPS and Bar coding sequences obtained from Ruolui [Citation21]were cloned into the expression vector pCAMBIA3301 using primers ER, EF and BR, BF (Supplementary material, Table S1 and ). The plasmids were transformed into the castor 2129 plants (high stalk excellent restorer line) and CSR·181 plants (dwarf excellent restorer line) by an Agrobacterium-mediated method. The cotyledonary nodes were genetically transformed, followed by seed germination, cotyledonary pre-culture, dip-dye, co-culture, resistance screening, domestication and transplanting (), The specific process is as follows:Castor seeds were treated with 75% alcohol in an ultra-clean workbench for 10 min, rinsed with sterile water 4–5 times, and inoculated in 20 g/L sucrose + 11 g/L agar powder + 44.2 g/L MS (Murashige and Skoog) medium. The plants were cultured at 20 °C under 16 h of light per day. We picked the castor seeds with better growth, cut the castor leaves and cultured them for 2 days to prepare them for impregnation in Agrobacterium tumefaciens suspension. We grew the Agrobacterium tumefaciens overexpressing different genes on a rotary shaker at 5000 r/min. We centrifuged for 5 min at 4000 r/min to collect the bacterial cells and adjusted the bacterial cell concentration to an optical density at 600 nm (OD600) of 0.6 in resuspending solution (5% sucrose, 0.02% silwetL-77) The castor cotyledons were carefully immersed in the bacterial solution and were cultured in darkness in a 22 °C incubation room for 24 h after normal light cultivation. The screening medium contained 20 g/L sucrose + 11 g/L agar powder + 44.2 g/L and a hygromycin final concentration of 50 μg/mL). The castor cotyledons collected after impregnation were planted on the selection medium, and were transplanted at the four-leaf stage. We repeated the screening steps until T3 generation homozygous plants were selected. Finally, we obtained 12 transgenic strains each of 2129-BE+ and CSR·181-BE+.
Figure 1. pCAMBIA3301-Bar-EPSPS vector map.
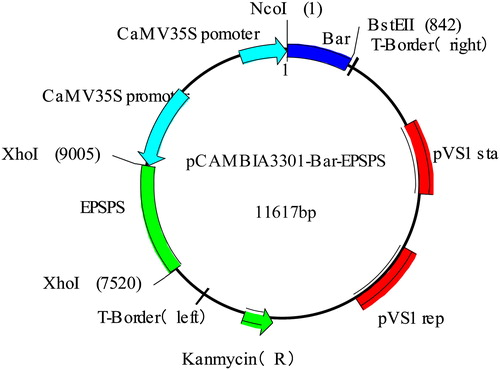
Figure 2. Genetic transformation and domestication and transplanting process of castor bean leaf section.
Notes: (a): castor seeds; (b): ramie peeled seeds inoculated in the medium; (c): the state when the cotyledonary nodes are cut; (d): pre-culture; (e): co-cultivation; (f): resistance screening; (g): domestication and transplanting state; (h) -(i): state after transplanting.
Subcellular localization
To create green fluorescent protein fusions of the EPSPS and Bar gene products, CaMV35S promoter-driven expression clones of the genes were generated in the pCAMBIA1302 vector. The plasmids, pCAMBIA1302-EPSPS and pCAMBIA1302-Bar, were confirmed by sequencing. The plasmids were introduced into onion epidermal cells, and the cells were cultured for two days with 16 h of light and 8 h of dark. The locations of EPSPS and Bar in the onion cells were observed by laser confocal microscopy and photographed under natural light and fluorescence, to infer the locations of EPSPS and Bar protein in castor cells.
Polymerase chain reaction
To confirm the presence of the EPSPS and bar genes in plants, leaf genomic DNA was extracted with a kit (ZOMANBIO, Beijing) and subjected to polymerase chain reaction (PCR); plasmid pCAMBIA3301-Bar-EPSPS was used as a positive control, and DNA from non-transgenic plants was used as the negative control. See for the sequences of the PCR primers. The PCR products were sequenced (Sangon Biotech, Shanghai), and the results were analyzed by DNAMAN software (Gene sequencing results are shown in the Supplementary material (Box S1) .
Quantitative real-time polymerase chain reaction
Quantitative fluorescence PCR was used to measure EPSPS and bar gene expression in 2129-BE + and CSR.181-BE + plants confirmed by PCR. Total RNA from the same leaf position of the plants was isolated with an RNA extraction kit (ZOMANBIO, Beijing). The RNA was reverse-transcribed into cDNA with a cDNA Synthesis Kit (m-mlv Rtase cDNA Synthesis Kit; TaKaRa). Less than 1 μg of RNA was used to synthesize the first cDNA strand in 10 μL of the reaction mixture. Transcript abundance was quantitated on the ABI7500 Real-Time PCR System (Applied Biosystems) using the GoTaq® qPCRMaster Kit (Promega, USA) (EPSPS and Bar Gene Primer ).
Protein extraction, 2-D gel electrophoresis, image acquisition and data analysis
CSR·181-BE (A3) with good herbicide resistance was selected for 2-D electrophoresis (2-DE) protein difference analysis. Total protein was isolated by phenol extraction from leaves (3 g) with three biological replicates. The following standard curve was obtained by quantifying the extracted protein using a 2-D Quant Kit (GE Healthcare, USA): y = −0.0049x + 0.4555 (R2 = 0.9958), where y is the absorbance value and x is the protein concentration (μg/μL). The 2-DE protocol was described by Chang Ruhui et al. [Citation22] About 800 μg of total protein per sample was added with hydration solution to a final volume of 450 μL. IEF was performed with an Ettan IPG-phor system (GE Healthcare, USA) and a fixed pH gradient tape (GE Healthcare, pH 4–7, 24 cm). At constant temperature of 20 °C, the following voltage at a PROTEAN isoelectric focusing system was applied: 30 V (linear) 8 h, 50 V (linear) 2 h, 100 V (linear) 1 h, 300 V (linear) 1 h, 500 V (linear) 1 h, 1000 V (linear) 1 h, 8000 V (linear) 12 h, and then maintained at 1000 V low voltage. The equilibrated strips were separated by electrophoresis on 12.5% polyacrylamide gels and proteins were stained with Coomassie G-250. Images of stained gels were obtained using Image Scanner III (28-9076-07GE Healthcare, USA) and analyzed on PDQuest Version 8.0 (Bio-Rad). Qualitative, quantitative (N2 folding) and statistical analyses (based on t-test (p ≤ 0.01) studies) were performed by PDQuest. Only points (p ≤ 0.01) with greater than 1.5 times abundance change were considered differentially expressed. We analyzed the electrophoresis pattern by Image Master 2 D Platinum Software Version 7.0. The screening conditions were Ratio ≥ 2-fold, p ≤ 0.05. After analysis, the differentially expressed protein spots of interest were manually extracted and sequenced by Bioclouds (Shanghai).
Based on the protein sequencing results, we searched the castor bean protein library to find the corresponding proteins. The molecular weight, isoelectrical point, score, threshold, Sc (%) and unique peptide of the protein were calculated. The corresponding function of the matched protein was identified by searching in Uniprot, NCBI and KEGG databases.
Data analysis
GraphPad software (San Diego, CA) was used for data processing and plotting. SPSS 19.0 software (IBM, Armonk, NY) was used for data statistical analysis, and independent Student’s T-test was used to compare means.
Results and discussion
We obtained 12 transgenic plants of 2129-BE+ and CSR·181-BE+ after genetic transformation, domestication and transplanting of castor bean cotyledon ( and ). We performed subsequent detection and verification of EPSPS and bar gene products as follows.
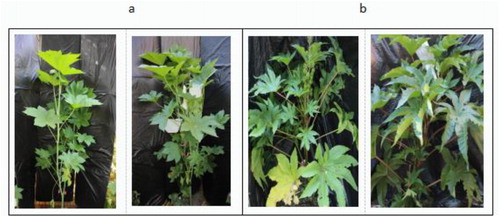
Figure 3. Transgenic plants.
Notes: (a) 2129 transgenic plants; (b) CSR·181 transgenic plants
Subcellular localization of EPSPS and bar proteins
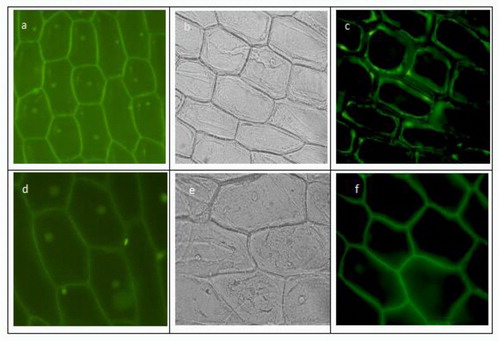
To investigate the subcellular localization of EPSPS and Bar, we expressed GFP fusions of the proteins and expressed them transiently in onion epidermal cells. In the control of untransformed EPSPS and Bar protein, green fluorescent protein is expressed in the cell membrane and nucleus (a, d). In cells transfected with EPSPS protein and Bar protein, respectively, we observed clear cell structure under bright field microscopy (b, e). Under fluorescence microscopy, the green fluorescent protein was found mainly on the cell membrane, which indicated that both EPSPS and Bar proteins were membrane-localized (Fig4. c, f).
Figure 4. Subcellular localization analysis.
Note: (a): EPSPS protein in non-transformed controls; (b): EPSPS protein protein conversion under bright field conditions; (c): EPSPS protein protein conversion under fluorescent conditions; (d) Bar protein in non-transformed control; (e): protein conversion of Bar protein under bright field conditions; (f): protein conversion of Bar protein under fluorescent conditions
DNA analysis
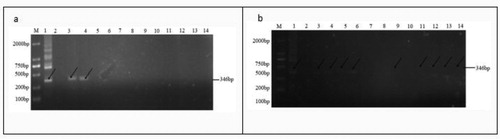
We used PCR to detect pCAMBIA3301-Bar-EPSPS () in the transgenic plants. For the 2129-BE + plants, PCR of the G-1 and G-4 plants (lanes 3 and 6) produced amplified products with the expected sizes (). Likewise, for CSR·181-BE+ plants A-1-4, A-7, A-9-A-12 (lanes 3-6, 9, 11-14) PCR produced amplified products with the expected sizes (). DNA sequencing confirmed the identities of the PCR products.
Figure 5. PCR detection electrophoresis results.
Note: (a) 2129-BE + PCR detection electrophoresis results; (b) CSR·181-BE + PCR detection electrophoresis results M: DL 2000 Marker; 1: positive control; 2: negative control; 3-14: 2129-BE + PCR result
Fluorescence quantitative PCR
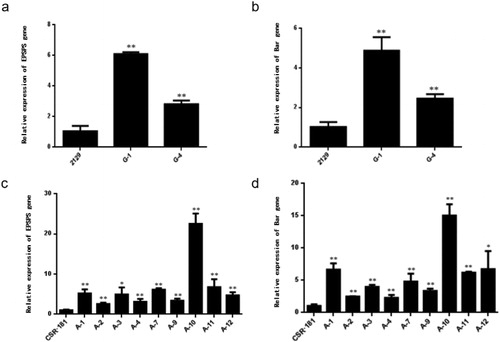
We used fluorescence quantitative PCR to determine the expression levels of the EPSPS and Bar genes in the 2129-BE+ and CSR·181-BE+ transgenic castor plants. Since the target gene was a foreign gene, 2129-BE + and CSR · 181-BE+ plants with basically the same growth conditions were selected for the quantitative PCR analysis after spraying with herbicides, and transgenic plants without herbicides were used as a control. The results showed that after spraying the herbicide, the relative expression of EPSPS in G-1 was about 6-fold greater than that of the control, and G-4 exhibited about 3-fold greater expression of EPSPS than the control (). The relative expression of BAR in G-1 plants was about 5-fold greater than that of the control plants, and, in G-4 plants, it was about 3-fold greater (). The relative expression levels of the CSR·181-BE+EPSPS and BAR genes were about 2-25-fold and 2-17-fold greater, respectively, compared with the control (). In sum, the expression levels of EPSPS and BAR in 2129-BE+ and CSR·181-BE+ plants were significantly higher than those in the control, and gene expression in CSR·181-BE+ plants was higher than that in 2129-BE + plants.
Figure 6. Relative expression of EPSPS and Bar.
Differential expression of EPSPS gene (a) and Bar gene (b) between 2129-BE + and 2129.: Differential expression of EPSPS gene (c) and Bar gene (d) between CSR·181-BE + and CSR·181.
Note: 2129 and CSR·181 are non-transgenic controls; G-1 and G-4 are 2129-BE+; A-1, A- 2. A-3, A-4, A-7, A-9, A-10, A-11, A-12 are CSR·181-BE+.
*Significant differences at P ≤ 0.05;
**Significant differences at P ≤ 0.01.
Herbicide resistance of isolated leaves
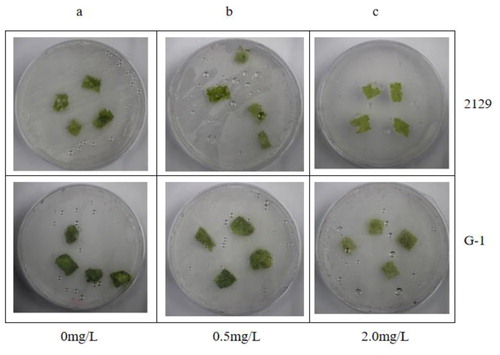
We performed an herbicide resistance assay on 2129-BE + leaves (G-1) that had high expression of EPSPS and BAR as measured by qPCR (). shows the control (no herbicide). When the glyphosate concentration was 0.8 mg/mL, we did not observe any significant difference between G-1 leaves and the control, whereas the leaves of 2129 showed a slight yellowing (). With 1.0 mg/mL glyphosate, G-1 leaves showed a slight tendency to turn yellow, whereas the leaves of 2129 showed a marked tendency to turn yellow, and some leaves became white (). When the glufosinate concentration was 0.5 mg/mL, G-1 leaves showed a slight yellowing, whereas the leaves of 2129 showed severe yellowing and white spots (). With 2.0 mg/mL glufosinate, G-1 leaves showed a slight tendency to turn yellow, with some white spots, whereas the leaves of 2129 showed a strong tendency to turn yellow, and some leaves showed large areas of white (). Thus, compared with 2129, G-1 leaves had higher glyphosate and glufosinate resistance. We estimate that G-1 leaves had higher than 1.0 mg/mL glyphosate resistance and 0.5 mg/mL glufosinate resistance.
Figure 7. Glyphosate resistance test on leaves of 2129 in vitro.
Excised leaves of 2129 and G-1 exposed to different concentrations of glyphosate in vitro: 0 mg/L (a), 0.8 mg/L (b), 1.0 mg/L (c).
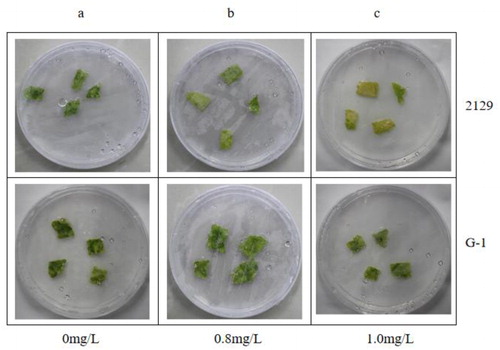
Figure 8. Glufosinate resistance test on leaves of 2129 in vitro.
Excised leaves of 2129 and G-1 exposed to different concentrations of glufosinate in vitro: 0 mg/L (a), 0.5 mg/L (b), 2.0 mg/L (c).
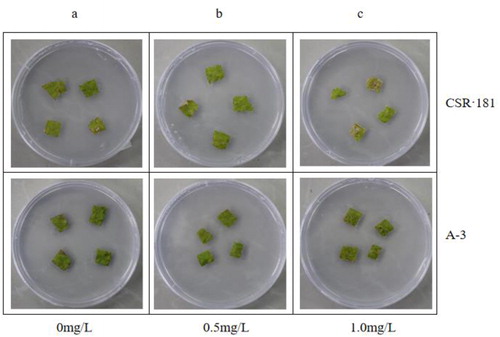
We performed the same herbicide resistance assay with CSR·181-BE+ (A-3), which had high EPSPS and BAR expression. shows the control. With 0.5 mg/mL glyphosate, there was no significant difference between A-3 leaves and the control, and CSR·181 leaves showed a slight yellowing (). With 2.0 mg/mL glyphosate, A-3 leaves were still green, whereas CSR·181 leaves had whitened extensively (). When the concentration of glufosinate was 0.5 mg/mL, A-3 leaves did not change significantly, whereas CSR·181 leaves showed some white plaques (). With 1.0 mg/mL glufosinate, A-3 leaves had not changed significantly, and CSR·181 leaves showed large areas of white (). These results indicated that A-3 leaves had higher glyphosate and glyphosate resistance compared with CSR·181.
Figure 9. Glyphosate resistance test on leaves of CSR·181 in vitro.
Excised leaves of CSR·181 and A-3 exposed to different concentrations of glyphosate in vitro: 0 mg/L (a), 0.5 mg/L (b), 2.0 mg/L (c).
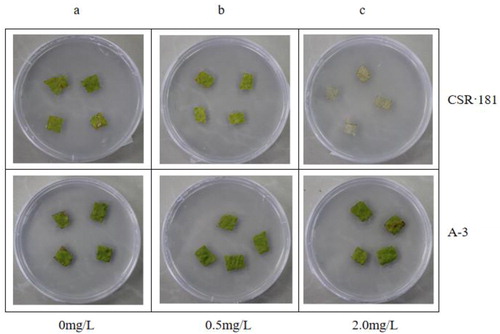
Figure 10. Glufosinate resistance test on leaves of CSR·181 in vitro.
Excised leaves of CSR·181 and A-3 exposed to different concentrations of glufosinate in vitro: 0 mg/L (a), 0.5 mg/L (b), 2.0 mg/L (c).
Note:The experiments were run in parallel, with shared controls, so the images in (9)a and (10)a are given twice for clarity and easier interpretation.
Herbicide resistance of plants
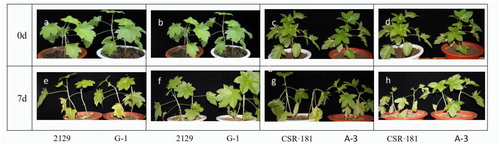
We extended herbicide resistance studies to transgenic plants. show G-1 and 2129, and A-3 and CSR·181 before herbicide application. Seven days after spraying with glyphosate (Each leaf was sprayed with about 5 mL of 5.6% glyphosate, spraying each plant 3 times), G-1 cotyledons and true leaves showed a tendency to yellow, whereas 2129 showed obvious yellowing, severe drooping, and some loss of cotyledons and true leaves (). A-3 did not change significantly, but CSR·181 showed significant yellowing of cotyledons and true leaves and severe drooping (g). After seven days of spraying glufosinate (Each leaf was sprayed with about 5 mL of 4.4% glufosinate, spraying each plant 3 times), G-1 cotyledons showed a slight tendency to sag, and they had burn spots, whereas 2129s cotyledons became dry and detached, and the true leaves also had large areas of dryness and curling (). A-3 did not change significantly, but the leaves of CSR·181 showed large areas of dryness and shedding, and new leaves were sallow ().
Figure 11. Herbicide resistance in castor plants.
(a) G-1 and 2129 plants not sprayed with glyphosate; (b) G-1 and 2129 plants not sprayed with glufosinate; (c) A-3 and CSR·181 not sprayed with glyphosate; (d) A-3 and CSR·181 not sprayed with glufosinate; (e) G-1 and 2129 plants after spraying glyphosate for 7 days; (f) G-1 and 2129 plants after spraying glufosinate for 7 days; (g) A-3 and CSR·181 plants after spraying glyphosate for 7 days; (h) A-3 and CSR·181 after spraying glufosinate for 7 days
Note:The experiments were run in parallel, with shared controls, so the images a, b, c and d are given twice for clarity and easier interpretation.
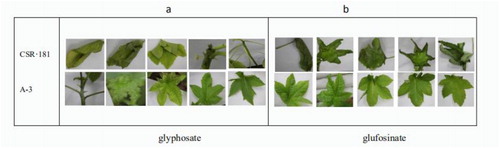
Taking A-3 in CSR·181-BE+ and CSR·181 as examples, we monitored the changes in each leaf during continual herbicide spraying (). After spraying glyphosate (Each leaf was sprayed with about 5 mL of 5.6% glyphosate, spraying each plant 3 times) for seven days (), entire leaves of A-3 were green and the cotyledons were slightly yellowed, which may have been normal growth. All leaves of CSR·181 showed obvious shedding, drooping, curling and yellowing, and new leaves became dry and black, the drooping angles of A-3 and CSR·181 were significantly different. After spraying glufosinate (Each leaf was sprayed with about 5 mL of 4.4% glufosinate, spraying each plant 3 times) for seven days (), A-3 leaves were completely green and did not show any tendency of curly or drying. CSR·181 leaves showed obvious shedding, rolling and drying. We performed three biological replicates for these morphological changes (Supplementary material, Tables S2 and S3). The results proved that G-1 and A-3 had higher glyphosate and glufosinate resistance than the controls. In addition, the herbicide resistance of A-3 was higher than that of G-1.
Figure 12. Herbicide resistance in CSR·181 plants. Leaf changes after spraying A-3 and CSR·181 plants with glyphosate (a) or glufosinate (b) for 7 days.
Differential proteomics analysis of CSR· 181-BE+
For proteomic analysis, we selected CSR·181-BE+ having good herbicide resistance. A protein sample was subjected to two-dimensional electrophoresis, stained and scanned (). We recovered 22 differentially expressed proteins and analyzed them by mass spectrometry; we found 20 of the proteins in various databases ().
Figure 13. Two-dimensional electrophoresis of CSR·181-BE leaves.
(a): CSR·181 not sprayed with herbicide; (b): CSR·181-BE not sprayed with herbicide; (c): CSR·181 sprayed with glyphosate; (d): CSR·181-BE sprayed with glyphosate; (e) CSR· 181 sprayed with glufosinate; (f): CSR·181-BE sprayed with glufosinate
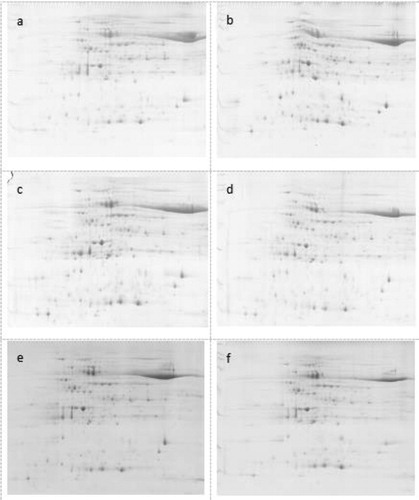
Table 1. Identification of differential proteins in transgenic dwarf double-resistant ramie leaves.
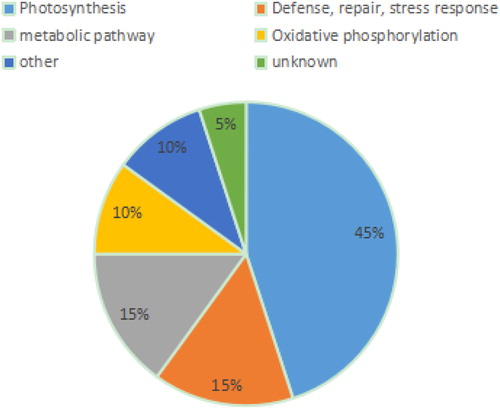
The 20 differentially expressed proteins (DAPs) were classified into six categories according to their functions described in Uniprot (). Nine proteins were related to photosynthesis: Plastocyanin (DAPs 1 and 8); Cytochrome b6-f complex iron sulfur subunit (DAPs2, 5, 11, and 21); Iron Oxygenated protein - NADP reductase(DAP 10); Chlorophyll ab binding protein (DAPs 16 and 17) . Three DAPs were involved in defense, repair and stress response: Rubisco subunit binding protein β subunit (DAP 13); rRNA N-glycosidase (DAP 14) ; L-ascorbic acid peroxidase (DAP 15) . Three DAPs were related to metabolism: adenosine kinase (DAP 12); lichenase (DAPs 19 and 20). Two proteins were involved in oxidative phosphorylation: ATP synthase subunit α (DAP 4) and ATP synthase subunit β vacuole (DAP 7). Two DAPs were related to other functional proteins. One DAP was unidentified. This analysis revealed that nine proteins involved in photosynthesis and eight proteins involved in defense, repair and stress response were indirectly related to the mechanism of action of Bar, and oxidative phosphorylation and metabolic pathways were indirectly related to the mechanism of action of EPSPS.
Figure 14. Classification of differentially expressed proteins.
Differential proteomics revealed changes of CSR·181-BE+ in photosystem, energy metabolism, and stress defense under mild glyphosate and glyphosate stress. Compared with the control CSR·181, CSR·181-BE+ up-regulated the following proteins: adenosine kinase, lichenase, cytochrome b6-f complex iron sulfur subunit, Osmotin, ferredoxin-NADP reductase, rRNA N-glycosidase, L-ascorbic acid peroxidase, plastocyanin, protein binding protein, ATP synthase subunit α, Rubisco subunit binding protein β subunit. However, after spraying herbicide, the expression levels of plastocyanin, cytochrome b6-f complex ferrithiogen, and protein binding protein were up-regulated in the control plants, indicating that even non-transgenic plants could be stimulated to respond to stress induced by herbicides.
Underlying mechanisms of resistance and potential application
We used castor 2129 (High stem excellent recovery line) and CSR·181 (dwarf stem excellent recovery line) as experimental materials. We used Agrobacterium-mediated gene transfer to introduce the EPSPS (glyphosate resistance) and BAR (glufosinate resistance) genes into these two plants. We obtained high-stalk double-herbicide resistant (2129-BE+) and dwarf double-herbicide resistant plants (CSR·181-BE+). At the mRNA level, the expression of EPSPS gene and Bar gene in transgenic plants increased after herbicide spraying and herbicide resistance of the transgenic plants was significantly higher than that of non-transgenic plants. The EPSPS and BAR genes do not exist in weeds, and many weeds show slight resistance to glyphosate and glufosinate [Citation23,Citation24]. Therefore, in the herbicide resistance test, we found that non-transgenic castor plants showed some resistance to herbicides.
Transcriptomic and metabolomic studies have found that plants develop herbicide resistance by reducing herbicide concentration with cytoplasmic mechanisms such as vacuole chelation [Citation25,Citation26]. We performed proteomic analysis on CSR·181-BE+and identified 20 proteins that showed significant differences in abundance with glyphosate and glufosinate treatment. Here, we discuss the functions of these proteins and suggest how the functions may contribute to the mechanisms by which our transgenic plants were resistant to herbicides.
Stress, defense, and detoxification
Reactive oxygen species (ROS) are important signaling molecules in plants, but they can also be toxic. Therefore, in the evolutionary adaptation process, plants have developed regulatory and detoxification mechanisms to respond to and defend against oxidative stress. Osmotin (OSM) is a ubiquitous multifunctional plant protein. OSM regulates the plant response to stress, and it apparently participates in growth and development [Citation27]. In EPSPS and BAR transgenic plants, Osmotin expression was up-regulated, which could have increased the resistance to stress. In addition, L-ascorbate peroxidase is an important antioxidant enzyme that can remove ROS, particularly H2O2 in chloroplasts. The increased expression of L-ascorbate peroxidase in our genetically modified castor plants may have augmented the antioxidant capacity of plants and relieved herbicide toxicity.
Protein folding and degradation
Abiotic stress causes protein misfolding, thereby destroying function. In response, the expression of enzymes and proteins involved in protein folding and degradation will change significantly. Under the stress of glyphosate or glufosinate, we found that the abundance of Rubisco subunit binding protein βsubunit and rRNA N-glycosidase in transgenic plants increased significantly. Previous studies found that rRNA N-glycosidase also has an RNA N-glycosylase activity, which is involved in DNA repair and replication, protein synthesis and protein degradation. The Rubisco subunit binding protein β subunit is involved in synthesis of the large subunit of Rubisco; it also has a molecular chaperone function [Citation28] that restores the biological activity of unfolded or misfolded proteins. Therefore, transgenic plants (CSR·181-BE+) likely had enhanced herbicide resistance by repairing misfolded proteins. In addition, under glufosinate stress, inhibition of glutamine synthetase and accumulation of ammonia triggers a series of reactions, including inhibition of Rubisco and inhibition of electron flow in the photosystem that blocks photosynthesis and causes plant death [Citation29]. Thus, we suggest that our transgenic castor plants increased herbicide resistance by increasing Rubisco expression to reduce ammonia accumulation.
Energy and metabolism
We identified four differentially expressed proteins associated with energy metabolism. Adenosine kinase participates in purine remediation by catalyzing the generation of adenosine diphosphate and adenine ribonucleotide [Citation30]. Lichenase is a digestive enzyme that participates in carbohydrate metabolism by catalyzing the hydrolysis of 1,3-β-d-glucosidic bonds in 1,3-β-d-glucan. ATP synthase subunit α, ATP synthase subunit β vacuole is a unit of ATP synthase, which selectively and non-covalently interacts with ATP and catalyzes hydrolysis of various bonds, such as C-O, C-N, C-C and phospho-anhydrides. ATP synthase is the key enzyme of energy metabolism in most organisms, it participates in oxidative phosphorylation and photophosphorylation [Citation31]. Therefore, upregulation of ATP synthase subunits may provide plants with more energy for growth under herbicide stress.
Photosynthesis and respiration
Photosynthesis, the process by which plants use light energy to convert carbon dioxide and water into organic matter and oxygen, is key to plant survival. We found four differentially expressed photosynthesis/respiratory-related proteins. Chlorophyll ab binding protein is involved in light capture and energy absorption and transfer between light system reaction centers. Down-regulation of its expression may affect photosynthesis, but chlorophyll ab binding protein has a limited effect on light capture efficiency [Citation32]. Under the stress of glyphosate and glufosinate, the expression levels of ferredoxin-NADP reductase (LFNR), plastocyanin, and cytochrome b6-f complex iron-sulfur subunit were significantly up-regulated in our transgenic plants. These proteins are present on the thylakoid membrane, in the photosynthetic phosphorylation mechanism; they participate in electron transport and enhance photosynthetic phosphorylation [Citation33]. The increased expression of these proteins was likely beneficial by enhancing photosynthesis to resist herbicide stress. In addition, under abiotic stress, many reactive oxygen species will be produced. These reactive oxygen species cause membrane lipid peroxidation and large release of LFNR to reduce the deacidification capacity of NADP+, which is conducive to maintaining the balance of NADP+/NADPH in plants under oxidative stress. Therefore, LFNR may have had an important function in antioxidant stress in our transgenic plants [Citation34].
We did not find the EPSPS and Bar proteins among the 20 differentially expressed proteins that we identified. This absence may have occurred for the following reasons: The transferred genes may have expressed the corresponding proteins, but the expression differences were too low. Alternatively (or in addition), the EPSPS and BAR gene products may have produced herbicide resistance by affecting the function of other proteins.
The herbicide resistance test usually has slight differences between outdoor and indoor conditions. A herbicide's activity depends on many environmental factors, such as wind speed, temperature and light intensity during pesticide application [Citation35]. Many herbicides act by leaf absorption and conduction, so factors such as weed resistance also affect the test results [Citation36]. Outdoor herbicides are usually more effective; with the same material, the same herbicide type and herbicide concentration, outdoor castor plants incur more damage. Therefore, while continuing to explore the differences in genetic, molecular and physiological levels of transgenic plants, we also need to evaluate glyphosate and glyphosate resistance of transgenic plants in the field.
Genetically engineered crops having insect-resistance and herbicide tolerance play a great part in promoting global agricultural productivity and food security. At the same time, stacking two transgenic events through breeding does not introduce greater variation than traditional breeding processes [Citation37–39].
Conclusions
The castor transgenic plants produced in this study showed increased resistance to glyphosate and glufosinate herbicides. Based on the obtained results in the study of herbicides, we will screen out the proteins related to herbicides, and study the structure and functional domains to understand the mechanism of castor resistance to various herbicides. The content of this study has a high value for plant growth and agricultural production, and further research can be used to obtain highly herbicide-resistant castor varieties.
Authors’ contributions
H. F. designed this research and guided data analysis and writing. Z. H., Z.Y., L. R., and Y. L. performed the experiments. L. G. and D. J. guided the experimental process. Z. H., Z. Y., L. L., W.Q. and L.X. completed the data analysis and the writing of the first draft of the paper. All the authors read and agreed to the final text.
Supplemental Material
Download PDF (170.2 KB)Acknowledgements
The authors thank AiMi Academic Services (www.aimieditor.com) for English language editing and review services.
Disclosure statement
No potential conflict of interest was reported by the author(s).
Additional information
Funding
References
- Fartyal D, Agarwal A, James D, et al. Developing dual herbicide tolerant transgenic rice plants for sustainable weed management. Sci Rep. 2018; 8(1):11598
- Heap I, Duke SO. Overview of Glyphosate-Resistant Weeds Worldwide. Pest Manag Sci. 2018;74(5):1040–1049.
- Imran M, Barboza AL, Asad S, et al. Expression patterns of cp4-epsps gene in diverse transgenic Saccharum officinarum L. genotypes. Physiol Mol Biol Plants. 2019; 25(3):779–786.
- Hummel AW, Chauhan RD, Cermak T, et al. Allele exchange at the EPSPS locus confers glyphosate tolerance in cassava. Plant Biotechnol J. 2018; 16(7):1275–1282.
- Cao G, Liu Y, Zhang S, et al. A novel 5-enolpyruvylshikimate-3-phosphate synthase shows high glyphosate tolerance in Escherichia coli and tobacco plants. PLoS One. 2012; 7(6):e38718.
- Takano HK, Beffa R, Preston C, et al. Reactive oxygen species trigger the fast action of glufosinate. Planta. 2019; 249(6):1837–1849.
- Wang X, Zhang X, Yang J, et al. Effect on transcriptome and metabolome of stacked transgenic maize containing insecticidal cry and glyphosate tolerance EPSPS genes. [J].Plant J. 2018; 93(6):1007–1016.
- Christ B, Hochstrasser R, Guyer L, et al. Non-specific activities of the major herbicide-resistance gene BAR. Nat Plants. 2017; 3(12):937–945.
- Huang F, Peng M, Chen X, et al. cDNA-AFLP analysis of transcript derived fragments during seed development in castor bean (Ricinus communis L.). Biotechnol Biotechnolog Equip. 2018; 32(5):1119–1125.
- Huang F, Bao C, Peng M, et al. Chromatographic analysis of fatty acid composition in differently sized seeds of castor accessions. Biotechnol Biotechnolog Equip. 2015; 29(5):892–900.
- Huang FL, Zhu GL, Chen YS, et al. Seed characteristics and fatty acid composition of castor (Ricinus communis L.) varieties in Northeast China. Phyton, Int J Exp Bot. 2016; 84(1):26–33.
- Ye W, Guo G, Wu F, et al. Absorption, translocation, and detoxification of Cd in two different castor bean (Ricinus communis L.) cultivars. Environ Sci Pollut Res Int. 2018; 25(29):28899–28906.
- Mendes MG, Junior CDS, Dias ACC, et al. Castor bean (Ricinus communis L.) as a potential environmental bioindicator. Genet Mol Res. 2015; 14(4):12880–12887.
- Huang F, Peng M, Chen X, et al. Comparison of DNA methylation in developing seeds of Ricinus communis L. using MSAP analysis. Biotechnol Biotechnolog Equip. 2018; 32(4):858–864.
- Xiaofeng C, Mu P, Fenglan H, et al. A quantitative assay for fatty acid composition of castor seed in different developmental stages. Molec Plant Breed. 2016; 7(01):1-8.
- Ortega JL, Rajapakse W, Bagga S, et al. An intragenic approach to confer glyphosate resistance in chile (Capsicum annuum) by introducing an in vitro mutagenized chile EPSPS gene encoding for a glyphosate resistant EPSPS protein. PloS One. 2018; 13(4):e019466610.1371/journal.pone.0194666.
- Chahal PS, Varanasi VK, Jugulam M, et al. Glyphosate-resistant Palmer amaranth (Amaranthus palmeri) in Nebraska: confirmation, EPSPS gene amplification, and response to POST corn and soybean herbicides. Weed Technol. 2017; 31(1):80–93.
- Cai L, Sun DF, Sun GL. Optimization of a biolistic transformation system for transfer of antifreeze gene KN2 and the bar herbicide resistance gene in common wheat. Genet Mol Res. 2014;13(2):3474–3485.
- Sheng M, Xiaoxia J, Guohong W. The phytotoxicity of glufosinate on potato with transgenic Bar gene and the control effect of weeds in the field. Chinese Potato. 2017; 31(6):353–358.
- Deng LH, Weng LS, Xiao GY. Optimization of Epsps gene and development of double herbicide tolerant transgenic PGMS rice. Journal of Agricultural Science & Technology, 2014; 16(1):217–228.
- Rui L. Cloning of EPSPS gene and Bar gene and functional verification inrastor. 2015. Inner Mongolia University for Nationalities.
- Ruhui C, Dongli Z, Lifeng Y, et al. Establishment of two-dimensional electrophoresis optimization system for castor seed protein. Molec Plant Breed. 2018; 16(17):5712–5717.
- Xinxin Z, Zhaofeng H, Shouhui W, et al. Resistance mechanism of weed to glyphosate and its control strategies. Pesticide Sci Manage. 2018; 275(5):39–55.
- Fang H, Huirong D. Determination of the resistance level of goosegrass to paraquat, glyphosate and glufosinate. South China J Agric Sci. 2018; 31(2):335–341.
- Sammons RD, Gaines TA. Glyphosate resistance: state of knowledge. Pest Manag Sci. 2014;70(9):1367–1377.
- Jalaludin A, Yu Q, Zoellner P, et al. Characterisation of glufosinate resistance mechanisms in Eleusine indica. Pest Manag Sci. 2017;73(6):1091–1100.
- Qiao LY, Qiao LB, Zhang XP, et al. Effect of inhibition of StOSM-3b expression on phenotype in potato (Solanum tuberosum). J Agric Biotechnol. 2017; 25(8):1228–1234.
- Huawei Q, Dianyun H. Cloning and Functional Verification of Tomato Rubisco Small Subunit Chloroplast Transit Peptide. Genom Appl Biol. 2018; 37(4):1570–1575.
- Salas-Perez RA, Saski CA, Noorai RE, et al. RNA-Seq transcriptome analysis of Amaranthus palmeri with differential tolerance to glufosinate herbicide. PloS One. 2018; 13(4):e0195488
- Wang WH, Jiang L, Chen W, et al. Comparative proteomics study on whole and fresh-cut Zizania latifolia during storage at room temperature. Shipin Kexue/Food Sci. 2018; 39(13):7–16.
- Tu Y, Jin Y, Ma D, et al. Interaction between PVY HC-Pro and the NtCF1β-subunit reduces the amount of chloroplast ATP synthase in virus-infected tobacco. Sci Rep. 2015; 5:15605
- Wientjes E, van Stokkum IHM, van Amerongen H, et al. The role of the individual Lhcas in photosystem I excitation energy trapping. Biophys J. 2011;101(3):745–754.
- Cheng ZW, Chen ZY, Yan X, et al. Integrated physiological and proteomic analysis reveals underlying response and defense mechanisms of, Brachypodium distachyon, seedling leaves under osmotic stress, cadmium and their combined stresses. J Proteomics. 2018; 170:1–13.
- Lehtim?Ki N, Lintala M, Allahverdiyeva Y, et al. Drought stress-induced upregulation of components involved in ferredoxin-dependent cyclic electron transfer. J Plant Physiol. 2010; 167(12):1018– 1022.
- Jun W. Analysis of the main factors affecting the efficacy of herbicides. Modern Agric Sci and Technol. 2018;729(19):165–166.
- Baucom RS. Evolutionary and ecological insights from herbicide-resistant weeds: what have we learned about plant adaptation, and what is left to uncover? New Phytol. 2019;223(1):68–82.
- Duke SO, Rimando AM, Reddy KN, et al. Lack of transgene and glyphosate effects on yield, and mineral and amino acid content of glyphosate-resistant soybean. Pest Manag Sci. 2018; 74(5):1166–1173.
- Mall T, Gupta M, Dhadialla TS, et al. Overview of biotechnology-derived herbicide tolerance and insect resistance traits in plant agriculture. Methods Mol Biol. 2019. 313–342.
- Peng C, Ding L, Hu C, et al. Effect on metabolome of the grains of transgenic rice containing insecticidal cry and glyphosate tolerance epsps genes. Plant Growth Regul. 2019;88(1):1–7.