
 ?Mathematical formulae have been encoded as MathML and are displayed in this HTML version using MathJax in order to improve their display. Uncheck the box to turn MathJax off. This feature requires Javascript. Click on a formula to zoom.
Abstract
Exploring the genetic aspects of germplasm using genotypic and phenotypic analysis is more reliable for the development of rice varieties that could lead to the attainment of food security. This is because genetic variations provide a space for recombinants, which is an important factor in new varietal development. This study was conducted to evaluate genetic variability and diversity among 32 coloured rice accessions using agro-morphological characteristics and simple sequence repeats (SSR) markers. Quantitative traits (morphological, grain quality and antioxidant properties) and 34 SSR molecular markers were used as tools for determining cultivar identities and genetic diversity. Most of the quantitative traits showed significant differences (p ≤ 0.01) among all rice accessions. Clustering analysis from quantitative traits categorised the accessions into four groups. Similarly, the 32 accessions were grouped into 4 cluster groups based on the analysis of 34 SSR markers. The accessions YTM15, Pulut Merah 3, Padi Randau, Ringan Bawang, DNJ128 and DV 107 can be potentially selected for development of new varieties for local cultivation. Finally, these accessions can be used as parents in further breeding programmes.
Introduction
Over three billion people around the world consume rice as a basic food which provides about 50% to 80% of their daily calories [Citation1]. Malnutrition and chronic diseases are widespread in most of the developing countries where white rice is the major staple food [Citation2]. Coloured rice varieties, on the other hand, are an alternative healthy food that contain high antioxidant and other nutrient properties (protein, vitamins, minerals, phenolic and glycemic index) that have a significant benefit on human health [Citation3]. Antioxidants play an important role in reducing the risk of cancer and other diseases [Citation3]. To the best of our knowledge, the comparison of genetic diversity of coloured rice varieties has not been reported in Malaysia. Hence, a better understanding of the distribution and extent of genetic diversity of coloured rice is crucial not only to assist plant breeders in the selection of parents but also to provide a more rational basis for expanding the gene pool and for identifying materials that harbor alleles valuable for plant improvement. As reported by Sani et al. [Citation3], coloured rice contains higher antioxidant properties as compared to white rice. Selection of rice cultivars with a high antioxidant level and good agronomic trait may facilitate the breeding and commercial production of pigmented rice in Malaysia [Citation3]. Therefore, knowledge of the genetic diversity of coloured rice germplasm is important for crop improvement.
Genetic variability is the backbone for any successful breeding programme. Hence, assessing the level of genetic variation among germplasm is of great interest to plant breeders. Taxonomists are more concerned in the classification of different taxonomic groups, while breeders are interested in the determination of variation in agronomic character in breeding programs [Citation1]. In conventional plant breeding, genetic diversity is based on morphological variation of quantitative traits, which is easy to study and cost-effective. However, diversity analysis based on quantitative traits alone may not be completely reliable due time consumption, labour intensity, space and influence of the environmental factors [Citation4]. In addition, the exact level of genetic diversity among the germplasms cannot be defined due to the expression of additive gene action on the trait of interest. Hence, molecular characterisation is often used because it provides precise, reliable and effective tools for discrimination and characterisation of germplasm collections [Citation1].
A variety of molecular markers have been used to establish the fingerprint and evaluate the genetic diversity of rice varieties, which includes Amplified Fragment Length Polymorphisms (AFLPs) [Citation5], Diversity Array Technology (DArT) [Citation6], Restriction Fragment Length Polymorphisms (RFLPs) [Citation7], Randomly Amplified Polymorphic DNA markers (RAPDs)[Citation8], Inter Simple Sequence Repeat (ISSR) [Citation4], Microsatellites or Simple Sequence Repeats (SSRs) [Citation1,Citation8]. Among these markers, SSRs are chosen over other markers because they are polymorphic, abundant and well-distributed over the genome [Citation9,Citation10]. The SSRs are most suitable for rice because of their codominant inheritance, reproducibility, hypervariability, multiallelic nature, genome-wide coverage, and relative abundance [Citation11]. Although, numerous studies have been conducted on rice genetic diversity [Citation1–4], there is scarce information and research about coloured rice accessions in Malaysia. Documentation of the coloured rice germplasm should be carried out for an effective breeding programme. As a primary step in this study, it is important to evaluate the genetic diversity of exotic coloured rice in Malaysia for local utilisation in rice varietal development. Therefore, this study was conducted to evaluate the genetic variability and diversity among 32 coloured rice accessions using agro-morphological characteristics and simple sequence repeat (SSR) markers. This study will broaden our knowledge of the genetic diversity among different coloured rice which will facilitate the use of diverse germplasm in future breeding programmes.
Materials and methods
Plant materials and experimental design and layout
In this study, 32 rice varieties which formed seven base populations (Malaysia, Pakistan, Sri Lanka, Bangladesh, India, Taiwan, and Japan) were analysed. Of these 32 varieties, 15 varieties are from Malaysia (five commercial varieties, four from Peninsular Malaysia, four from Sabah, and two from Sarawak), eight varieties from Pakistan, two varieties each from India and Bangladesh, three varieties from Sri Lanka, one variety each from Taiwan and Japan (). All the rice accessions and control varieties were obtained from the Malaysian Agricultural Research and Development Institute (MARDI) rice gene bank. The whole experiment was conducted at MARDI Research Station, Seberang Perai, Pulau Pinang. It is 3 m above the sea level and is located between latitude 05°25'N and longitude 100°15'E. The climate of the location is a hot humid tropic and the areas fall under the rain forest with temperature ranging from 22 °C to 30 °C. The experiment was laid out in a Randomised Complete Block Design (RCBD) with three replications. The seeds were sown in trays and transplanted to the field after 21 days of sowing with a planting distance of 25 cm × 25 cm. The experiment was fully irrigated with the average water level of 10 cm above the soil level throughout the trial. Regular hand weeding and use of selective herbicide (Southern Ag with active Ingredient halosulfuron methyl) were used to control broadleaf weed to free the rice plant from the interspecific competition. Fertilisation was applied following the recommendation from MARDI where 42 kg/ha muriate of potash and 57 kg/ha triple superphosphate were applied at day 15 after transplanting, 80 kg/ha of urea was applied in splits at 35, 55 and 75 days after planting. Insecticides were applied for controlling insects and pests when the need arises at recommended rates.
Table 1. List and origin of selected coloured rice accessions in this study.
Morphological data collection
From each accession, six plants were randomly sampled from the middle row in each replication for morphological observation. The data for all traits were recorded based on the Standard Evaluation System (SES) for rice [Citation8] for vegetative, grain quality, yield and yield-related traits. Morphological data that were collected included: plant height (cm), flag leaf length (cm), flag leaf width (cm), leaf area (cm2), days to heading (days), days to maturity (days), panicle length (cm), number of tillers per hill (number), grain yield per hill (g), 1000-grain weight (g), filled grain percentage (%), grain length (mm) and grain width (mm).
Grain quality traits data collection
The harvested grains were threshed manually followed by dehusking using THU35B Testing Husker (Satake, Japan) and polished using a Testing Mill (Satake, Japan) before evaluation of grain quality traits. The milled unbroken rice was separated from broken rice by using TRG05B Testing Rice Grader (Satake, Japan). Measured grain quality traits include dehulled grain length (mm), dehulled grain width (mm) and head rice recovery (%) following the method described by International Rice Research Institute [Citation12].
Grain quality analysis
Finely ground 0.1 g rice powder was used for determination of amylose content following the standard method proposed by Juliano [Citation13]. Amylose content was classified into different scales based on grain type into waxy (0–2%), very low (2–9%), low (10–20%), intermediate (20–25%) and high (25–30%) as described by IRRI [Citation12]. The alkaline spreading value was determined following the method described by Bhattacharya and Sowbhagya [Citation14] with minor modification. Ten milled kernels from each variety were soaked in a Petri dish overnight in 15 mL of potassium hydroxide at 1.7% concentration. The grains were arranged carefully so they do not touch each other. The Petri dish was then covered and allowed to stand for 23 h at ambient temperature. The degree of spreading was measured using a seven-point scale as described by IRRI [Citation12]. Gel consistency (GC) of rice flour from different accessions was determined following the modified method proposed by Juliano [Citation13]. The GC was then estimated by the length of gel travelled using a modified method of Cagampang et al. [Citation15]. Total phenolic content was determined using the Folin Ciocalteu’s reagent with slight modification [Citation16], while the total antioxidant capacity was determined spectrophotometrically by a method adapted from Yafang et al. [Citation16].
Genomic DNA extraction and SSR marker selection
Five plants from each variety were bulk harvested for genomic DNA extraction using the CTAB method with slight modifications following the protocol described by Doyle and Doyle [Citation17]. The final extract of DNA in a pellet form was washed with 75% ethanol, dissolved in 50 mL Tris–ethylenediaminetetraacetic acid (TE) buffer and treated with RNase (First BASE Laboratories Sdn Bhd, Malaysia). The quality of the extracted DNA was checked using a spectrophotometer (ND-1000, NanoDrop Technologies Inc., Wilmington, DE, USA). Finally, the DNA stock solutions were diluted with 1× TE buffer containing 1 mmol/L of ethylenediaminetetracetic acid, 10 of mmol/L Tris–HCl and pH of 8.0 to obtain a concentration of 70 ng/μL and were kept at −20 °C until use for the PCR analysis. In this study, 68 SSR markers reported in Gramene database ( http://www.gramene.org/) were screened to select microsatellite markers suitable for the assessment of genetic diversity of coloured rice germplasm. The characteristics of the alleles and polymorphisms of primers were examined after removing the markers that showed no obvious bands, dominant form or had low repeatability when the PCR was performed. Only 34 microsatellite markers were deemed suitable. The 34 microsatellite markers that showed high polymorphism rates, high repeatability and co-dominance, were selected to evaluate the diversity among the 32 rice germplasm resources ().
Table 2. Information about the selected 34 SSR markers used in this study.
PCR amplification and gel electrophoresis
The PCR mixture was prepared to contain all required components in 0.2-mL microcentrifuge tubes. The final volume of PCR amplification cocktail of 15 μL reaction mixtures, contains 3.0 μL of 5X PCR buffer, 0.8 μL MgCl2 (25 mmol/L), 3.0 μL of 1 mmol/L dNTPs, 1.0 μL of 10 mmol/L each forward and reverse primer, 2.0 μL of diluted template DNA (50 ng/μL), 0.1 μL (5 Unit/μL) Taq DNA polymerase (Thermo Fisher Scientific – USA) and 4.1 μL of ddH2O. The DNA thermal cycler (Model: Eppendorf 5331 Mastercycler Gradient 96 Well PCR Thermal Cycler) was used for the PCR following a modified touchdown protocol [Citation18]. After initial denaturation for 5 min at 94 °C, each cycle comprised of 1 min denaturation at 94 °C, 1 min annealing at 55–67 °C, and 2 min extension at 72 °C with a final extension for 5 min at 72 °C at the end of 35 cycles. For the amplified DNA fragments, 5 μL of PCR product was separated on 3% MetaPhor™ agarose (Lonza Rockland, Inc., USA) with 1X TBE buffer (pH 8.0, 1 mmol/L ethylenediaminetetraacetic acid (EDTA), 0.05 mol/L boric acid and 0.05 mol/L Tris) that had been pre-stained with Midori Green Nucleic Acid Staining Solution (1:100,000) and run at 89 V for 30 min. The gel picture was visualised under UV light and documented using the BioRad molecular imager®.
Scoring of the amplified bands
The gel pictures were analysed using BioRad Image Lab 3.0 software for the band size of the amplified product for the 32 accessions with 34 primers using 50 bp DNA ladder (GeneDireX, USA) in each gel. Band scoring data were entered as discrete variables (0 and 1) in a binary matrix as described by [Citation19–22]. The ‘0′ represented absence and ‘1′ represented presence of a band. All bands produced in a lane were compared transversely with other lanes and similar band size was presumed to be representative of the same locus as the position and number of band(s) in a lane express the allelic pattern created by a primer. The 0/1 binary matrix was used in calculating similarity as DICE coefficient using similarity for qualitative data (SIMQUAL). The genetic similarity was then converted to genetic dissimilarity. A dendrogram was generated to group individuals into different clusters using the unweighted pair group method with arithmetic mean (UPGMA) clustering procedure based on the dissimilarity matrix with NTSYS-pc (version 2.02). The observed number of alleles, effective number of alleles, efficiency of allele, expected heterozygosity, observed heterozygosity, polymorphic information content and Shannon’s Information index were calculated using POPGENE software (version 1.31).
Data analysis
The morphological data obtained were subjected to analysis of variance (ANOVA) using SAS software version 9.1 (SAS Institute Inc., Cary, NC, USA). Mean separation among accessions was done using least significant difference (LSD) test at 5% significance level. Cluster analyses were carried out using NTSYS software to quantify genetic diversity of all quantitative traits as described by Oladosu et al. [Citation23]. Cluster analysis was performed using the UPGMA (unweighted pair group method with arithmetic mean) based on distance matrix obtained for morphological traits and the genetic data using NTSYS software (version 2.1). The variance component was estimated for the rice population on all characters using the following equation:
where MSG is the mean square of accessions, MSE is the mean square of error, r is the number of replications, and
is the mean of the trait.
Results and discussion
Genetic diversity assesment using morphological traits
Analysis of variance for all the traits is presented in . All the evaluated traits showed highly significant differences (p ≤ 0.01) among the 32 accessions except for head rice recovery percentage and broken rice percentage, which had a significant difference at p ≤ 0.05 (). Significant differences observed among the 32 varieties pointed at the existence of variation in the evaluated population. The differences exhibited by these varieties could be attributed to the fact that they originated from different areas. The mean comparison for the traits is presented in . The highest plant height was recorded for DV107 (122.10 cm), followed by Tidong Tambunan (119.23 cm) and Padi Randau (117.92 cm). Plant height is one of the most important selection criteria for modern rice varietal development. Tall varieties such as DV107, Tidong Tambunan and Padi Randau have the ability to elongate with the rise of water. These particular varieties are useful in rice breeding programmes for flood-prone areas. However, among the disadvantage of tall plant is inter- or intraspecies shading, which causes reduction in photosynthetic efficiency when the light receptor receives solar energy below the threshold [Citation23]. Among all the accessions, the longest flag leaf length was recorded for accession Pulut Merah 3 (41.99 cm), whereas the shortest was recorded in Tomoemochi (20.58 cm). On the other hand, for the trait flag leaf width, the widest and narrowest values were found in accession Hitam (2.15 cm) and Ceylon31 (1.07 cm), respectively. According to Tari et al. [Citation24], the flag leaf area is an important factor which contributes 41% to 43% yield increase. Plants with greater flag leaf length had elongated panicle length, thus producing an increased number of primary and secondary rachis, resulting in an increased number of grains in the panicle, which ultimately improved the yield [Citation25].
Table 3. Analysis of variance for all traits in 32 coloured rice accessions.
Table 4. Accessions means and standard error (±) for all traits.
For the trait leaf area, the highest value was observed in accession Hitam (58.92 cm2) followed by Pulut Merah 3 (57.94 cm2). In contrast, accession Ceylon31 and Tomoemochi had the lowest values, 18.99 cm2 and 20.14 cm2, respectively (). This characteristic is relevant to support higher grain yield because of the contribution of solar interception and photosynthate production [Citation23, Citation26]. The highest number of days to heading was recorded for accessions Padi Beranti and Hitam at 106 and 105 days, whereas the least number of days to heading was observed in accession MR263 (76 days) followed by MR219 (78 days), and CTG680 (83 days) as presented in . In general the collection was characterised by high diversity for the trait days to heading. Early flowering indicates a short life cycle and is considered a positive character for rice improvement. Early maturing varieties are advantageous in areas with short rainfall duration because these varieties reach maturity faster and, due to the fast growth rate, can better compete with weeds [Citation23]. The trait days to maturity ranged from 104 (MR263) to 146 (Pulut Merah 3) with an average of 98 days (). For commercial varietal development of short day maturity (85–105 days) with high yield characteristics is preferable by farmers to ensure maximum return within the shortest time. Panicle length (PL), ranged from 19.45 cm (Ceylon31) to 28.53 cm (Pulut Merah 3) with an average of 24.66 cm. Accession Ceylon31 was also characterised by the highest number of tillers (22.10). The highest grain yield per hill was produced by accession DNJ128 (74.61 g), closely followed by Panbira (66.22 g) and H10 (65.09 g) as shown in . As reported by Oladosu et al. [Citation27], the grain yield per hill does not exist in isolation but rather as a result of interrelation and association with other traits that form a complex relationship that ultimately affects the yield. The thousand-grain weight ranged from 9.23 g (DL11) to 34.37 g (DNJ128) with a mean of 25.20 g. Percentage of filled grain is one of the major contributors to high rice yield per hectare. Accession DV112 had the highest percentage of filled grain (91.41%), whereas in contrast, accession Hitam (31.48%) had the lowest value. The results showed the presence of variation among the accessions on grain length and width and the range was 6.80 to 11.90 mm and 2.16 mm to 3.81, respectively. Santhi and Vijayakumar [Citation28] found that the grain length ranged from 8.31 to 8.65 mm and the grain width was 3.00 to 3.04 mm in Kavun brown rice variety evaluated in India. In another study on a commercial rice variety, Vanaja and Babu [Citation29] reported wide variation in grain length from 7.35 mm to 10.11 mm and grain width from 2.56 to 3.76 mm. In this study, the top three longest grain lenth were accessions Pulut Merah 3 (11.90 mm), MRQ76 (10.46 mm) and MR263 (10.02 mm) and the shortest was Panbira (6.80 mm). The accession characterised by the widest grain width was Tidong Tambunan (3.81 mm), whereas MRQ74 produced the narrowest grains (2.16 mm). Grain length and width are among the important contributory traits for physical grain quality grading [Citation30].
Accession Pulut Merah 3 produced the longest dehulled grain (7.98 mm), followed by DV 107 (7.41 mm), whereas Ceylon8 had the shortest (4.59 mm). The accessions Pulut A and Tahi Ayam had a similar long-grain category (>6.61 mm) dehulled grain length (6.86 mm) (). According to Adu-Kwarteng et al. [Citation31], the classification of rice quality depends on the length of grain, namely; short (<5.50 mm), medium (5.50 − 6.60 mm) and long (>6.60 mm) grain. The results indicated that 15 accessions have slender grain shape (>3 ratios) and 17 accessions with medium grain shape (2.1–3 ratio). The length to width ratio of dehulled coloured rice ranged from 2.18 to 4.90. The highest ratio was found in accession Pulut Merah 3, followed by accessions MRQ74, MRQ76 and MR219 at 4.50, 4.28 and 4.18, respectively (). Grain shape is simultaneously controlled by endosperm, cytoplasmic as well as maternal genes [Citation32]. The head rice recovery (HRR) percentage ranged from 64.07 to 97.65%. The higher HRR was recorded in accession Ceylon31 (97.65%) followed by DNJ128 (94.48%), Taitong16 (93.47%) and DNJ129 (93.42%). The HRR value depends on the grain type, chalkiness, cultivation or management practices and post-harvest technology [Citation2]. With respect to broken rice (BR) percentage, the value ranged from 2.35 to 35.99%, the lowest was found in Ceylon31 and the highest value was observed in Ringan Bawang (). The HRR measured the milling quality that greatly influences the rice market price. It is often determined as the percentage of paddy rice that retains above 75% of its original length after the milling processes. One of the major criteria for adoption of a new rice variety by farmers is that should satisfy 55% and above of consumer requirements [Citation3]. Therefore, HRR is an important trait in new varietal development prior to release. Although the amount of HRR is controlled by the genetic background of the rice and also influenced by the environment. From this study, accessions Ceylon31 and DNJ128 can be used as donor parents for the development of rice varieties with high grain HRR.
Three characteristics of grain chemical quality, namely, amylose content, alkaline spreading value and gel consistency; and two characteristics of antioxidant properties, phenolic content and total antioxidant capacity, were analysed in all the accessions. In the case of amylose content, an intermediate value (20 to 25%) is preferred among Malaysians [Citation3]. In the present study, 11 out of 32 varieties exhibited an intermediate level of amylose. The highest amylose content was observed in DZ193 (25.20%) followed by DZ112 (24.03%) and Panbira (24.07%), whereas the lowest value was observed in Tomoemochi and Padi Beranti at 11.10 and 11.97%, respectively, as indicated in . Hence, the selection of varieties with considerable amylose content that can ensure desirable texture of the cooked rice, can be possible starting from materials included in the studied collection. The gel consistency is measured as the texture of cooked rice after cooling following the completion of the cooking process [Citation15]. Variety DNJ129 (99.33 mm) produced the highest value for gel consistency followed equally by Ceylon8 (99.33 mm), Ceylon31 (98.00 mm) and DL11 (96.67 mm), whereas Kataktara (26.00 mm) had the lowest value followed equally by Samambo (26.00 mm). Virtually all the varieties had a considerable value for gel consistency with the average value of 58.83 mm (). Gelatinisation temperature (GT) is used to determine the required time for cooking. GT is a physical property of starch and is the range of temperature at which the starch granules begin to swell irreversibly in hot water [Citation33]. A negative correlation between alkaline spreading value and gelatinisation temperature exists in rice varieties [Citation14]. And those with low ASV had high GT. The mean comparison among the 32 varieties for alkaline spreading showed that variety YTM15 had the highest value of 6.43% followed by MR263, DV107 and MRQ76 at 4.47%, 4.20% and 4.07% respectively. The highest phenolic content was found in Ringan Bawang (23.67), which was not significantly different from Hashikalmi (22.33) and Ceylon31 (22.00). The lowest phenolic content was found in Dular (CI-18006) and Kataktara at 6.00, respectively (). Pigmented rice is one of the good sources of antioxidative compounds, and phenolic compounds significantly contribute to rice antioxidant properties. As far as antioxidant activities are concerned, Sani et al. [Citation3] reported that non-pigmented rice contained less antioxidative properties as compared with pigmented rice. In this study, the brown pigmented rice had the highest antioxidative properties compared to red and light brown rice, wheras white rice had the least value. The total antioxidant capacity ranged from 34.90 to 12.10 with an average value of 28.24. The highest total antioxidant capacity was recorded for DNJ128 (34.90) followed by Pulut A (34.87), whereas Dular (CI-18006) and Panbira had the lowest value 12.10 each for total antioxidant capacity ().
Heritability estimation, phenotypic and genotypic coefficient of variation
The broad-sense heritability for all characters ranged from 23.01 to 99.45% (). Most of the traits showed relatively high heritability values (>70%) except for grain yield per hill (43.30%), number of tillers (39.98%), flag leaf length (63.95%), head rice recovery (23.01%) and broken rice percentage (23.01%). Broken rice percentage had the highest PCV (72.11%) and the lowest value was recorded by days to maturity (7.00%). However, the highest value of GCV was found in phenolic content (39.03%) and low GCV (<10%) were observed in panicle length (7.80%), days to heading (7.68%), days to maturity (6.80%) and head rice recovery (5.00%). Grain chemical quality and antioxidant properties had higher PCV compared to grain physical quality and morphological trait. The differences between PCV and GCV values were relatively low (<2%) for all traits except for number of tillers, flag leaf length, leaf area, grain yield per hill, head rice recovery, broken rice percentage, gel consistency and phenolic content. The present results demonstrated a relatively higher influence of environmental factors on the expression of these characteristics.
Table 5. Variance components, heritability values, phenotypic and genotypic coefficient variation for all traits.
In this study, most of the grain quality traits showed high heritability values, suggesting that these characteristics can be used as selection criteria for rice grain quality improvement programmes. These results support earlier findings where a high broad-sense heritability value on grain quality traits in a different rice population was reported by Vanaja and Babu, [Citation29]. In contrast, Rafii et al. [Citation34] reported that grain quality characteristics such as grain length, grain width, gel consistency and amylose content had low heritability in a Malaysian rice population. High heritability values for the traits studied in this population indicated that direct selection for these traits would potentially result in high genetic gains. Phenotypic and genotypic coefficients of variation (PCV and GCV) measure the character variability due to phenotype and genetic factors, respectively. The extent of the environmental influence on the variability of any character is indicated by the magnitude of the differences between the PCV and GCV. A large difference reflects high environmental influence, whereas a small difference reveals high genetic influence. High heritability together with a high genotypic coefficient of variation is mostly desirable. Thus, the traits with high heritability and genotypic coefficient of variation are selected. In this study, filled grain percentage, leaf area, plant height and thousand-grain weight had higher values for the genotypic coefficient of variation and heritability.
Assessment of genetic diversity using quantitative traits
Cluster analysis by the UPGMA dendrogram classified the 32 rice accessions into four major clusters at 1.58 dissimilarity coefficient (). This implies a high level of morphological diversity in the rice varieties. Cluster I consisted of seven accessions, Cluster II had 11 accessions, Cluster III had two accessions and Cluster IV consisted of 12 accessions (). Cluster I had the highest mean values of flag leaf length, flag leaf width, leaf area, days to heading, days to maturity, panicle length and broken rice percentage. This cluster encompasses commercial and traditional varieties from the same origin (). With regard to Cluster II, the highest mean values of plant height, number of tillers, grain yield per hill, thousand-grain weight, grain width, head rice recovery and amylose content were recorded (). All accessions in this cluster are traditional cultivars from various geographical origins. For Cluster III, recorded the highest values on grain quality traits, namely grain length, grain length to width ratio, dehulled grain length, dehulled grain length to width ratio and alkaline spreading value but had the lowest values on morphological and antioxidant properties such as plant height, flag leaf length, flag leaf width, leaf area, days to heading, days to maturity, thousand grain weight, grain width, dehulled grain width, head rice recovery, gel consistency, phenolic content and total antioxidant capacity (). Cluster IV had the highest mean values for filled grain percentage, dehulled grain width, gel consistency, phenolic content and total antioxidant capacity (). Selection of accessions for a specific breeding objective could be based on quantitative traits of this cluster analysis. For example, to develop high antioxidant and phenolic content breeding population, the accessions from the Cluster IV could be selected. Oladosu et al. [Citation23] also suggested that genetic divergence analysis among rice accessions based on quantitative traits could be used to classify and distinguish varietal differences in a population. This result is in accordance with the findings reported by Mazid et al. [Citation35] on 41 rice accessions which were grouped into six clusters based on 13 morphological and yield traits. This study revealed the effectiveness of quantitative or morphological traits in grouping rice varieties. This genetic divergence analysis also plays a vital role in the selection of diverse varieties for the further improvement of rice varieties through breeding.
Figure 1. Dendrogram resulting from UPGMA cluster analysis, based on genetic relationships generated by quantitative traits of 32 coloured rice accessions. Note: G1 = MR219, G2 = MR263, G3 = DL11, G4 = DL12, G5 = Ceylon8, G6 = Ceylon31, G7 = CTG680, G8 = Hitam, G9 = H10, G10 = Panbira, G11 = Taitong16, G12 = Hashikalmi, G13 = DV 107, G14 = DV112, G15 = DZ193, G16 = DNJ128, G17 = DNJ 129, G18 = Padi Beranti, G19 = Padi Randau, G20 = Tahi Ayam, G21 = Tidong Tambunan, G22 = Pulut Merah 3, G23 = Dular (CI-18006), G24 = Tomoemochi, G25 = Dendam Berahi, G26 = Kataktara, G27 = Ringan Bawang, G28 = Samambo, G29 = Pulut A, G30 = YTM15, G31 = MRQ76, G32 = MRQ74.
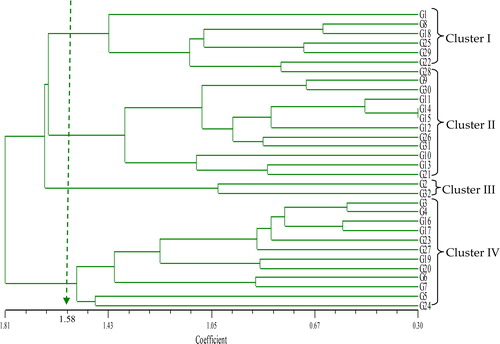
Table 6. Mean values with ranking of four clusters for all traits in 32 coloured rice accessions.
Allelic variation among the accessions
A total of 706 alleles were amplified with 34 polymorphic SSR markers and the average number of alleles per locus was 20.76, ranging from 11 to 38 (). The maximum number of alleles (38 alleles) and effective alleles (28.17) were scored at the locus RM281 and the minimum alleles (11 alleles) were observed in RM137 and RM223, whereas, the lowest effective alleles were found in RM223 (7.82). In the previous study, Kumar et al. [Citation36] reported a total number of 467 alleles ranging from 1 to 10 per locus in 64 rice accessions using 8 polymorphic SSR markers. In a different study on the genetic diversity of coloured and aromatic rice in India using 24 SSR markers, Ashraf et al. [Citation19] recorded a maximum of six alleles in four primers. In this study, the highest allele efficiency (88.02%) was observed in RM400 and the lowest (48.09%) was in RM334 (). The observed heterozygosity ranged from 0.0 (RM7, RM25, RM38, RM133, RM137, RM144, RM256, and RM339) to 1.0 (RM52). The PIC value is a reflection of allele diversity and frequency among the accessions. High PIC values indicate that the marker is highly informative. The PIC value of this coloured rice population was between 0.86 (RM137) and 0.97 (RM400) with an average of 0.92. This indicated that the SSR markers used in this study are effective to determine the genetic divergence among the accessions (). Among the primers used in the study, RM400 is highly informative since it showed a high PIC value (0.97). The result was compatible with other genetic diversity studies on rice where the value ranged from 0.76 to 0.94 [Citation37]. According to DeWoody et al. [Citation38], among 25 SSR markers used, only 10, or 40% of the markers were highly informative with the value of 0.5. Lapitan et al. [Citation39] reported 164 SSR markers, among which 92% were polymorphic and computed the highest (0.91) and lowest (0.18) PIC values of genetic diversity of Philippines rice. Oladosu et al. [Citation4] suggested Shannon’s information index and expected heterozygosity (He) were used as intrapopulation gene diversity indicators. The average of genetic diversity based on Shannon’s information index and expected heterozygosity were 2.80 and 0.94 for all accessions. Thus, this result showed that the accessions used in this research were rich in genetic diversity and hybridisation of highly diverse varieties would lead to higher heterosis [Citation23]. The highest diversity value recorded was 3.52 for marker RM400 ().
Figure 2. Polymorphism observed among coloured rice accessions using RM342 SSR (a) and RM400 SSR marker (b), L = ladder (50 bp).
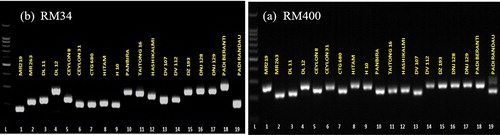
Table 7. Genetic diversity parameters using 34 SSR markers for all rice accessions.
Clustering analysis using SSR markers
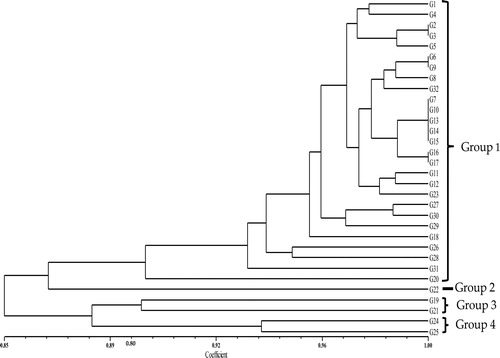
The SSR marker data from the selected primers were subjected to cluster analysis using the NTSYS program. A dendrogram was generated by UPGMA to show the genetic relationships of the coloured rice accessions. indicated that Group 1 consisted of 27 accessions whereas Group 3 and 4 comprised only 2 accessions without any sub-groups, while group 2 had only one accession. The cluster analysis showed a significant genetic variation among the rice accessions, with similarity coefficients ranging from 0.85 and 1.00. The constructed dendrogram revealed that similar accessions clustered more or less together. The accessions were clustered into four different groups at the similarity coefficient of 0.89 (). The cophenetic correlation coefficient was 0.89, indicated that the produced dendrogram was a good illustration of data. The correlation between the matrix produced by the SAHN procedure and the similarity coefficient matrix using the MXCOMP procedure was 0.9 indicating that the produced dendrogram was a good representation of the data [Citation40]. A comparison of molecular markers and morphological traits was performed in this study to explore the efficacy of molecular markers as an alternative and/or complement for varietal distinction based on morphological criteria. As reported by Oladosu et al. [Citation4], variability based on molecular assessment alone may not fully explain quantitative genetic diversity. Therefore, the combination of molecular and phenotypic genetic diversity assessment of coloured rice is a more reliable alternative in breeding programmes. From the constructed dendrogram of morphological traits and SSR markers in this study, there are differences in the grouping patterns. The difference in swapping of genotypes and clustering patterns in different methods of analysing diversity has been reported in numerous studies [1, 4, 5, and Citation35]. Differences in the clustering pattern are not an indicator of the weakness, limitation or failure of the methods. Therefore, the differences observed in this study may be due to the variability at the molecular level which may not translate to diversity at the agro-morphological level. If the number of markers used is in thousands, and all the parameter studies are contained in morphological traits, then it is expected to have similar grouping patterns. Another potential reason for this variation is the influence of environmental factors (such as temperature, humidity, disease incidence and light intensity) on morphological traits. Hence, different grouping patterns in different methods are not unusual.
Figure 3. Dendogram resulting from UPGMA cluster analysis of 32 rice accessions, based on genetic relationships generated by 34 SSR markers. Note: G1 = MR219, G2 = MR263, G3 = DL11, G4 = DL12, G5 = Ceylon8, G6 = Ceylon31, G7 = CTG680, G8 = Hitam, G9 = H10, G10 = Panbira, G11 = Taitong16, G12 = Hashikalmi, G13 = DV 107, G14 = DV112, G15 = DZ193, G16 = DNJ128, G17 = DNJ 129, G18 = Padi Beranti, G19 = Padi Randau, G20 = Tahi Ayam, G21 = Tidong Tambunan, G22 = Pulut Merah 3, G23 = Dular (CI-18006), G24 = Tomoemochi, G25 = Dendam Berahi, G26 = Kataktara, G27 = Ringan Bawang, G28 = Samambo, G29 = Pulut A, G30 = YTM15.G31 = MRQ76, G32 = MRQ74.
Conclusions
Exploring the genetic variation plays a major role in varietal improvement that could lead to attainment of food security. This is because genetic variations give room for recombinants which are essential in development of new varieties. In this study, genotypic and phenotypic analysis has provided clues in the identification of the divergence among coloured rice germplasm in Malaysia. Accessions such as YTM15, Pulut Merah 3, Padi Randau, Ringan Bawang, DNJ128 and DV 107 can be potentially selected for development of new varieties for local cultivation which could assist in the attainment of higher heterosis or vigour among the germplasm. This finding indicated the possibility of obtaining adequate polymorphism among coloured rice accessions using SSR makers, and it also elucidates the codominant and neutral nature of SSR markers as a powerful tool to assess the genetic variability of the cultivars. This information about the genetic variability will then be useful for the selection, classification, conservation, identification of parental source and utilisation for breeding programmes, such as marker-assisted selection (MAS) in pigmented rice improvement.
Disclosure statement
There is no conflict of interest to declare among the authors.
Additional information
Funding
References
- Jasim AS, Rafii MY, Latif MA, et al. Genetic diversity of aromatic rice germplasm revealed by SSR markers. Biomed Res Int. 2018;2018:7658032 doi.10.1155/2018/7658032.
- Dipti SS, Bergman C, Indrasari SD, et al. The potential of rice to offer solutions for malnutrition and chronic diseases. Rice (N Y)). 2012; 5(1):161-18.
- Sani NA, Sawei J, Ratnam W, et al. Physical, antioxidant and antibacterial properties of rice (Oryza sativa L.) and glutinous rice (Oryza sativa var. glutinosa) from local cultivators and markets of Peninsular, Malaysia. Int Food Res J. 2018; 25(6):2328–2336.
- Oladosu Y, Rafii MY, Abdullah N, et al. Genetic variability and diversity of mutant rice revealed by quantitative traits and molecular markers. Agrociencia. 2014; 2014(3):1–266.
- Sorkheh K, Masaeli M, Chaleshtori MH, et al. AFLP-based analysis of genetic diversity, population structure, and relationships with agronomic traits in rice germplasm from north region of IRAN and world core germplasm set. Biochem Genet. 2016; 54(2):177–193.
- Reinke R. Evaluating diversity array technology (DArT) for the NSW rice breeding program. Canberra: Rural Industries Research and Development Corporation; 2006.
- Zhang Q, Maroof MS, Lu TY, et al. Genetic diversity and differentiation of indica and japonica rice detected by RFLP analysis. Theor Appl Genet. 1992; 83(4):495–499.
- Bansal H, Kumar R, Vivek V, et al. Analysis of diversity in rice (Oryza sativa L.) using random amplified polymorphic DNA (RAPD) and simple sequence repeats (SSR) markers. Afr J Biotechnol. 2013;12(35):5404–5412.
- Usman MG, Rafii MY, Martini MY, et al. Introgression of heat shock protein (Hsp70 and sHsp) genes into the Malaysian elite chilli variety Kulai (Capsicum annuum L.) through the application of marker-assisted backcrossing (MAB). Cell Stress Chaperones. 2018;23(2):223–234.
- Chukwu SC, Rafii MY, Ramlee SI, et al. Bacterial leaf blight resistance in rice: a review of conventional breeding to molecular approach. Mol Biol Rep. 2019;46(1):1519–1532.
- Chukwu SC, Rafii MY, Ramlee SI, et al. Marker-assisted selection and gene pyramiding for resistance to bacterial leaf blight disease of rice (Oryza sativa L.). Biotechnol Biotec Eq. 2019;33(1):440–455.
- IRRI. Standard evaluation system for rice. 5th ed. Manila, Philippines: International Rice Research Institute; 2002.
- Juliano BO. A simplified assay for dehulled rice amylose. Cereal Sci Today. 1971; 16:334–338.
- Bhattacharya KR, Sowbhagya CM. An improved alkali reaction test for rice quality. IJFST. 2007; 7(3):323–331.
- Cagampang GB, Perez CM, Juliano BO. A gel consistency test for eating quality of rice. J Sci Food Agric. 1973;24(12):1589–1594.
- Yafang S, Gan Z, Jinsong B. Total phenolic content and antioxidant capacity of rice grains with extremely small size. Afr J Agric Res. 2011; 6:2289–2293.
- Doyle JJ, Doyle JL. Isolation of plant DNA from fresh tissues. Focus. 1990; 12:13–15.
- Green MR, Sambrook J. Touchdown polymerase chain reaction (PCR). Cold Spring Harb. Protoc. 2018;2018(5):pdb-prot095133. [cited 2020 Feb 15]
- Ashraf H, Husaini AM, Bhat MA, et al. SSR based genetic diversity of pigmented and aromatic rice (Oryza sativa L.) genotypes of the western Himalayan region of India. Physiol Mol Biol Plants. 2016; 22(4):547–555.
- Huang M, Wu Y-H, Tao X-X, et al. Genetic diversity of main inbred Indica rice varieties applied in Guangdong Province as revealed by molecular marker. Rice Sci. 2015; 22(1):1–8.
- Chen C, He W, Nassirou TY, et al. Molecular characterization and genetic diversity of different genotypes of Oryza sativa and Oryza glaberrima. Electron J Biotechnol. 2017; 30:48–57.
- Tu Anh T, Khanh T, Dat T, et al. Identification of phenotypic variation and genetic diversity in rice (Oryza sativa L.) mutants. Agriculture. 2018; 8(2):30. doi.10.3390/agriculture8020030
- Oladosu Y, Rafii MY, Abdullah N, et al. Genetic variability and selection criteria in rice mutant lines as revealed by quantitative traits. ScientWorld J. 2014; 2014:190531 doi.10.1155/2014/190531
- Tari DB, Gazanchian A, Pirdashti HA, et al. Flag leaf morphophysiological response to different agronomical treatments in a promising line of rice. Am –Eurasian J Sustain. 2009; 5:403–408.
- Oladosu Y, Rafii MY, Magaji U, et al. Genotypic and phenotypic relationship among yield components in rice under tropical conditions. Biomed Res Int. 2018; 2018:1–10.
- Ashrafuzzaman M, Islam MR, Ismail MR, et al. Evaluation of six aromatic rice varieties for yield and yield contributing characters. Int J Agric Biol. 2009; 11:616–620.
- Oladosu Y, Rafii MY, Abdullah N, et al. Genotype × Environment interaction and stability analyses of yield and yield components of established and mutant rice genotypes tested in multiple locations in Malaysia. Acta Agr Scand B–S P. 2017; 67(7):590–606.
- Santhi K, Vijayakumar TP. Physical and functional characteristics of milling fractions of Indian Kavun pigmented brown rice (Oryza sativa L.). IJAFR. 2014; 4(2):78–83.
- Vanaja T, Babu LC. Variability in grain quality attributes of high yielding rice varieties (Oryza sativa L.) of diverse origin. Int J Trop Agric. 2006; 44(1-2):61–63.
- Shi C, Zhu J, Wu J, et al. Genetic and genotype × environment interaction effect from embryo, endosperm, cytoplasm and maternal plant for rice grain shape traits of indica rice. Field Crops Res. 2000;68(3):191–198.
- Adu-Kwarteng E, Ellis WO, Oduro I, et al. Rice grain quality: a comparison of local varieties with new varieties under study in Ghana. Food Control. 2003; 14(7):507–514.
- Shi C, Zhu J. Genetic analysis of endosperm, cytoplasmic and maternal effects for exterior quality traits in indica rice. Int J Biomath. 1996; 11:73–81.
- Faruq G, Hadjim K, Meisner CA. Inheritance of kernel elongation in rice. Int J Agric Biol. 2004;6(5):813–815.
- Rafii MY, Zakiah MZ, Asfaliza R, et al. Grain quality and performance and heritability estimation in selected F1 rice accessions. Sains Malaysiana. 2014; 43(1):1–7.
- Mazid MS, Rafii MY, Hanafi MM, et al. Agro morphological characterization and assessment of variability, heritability, genetic advance and divergence in bacterial blight resistant rice accessions. S. Afr. J. Bot. 2013; 86:15–22.
- Kumar R, Singh AK. Evaluation of genetic diversity in rice using simple sequence repeats (SSR) markers. Afr. J. Biotechno. 2012; 11(84):14988–14995.
- Hassan MM, Shamsuddin AKM, Islam MM, et al. Analysis of genetic diversity and population structure of some Bangladeshi rice landraces and HYV. J Sci Res. 2012;4(3):757–767.
- DeWoody JA, Honeycutt RL, Skow LC. Microsatellite markers in white-tailed deer. J Hered. 1995;86(4):317–319.
- Lapitan VC, Brar DS, Abe T, et al. Assessment of genetic diversity of Philippine rice cultivar carrying good quality traits using SSR markers. Breed Sci. 2007;57(4):263–270.
- Warbuton M, Crossa J. Data analysis in the CIMMYT applied biotechnology center for fingerprinting and genetic diversity studies. Mexico City, Mexico: International Maize and Wheat Improvement Center (CIMMYT);2002. Available from: http://repository.cimmyt.org/xmlui/bitstream/handle/10883/3493/79065.pdf?sequence=1. [cited 2020 Feb 15]