
 ?Mathematical formulae have been encoded as MathML and are displayed in this HTML version using MathJax in order to improve their display. Uncheck the box to turn MathJax off. This feature requires Javascript. Click on a formula to zoom.
Abstract
Juglans regia L. and J. sigillata D. have a long cultivation history in China. With the purpose of detecting interspecific and intraspecific genetic variation, 35 clonal cultivars of J. regia, J. sigillata, J. sigillata×J. regia and J. hopeiensis Hu. (J. mandshurica Maxim. ×J. regia) were selected from a broad geographic range and applied in amplified-fragment length polymorphism (AFLP) analysis. Clear-cut AFLP profiles were produced using 9 EcoR I/Mse I primer combinations. As for J. regia, J. sigillata and their hybrids, the percentages of polymorphic bands (PPBs) averaged 93.86%, 93.94% and 60.46%; the observed number of alleles (Na) averaged 1.5370, 1.6389 and 1.2593; the effective number of alleles (Ne) averaged 1.2582, 1.2543 and 1.1646; Nei's gene diversity (H) scored 0.1560, 0.1556 and 0.0951; Shannon’s information index (I) averaged 0.2402, 0.2459 and 0.1414, respectively. These results implied a moderate level of genetic diversity within the investigated species. The total gene diversity (Ht = 0.1596) can be distributed into intra- (Hs = 0.1356) and inter- (Dst = 0.0240) species gene diversity. The proportion of the distributed genetic diversity among populations (Gst) was 0.1505, indicating that only 15% of the total gene diversity was attributed to differences between species. The factorial correspondence analysis (FCA) and unweighted pair-group method of arithmetic averages (UPGMA) analysis revealed a close genetic distance between these two species.
Introduction
Juglans regia L. is widely cultivated throughout temperate regions of the world for its high quality edible nuts and its timber. J. sigillata D. is another species of genus Juglans native to China [Citation1]. Studies on their genetic diversity, structure and relationship have been based on morphology, cytological markers, isozyme markers and molecular markers [Citation2–4]. J. sigillata was taken as an independent species for a long time [Citation5]. However, Orel et al. [Citation6] studied the chloroplast DNA in the trnL-trnF region and suggested that the relationship between these two species was really close. Molecular genetic diversity studies carried out by Gunn et al. [Citation7] found it hard to discriminate J. regia from J. sigillata although genetic variations among and within villages were significant. Wang et al. [Citation3] suggested a moderately high level of polymorphism in Tibetan walnut populations on the basis of simple sequence repeat (SSR) analysis and proposed the presence of J. regia × J. sigillata hybrids. Furthermore, phylogenetic studies using chloroplast markers revealed they were clustered together in one group [Citation8]. A recently published study indicated they should be considered as a single species from section Juglans [Citation9]. A chromosome level study indicates that J. regia speciated with J. sigillata about 0.84 million years ago, much later than compared with other related species (2.64 million years) and the whole genome duplication event (24.48 million years) [Citation10]. These reports increased our understanding of walnut genetic diversity. However, genetic diversity and relationships among these two species and their hybrids are still in great need to be unveiled.
Genetic diversity and cultivar discrimination studies of non-wood-product forests are currently supported by molecular methods, such as molecular makers and genome sequencing [Citation11]. Amplified fragment length polymorphism (AFLP) technique is a reliable genetic marker with low cost, superior repeatability and high resolution [Citation12]. Thus, AFLP markers have been with broad application in systematics [Citation13], genetic diversity [Citation11,Citation12,Citation14], genetic linkage map construction [Citation15] and association analysis [Citation16] till now. Here, 35 clonal cultivars selected from the main cultivating area in China were applied in AFLP analysis. The purpose of this study was to analyze the genetic variation among and within the two species and their hybrids, which will provide essential information at the molecular level for future genetic studies and breeding.
Materials and methods
Plant materials
A total of 35 clonal cultivars from a broad geographic range (), including 15 J. regia cultivars, 14 J. sigillata cultivars, 5 hybrids of J. sigillata× J. regia (as a transitional type) and 1 J. hopeiensis Hu. cultivar (as an outgroup), were chosen for AFLP analysis (). Cultivars introduced from abroad were sampled in the Walnut Genebank in China National Clonal Plant Germplasm Repository (Tai’an City, Shandong Province, China), whereas the others were sampled form their area of origin (). The selected cultivars are listed in . Fresh leaves were collected from a single mature, healthy tree of each cultivar and frozen quickly and stored at −80 °C until DNA isolation.
Figure 1. Typical nut characteristics for Juglans regia (a), J. sigillata (b), J. sigillata × J. regia (c), and J. hopeiensis (d).
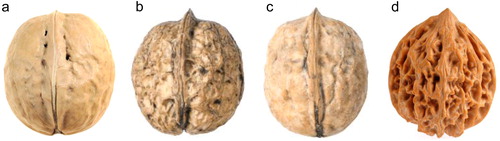
Table 1. Walnut cultivars (Juglans regia and J. sigillata) used for the AFLP analysis.
DNA isolation
DNA was extracted from the leaves and its quality determined following the protocol described by Chen et al. [Citation17].
AFLP analysis
The AFLP protocol was carried out using an AFLP Kit (Dingguo Bio-technology Co., Ltd., Beijing, China) following the manufacturer’s instructions. Fluorescently labeled primers were used for amplification, and the amplification products were detected on an ABI PRISM 377 DNA Sequencer. A total of 9 polymorphic EcoR I + 3/Mse I + 3 primer combinations were applied in the analysis of different accessions ().
Table 2. Summary of the AFLP markers scored for J. regia, J. sigillata and the hybrids using 9 primer combinations.
Statistical procedures
Bands with strong intensity were recorded and classified as present (1) or absent (0) for all accessions to construct a binary data matrix, from which markers lower than 70 bp were excluded. Cluster analysis was carried out using the UPGMA method [Citation11] with the NTSYSpc version 2.2 software package [Citation18] based on Dice’s coefficient. Factorial correspondence analysis (FCA) was carried out using GENETIX 4.05 software [Citation19,Citation20].
POPGENE32 software [Citation21] was employed to calculate the percentages of polymorphic bands (PPBs), observed number of alleles (Na), effective number of alleles (Ne), Nei's gene diversity (H) and Shannon’s information index (I) on the premise of the Hardy-Weinberg equilibrium. The total observed diversity estimate (Ht) was partitioned into within-group diversity (Hs) and between-group diversity (Dst) components, where Gene diversity between groups, in relation to total population diversity, was expressed as
Gene flow (Nm) was calculated as
Results and discussion
AFLP profiles and analysis
Clear-cut AFLP profiles for 35 assessed walnut cultivars were produced using 9 primer combinations (). One thousand and one out of 1276 AFLP bands for J. regia were polymorphic and 1014 fragments among the total 1079 exhibited polymorphisms for J. sigillata, whereas 423 out of 714 were polymorphic fragments for the hybrids. For J. hopeiensis, totally 491 fragments were detected. The fragment size of all samples ranged from 70 to 500 bp, and most of them were distributed between 70 and 300 bp. The averaged percentage of polymorphism for J. regia, J. sigillata and the hybrids scored 93.86%, 93.94% and 60.46% respectively, showing that PPBs of J. regia was comparable to that of J. sigillata but higher than that of the hybrids.
AFLP technology was previously applied in distinguishing walnut cultivars [Citation22]. And it was also reported that AFLP technology had been successfully applied into analyzing genetic relationships among species [Citation23–25]. The technique was demonstrated to be effective for identifying genotypes, evaluating genetic relationships, and determining genetic structure. Here, AFLP were employed in analyzing the genetic diversity of two walnut species with long-term cultivation history, J. regia and J. sigillata. The results obtained with 35 clonal cultivars chosen for AFLP analysis were repeatable and accurate.
Genetic diversity indices
Diversity parameters, including Na, Ne, H and I, were calculated according to the allele frequencies in each primer combination (). Na averaged 1.5370, 1.6389 and 1.2593 respectively. Ne averaged 1.2582, 1.2543 and 1.1646. H scored 0.1560, 0.1556 and 0.0951. I averaged 0.2402, 0.2459 and 0.1414. The total gene diversity (Ht = 0.1596) could be distributed into intra- (Hs = 0.1356) and inter- (Dst=0.0240) species gene diversity (). Gst was 0.1505, indicating that only 15% of the total gene diversity was attributed to differences between species ().
Table 3. Na, Ne, H, and I for J. regia, J. sigillata and the hybrids based on AFLP analysis.
H was an important index in the assessment of genetic diversity and could be used to estimate genetic variation among and within populations [Citation3,Citation7]. In this study, H scores of different species suggested that the polymorphic level for J. regia was comparable to that of J. sigillata but for J. sigillata×J. regia it was much lower. This was mainly because the 5 hybrids had similar pedigrees. Ht, Hs and Dst, which scored 0.1596, 0.1356 and 0.0240, were calculated based on H. I suggested that about 79.24% of the total genetic diversity was attributable to variation within species with only 20.76% among species. All these indices based on AFLP data indicated a very close sibship between J. regia and J. sigillata. Moreover, the parameter values for these two species were relatively high compared with Herpetospermum caudigerum (Na = 1.352, Ne = 1.188, H = 0.111 and I = 0.168) [Citation12], comparable to that of Glehnia littoralis (Na = 1.224, Ne = 1.235, H = 0.149, I = 0.238) [Citation11], but much lower than thyme (Na = 1.94, Ne = 1.28, H = 0.21, I = 0.36) [Citation13] based on AFLP data, which showed a moderate level of genetic diversity.
FCA analysis and UPGMA clustering
FCA analysis revealed that the first axis (axis 1) explained 8.88% of the percentage variation, whereas the second axis (axis 2) explained 7.02% (). To understand overall the genetic relationships among the 35 walnut cultivars, a dendrogram was constructed by UPGMA analysis (). According to the results of FCA and the dendrogram, the 35 walnut cultivars were divided into 2 main clusters (Cluster A and Cluster B). Cluster A comprised the control cultivar ‘Jilong’ (J. hopeiensis), whereas the other 34 cultivars were grouped into Cluster B. Nei's genetic similarity coefficients among these 4 populations are shown in . According to the UPGMA analysis, the 35 cultivars were separated into 6 groups (I–VI) at a Dice's coefficient level of 0.5133 (the averaged value). Group I contained 25 cultivars (10 J. regia, 10 J. sigillata and 5 hybrids). Group III consisted of 4 cultivars (J. regia) from Xinjiang Province. Group V had the cultivars ‘Xinguang’ (J. regia), ‘Zier’ and ‘Ziyuan’ (J. sigillata). Group II contained the cultivar ‘Santaihetao’ (J. sigillata). And group VI consisted of the cultivar ‘Jilong’ (). ‘Franquetty’ and ‘Xiangling’ were most closely related (with a Dice's similarity of 0.8081). ‘Ziyuan’ and ‘Jilong’ had the lowest genetic similarity, with a Dice's coefficient of 0.2784.
Figure 2. Factorial correspondence analysis (FCA) based on polymorphisms at AFLP loci for 35 walnut cultivars.
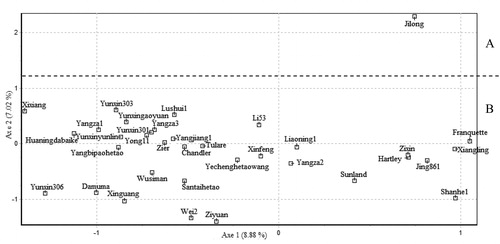
Figure 3. Dendrogram of 35 walnut cultivars based on AFLP analysis conducted using 9 primer combinations.
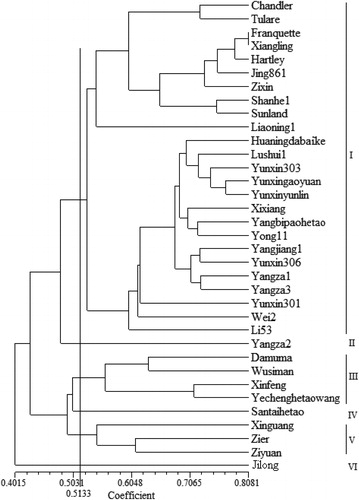
Table 4. Nei’s genetic identity (above diagonal) and genetic distance (below diagonal) among 4 groups.
‘Jilong’ was a clonal hybrid cultivar of J. hopeiensis and Mu et al. [Citation9] reported that J. hopeiensis was a hybrid of J. regia and J. mandshurica using 2b-RAD technology. They also considered J. hopeiensis, J. regia and J. sigillata to be a single species. In the present study, ‘Jilong’ was an outgroup and it was separated first, as expected. For cultivars of J. regia, J. sigillata and the hybrids, neither FCA nor the dendrogram could distinguish these 3 types distinctly. Most of the cultivars (25) referring to 3 types clustered in Group I. Five interspecific hybrids were clustered firstly with 10 J. sigillata cultivars and then formed a clade together with 10 J. regia cultivars. Group V comprised of ‘Xinguang’ (J. regia), ‘Zier’ and ‘Ziyuan’ (J. sigillata). A crossing result of J. sigillata×J. regia showed that their offspring were fertile and hybrids of J. regia×J. sigillata exhibited morphological characters of J. sigillata [Citation26]. Phylogenetic studies carried out based on chloroplast markers clustered them together in one clade [Citation8,Citation27]. Consistent with these studies, the results in the present study also suggested a close genetic distance among these two species and the hybrids. In addition, the cultivars investigated here are now popular in the walnut production of China, and the established genetic similarity could help future walnut germplasm identification, development and utilization.
Conclusions
In the present study, the genetic variations among and within J. regia, J. sigillata and their hybrids (J. sigillata×J. regia) were detected using the AFLP method. Genetic parameter values and cluster analysis implied a moderate level of genetic diversity within species and suggested a really close genetic relationship of interspecies. These results could provide essential information for further understanding the genetic differentiation and utilization strategies for walnut germplasm.
Disclosure statement
No potential conflict of interest was reported by the authors.
Data availability statement
The authors confirm that the data supporting the findings of this study are available within the article [and/or] its supplementary materials.
Additional information
Funding
References
- Ning DL, Wu T, Xiao LJ, et al. Chromosomal-level assembly of Juglans sigillata genome using Nanopore, BioNano, and Hi-C analysis. GigaScience. 2020;9(2);giaa006.
- Wang H, Pei D, Gu RS, et al. Genetic diversity and structure of walnut populations in central and southwestern China. J Amer Soc Hort Sci. 2008;133(2):197–203.
- Wang H, Pan G, Ma QG, et al. The genetic diversity and introgression of Juglans regia and J. sigillata in Tibet as revealed by SSR markers. Tree Genet Genom. 2015;11:804.
- Yuan XY, Sun YW, Bai XR, et al. Population structure, genetic diversity, and gene introgression of two closely related walnuts (Juglans regia and J. sigillata) in southwestern China revealed by EST-SSR markers. Forests. 2018;9(10):646.
- Lu AM, Stone DE, Grauke LJ. Juglandaceae. In: Wu ZY, Raven PH, Hong DY, eds. Flora of China. Vol. 4. Beijing (China): Science Press & Missouri Botanical Garden Press. 1999. p. 277–285.
- Orel G, Marchant AD, Mcleod JA, et al. Characterization of 11 Juglandaceae genotypes based on morphology, cpDNA and RAPD. HortSci. 2003;38(6):1178–1183.
- Gunn BF, Aradhya M, Salick JM, et al. Genetic variation in walnuts (Juglans regia and J. sigillata; Juglandaceae): species distinctions, human impacts, and the conservation of agrobiodiversity in Yunnan, China. Am J Bot. 2010;97(4):660–671.
- Hu Y, Woeste KE, Zhao P. Completion of the chloroplast genomes of five Chinese Juglans and their contribution to chloroplast phylogeny. Front Plant Sci. 2016;7:1955.
- Mu X-Y, Sun M, Yang P-F, et al. Unveiling the identity of Wenwan walnuts and phylogenetic relationships of Asian Juglans species using Restriction Site-Associated DNA-Sequencing. Front Plant Sci. 2017;8:1708.
- Zhang J, Zhang W, Ji F, et al. A high-quality walnut genome assembly reveals extensive gene expression divergences after whole-genome duplication. Plant Biotechnol J. 2020.
- Li B, Wang A, Zhang P, et al. Genetic diversity and population structure of endangered Glehnia littoralis (Apiaceae) in China based on AFLP analysis. Biotechnol Biotechnol Equip. 2019;33(1):331–337.
- Xu F, Lei P, Jiang M, et al. Genetic diversity of Herpetospermum caudigerum (Ser.) Baill using AFLP and chloroplast microsatellites. Biotechnol Biotechnol Equip. 2019;33(1):1260–1268.
- Rabiei B, Rastjoo M, Aliakbar A, et al. Phylogenetic relationships and genetic diversity of landrace populations of thyme (Thymus spp.) of Iran using AFLP markers and GC-MS. Braz J Bot. 2019;42(4):613–621.
- Wu Q, Sun L, Liu X, et al. Genetic diversity of Indigofera kirilowii Maxim. ex Palibin using AFLP markers. Bangl J Bot. 2019;48:1237–1241.
- Ikten H, Solak SS, Gulsen O, et al. Construction of genetic linkage map for Ficus carica L. based on AFLP, SSR, and SRAP markers. Hortic Environ Biotechnol. 2019;60(5):701–709.
- Saeed A, Darvishzadeh R. Association analysis of biotic and abiotic stresses resistance in chickpea (Cicer spp.) using AFLP markers. Biotechnol Biotechnol Equip. 2017;31:1–708.
- Chen L, Dong R, Ma Q, et al. Precocious genotypes and homozygous tendency generated by self-pollination in walnut. BMC Plant Biol. 2018;18(1):323.
- Rohlf FJ. NTSYSpc: numerical taxonomy and multivariate analysis system, Version 2.2. Exeter Software, Setauket; 2005.
- Belkhir KP, Borsa P, Chikhi L, et al. GENETIX 4.05, logiciel sous Windows TM pour la génétique des populations. Laboratoire Génome, Populations, Interactions, Université de Montpellier II, Montpellier, France; 2004.
- Bettaibi A, Mezghani-Khemakhem M, Soltani Z, et al. Development of polymorphic microsatellite loci for the tomato leaf miner, Tuta absoluta (Lepidoptera: Gelechiidae). J Genet. 2013;92(3):e110–e112.
- Zhan X, Li P, Hui W, et al. Genetic diversity and population structure of Toona ciliata revealed by simple sequence repeat markers. Biotechnol Biotechnol Equip. 2019;33(1):214–222.
- Shamasbi FV, Nasiri N, Shokri E. Genetic diversity of Persian ecotypes of Indian walnut (Aeluropus littoralis (Gouan) Pari.) by AFLP and ISSR markers. Cytol Genet. 2018;52(3):222–230.
- Bhattarai S, Coulman B, Fu YB, et al. Genetic diversity and relationship of sainfoin (Onobrychis viciifolia scop.) germplasm as revealed by amplified fragment length polymorphism markers. Can J Plant Sci. 2018;98(3):543–551.
- Sánchez-Gómez P, Jiménez Juan F, Cánovas JL, et al. Genetic structure and phylogeography of Juniperus phoenicea complex throughout Mediterranean and Macaronesian regions: different stories in one. Ann Forest Sci. 2018;75:75.
- Peng YQ, Fan LL, Mao FY, et al. Genetic diversity and population structure of a protected species: Polygala tenuifolia Willd. C R Biol. 2018;341(3):152–159.
- Fan ZY, Xi XL. Five new early bearing fruit Juglans varieties developed by crossing Juglans sigillata Dode and Juglans regia Linn. Hunan Univ Sci Technol. 2002;29:66–68.
- Aradhya MK, Potter D, Gao F, et al. Molecular phylogeny of Juglans (Juglandaceae): a biogeographic perspective. Tree Genet Genom. 2007;3(4):363–378.