
 ?Mathematical formulae have been encoded as MathML and are displayed in this HTML version using MathJax in order to improve their display. Uncheck the box to turn MathJax off. This feature requires Javascript. Click on a formula to zoom.
Abstract
This study reports the synthesis and antibacterial evaluation of two novel complexes, [Cd (Q) (Bpy) (CH3COO)2, complex 1] and [Cd (Q) (Phen) (CH3COO)2, complex 2], based on quercetin ligand. The method of synthesis was by reacting natural flavonoid quercetin (Q) with a good chelator (Bpy = 2,2’-bipyridine, Phen= 1,10-phenanthroline and Q = quercetin) and metal ions. The produced metal complexes were studied in the solid state by Fourier-transform infrared (FTIR) spectroscopy and in solution by UV-Vis absorption. Further analysis included high resolution mass spectrometry (HRMS) for confirmation. To understand the nature and coordination of quercetin and its metal complexes, density functional theory (DFT) calculation was performed. The scavenging (DPPH radical), antibacterial, MTT, enzymatic and non-enzymatic antioxidant activity assay, cytotoxicity assay (fluorescence study) were done and quercetin was used for comparison. Both complex 1 and complex 2 induced loss of cell viability via impairment of metabolic activity, leakage of intracellular proteins, and increased oxidative stress. The free-radical scavenging activity of complex 2 (IC50 340.175 µg/mL) was statistically significantly more potent than that of complex 1. The MIC values of complex 2 (7.80 µg/mL Escherichia coli, 15.62 µg/mL Staphylococcus aureus) were higher as compared to complex 1 and quercetin in both test microorganisms. There was inhibition of cell proliferation in Escherichia coli treated with 2 µg/mL of complex 2, whereas Staphylococcus aureus did not show inhibition at this concentration. The cytotoxicity screening on MG 63 cell line showed that the compounds were safe up to 500 mg/L.
Introduction
Millions of people die due to infections caused by microorganisms each year [Citation1]. When an antibiotic is discovered and becomes commercially available, the emergence of mutant strains begins to reduce its clinical utility after a period of indiscriminate use, leading to future use restrictions [Citation2]. The emergence of mutant bacteria can reduce the performance of antimicrobial treatment plans with the currently available antibiotics, thereby increasing the need for more efficient drugs for the treatment of infections. There is accumulating evidence that metal ions may increase the antimicrobial activity of various compounds.
The application of antibiotics with a vast spectrum of action and low toxicity can lessen the efficacy of future antimicrobial cures, resulting in the utilization of antibiotics with larger selective toxicity [Citation3–5]. Flavonoids are of unique interest due to the fact they have more than one coordinating centres for reaction with transition metal ions [Citation6] and possess promising enzyme modulation activity [Citation7]. The skeleton of flavonoids includes of a cyclic carbon structure denoted as A, B, and C. This ring carries substituents consisting of a carbonyl and an oxygen heteroatom in the C-ring and hydroxyls (OH) in A, B and C rings [Citation8,Citation9]. Metal flavonoid complexes are a promising class of natural drug molecules and are attracting increasing attention. However, the thorough basic research of metal-flavonoid complexes is lagging behind, partly due to very few efforts to establish a set of activity screening and subsequent evaluation system for comprehensive investigations on the antibacterial activity [Citation10,Citation11]. Quercetin is the most popular and biologically active flavonoid, regularly used as a dietary supplement [Citation12]. Quercetin also facilitates osteoblast differentiation, possesses angiogenic, antibacterial, cytotoxic and anticoagulation properties and ameliorates some neurological disorders [Citation13–15]. The chemical scaffold of quercetin, a common dietary polyphenol, may inspire the development of novel and more effective medicinal agents targeting bacteria [Citation16]. It has different binding sites for metal ions, e.g. between the 5-hydroxy group and the 4-carbonyl group, between the 3-hydroxy and 4-carbonyl group, and between the 3′, 4′-hydroxy group in the B ring [Citation17]. Several studies have focussed on homoleptic Cd complexes with chelated O^O bio-ligands (curcuminoids, terpenoids or flavonoids) and N–N bidentate ligands [Citation18] (1,10-phenanthroline, 2,2′-bipyridine or related ligands) [Citation19,Citation20]. Heteroleptic complexes based on transition metal centres possessing active ligands may produce novel drugs that have various biological actions like antioxidant, antimicrobial, anti-inflammatory, antineoplastic, etc. [Citation21].
In this paper we report the synthesis and characterization of new complexes such as chelator (Q), a reducing and stabilizing agent with cadmium acetate and Bpy = 2,2′-bipyridine, Phen= 1,10-phenanthroline (ligand). The metal complexes were characterized in the solid-state by Fourier-transform infrared (FTIR) spectroscopy, in solution (dimethyl sulfoxide (DMSO) by UV-Vis absorption, high-resolution mass spectroscopy (HRMS) and elemental analysis. To understand the nature and coordination of quercetin and its metal complexes, density functional theory (DFT) calculation was performed. The free-radical scavenging activity of the complexes was studied by using the stable DPPH radical [Citation22]. The synthesized complexes were tested for their antibacterial activity followed by toxicity evaluation on MG 63 cell lines.
Materials and methods
Reagents and equipment
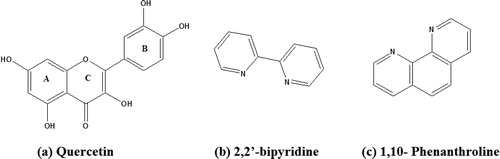
All the reagents used were of analytical grade without any further purification. Quercetin dihydrate, 2, 2′-bipyridine (Bpy), 1, 10-phenanthroline (Phen), and 2, 2-diphenyl-1-picrylhydrazyl (DPPH) () were acquired from Sigma Aldrich; methanol and triethylamine (NEt3) were procured from Merck. Precursor metal complexes of general formula (N^N) MAc where N^N = Bpy or Phen and M = Cd2+ were synthesized as previously reported [Citation23]. Characterizations were performed using Fourier transform infrared spectroscopy (FTIR, Perkin Elmer Spectrum version 10.4.3 spectrometer), elemental analysis (Euro EA Elemental Analyzer), UV-Vis characterizations (UV-1800 Schimadzu ver 2.52 spectrophotometer), DFT study (B3LYP level with the basis set 6-31 G** and LANL2DZ of the Gaussian 09 program) and HRMS study (TOF MS (100-1000).
Figure 1. Chemical structures of (a) Quercetin (ring A contain benzoyl ring system and ring B contain cinnamoyl ring system) (b) 2, 2’-bipyridine and (c) 1, 10- phenanthroline.
Free radical scavenging activity
The scavenging activity of the two complexes (1, 2) was determined by DPPH assay using a method reported earlier with slight modifications [Citation22]. This assay is based on the reduction process of an antioxidant. IC50 is the half-maximal inhibitory concentration, i.e. the concentration of antioxidant that scavenges 50% of DPPH radical. The lower the IC50 of drug, the higher its scavenging activity and vice versa. Different concentrations of complex 1 and complex 2 (30 µL) were mixed with 3 mL of DPPH (0.004% of methanol solution) and incubated for 15 min at room temperature. Absorbance was recorded at 517 nm using a spectrophotometer and the results are expressed as inhibition percentage of the free radical by the sample:
where Ao = absorbance of the control and At= absorbance of the test/standard sample.
Antibacterial activity
Minimum inhibitory concentration
MICs were determined by the broth micro-dilution method [Citation24]. The culture was maintained in a biosafety cabinet from stock (preserved at -800C) and left to stand for 1-2 min to thaw (liquid form). Lag phase diluted bacterial cultures of Staphylococcus aureus (ATCC 29213) and Escherichia coli (ATCC 25922) were seeded into 96-well plates at a concentration of 1 × 10⁵ CFU/mL and the plates were incubated at 37 °C for 24 h with shaking. CFU (colony forming units) were scored to determine the number of live or active microbes. Test compounds in DMSO were diluted into nutrient broth to achieve a final concentration of 1% DMSO. Cell growth was determined by measuring optical density (600 nm) in a microplate reader (Dynex Technologies, Chantilly, VA). MICs were calculated as the lowest concentration of drug at which growth was not apparent. Values were determined in quadruplicate, and the highest MIC was listed as the MIC. In the study an equivalent concentration of quercetin was taken as a positive control for comparing the activities of prepared complexes [Citation25].
Proliferation and microscopy
Generally, MTT assay is used to assess cell proliferation because optical density (OD) values can indicate cell growth. Cell proliferation was examined by the {3-(4, 5-dimethylthiazol-2-yl)-2, 5-diphenyl-tetrazolium- bromide} test (MTT) after, 3, 5 and 7 days of culture of microbial cells. Six groups of samples were placed in a 24-well plate. The cell suspension (1 mL) at a cell density (later) of viable cells was seeded on the samples and then kept at 37 °C in a humidified incubator with 5% CO2. Subsequently, the well plate put out into incubator was washed two times using a PBS solution. The sample was added with 500 µL MTT solution and incubated at 370C for 6 h. After incubation, 500 µL dimethyl sulfoxide (DMSO, SRL, 28580, India) was added per well to dissolve the purple formazan and this was mixed thoroughly by pipetting the solution. The solution was incubated at 37 °C for 10 min; after that the 96-well plates were taken and 150 µL solutions were added to each well. All experiments were performed in triplicate. The optical density (OD) was measured at 595 nm using an automated plate reader (ELISA Microplate Readers bio rad). Cell viability was plotted as the percentage of the control value [Citation26]. In the study, quercetin was taken as a positive control, and the antiproliferative activity of prepared complexes was compared [Citation27]. The morphology of the microbial cells in the sample was observed by confocal laser scanning microscopy (CLSM; Hitachi).
Cell lysate preparation
Cell lysate of cultured bacteria was prepared by centrifuging at 4 °C for 10 min at 5000 rpm (1,957 g). The pellet obtained was washed in PBS followed by resuspending in lysate buffer containing lysozyme, it was further incubated at 4 °C for 4 h and sonicated for 5 min. Cellular contents were removed by centrifugation at 10,000 rpm (7826 g) and the supernatant was collected to determine the antioxidant enzyme activities [Citation28]. The samples were transferred in volumes of 100 µL to microcentrifuge tubes kept on ice. The samples were frozen by plunging the tubes in a dry ice-ethanol bath and were stored at −80 °C until needed.
Superoxide dismutase assay
This is based on the principle of reduction of Nitro blue tetrazolium (NBT). Phosphate buffer (1.25 mL, pH 7.8), methionine (600 µL), EDTA (150 µL), nitro blue tetrazolium chloride (NBT, 300 µL) were taken and diluted 20 µL homogenate into a total volume of 3 mL. The reaction mixture was kept in front of fluorescent light and the reaction was conducted by adding 200 µL riboflavin. The control was simultaneously run without a test sample. A blank sample was kept in darkness and a control sample was kept in the light. The absorbance at 560 nm was taken against the blank sample. The units of SOD activity were expressed as the amount of enzyme required for inhibiting the reduction of NBT by 50%. The specific activity was expressed in terms of units per milligram of protein [Citation29].
Catalase assay
This assay works on the principle of enzyme reacting with methanol in the presence of hydrogen peroxide. It was determined by the method reported earlier with slight modifications [Citation30] by allowing an enzyme solution to react with hydrogen peroxide for varying time. The reaction was initiated by the addition of 1 mL of freshly prepared 30 mmol/L hydrogen peroxide. Supernatant (0.1 mL or 100 µL) was added to a cuvette containing 1.9 mL phosphate buffer (pH 7.0). The rate of decomposition of hydrogen peroxide was measured spectrophotometrically from a change in absorbance at 240 nm. The activity of catalase was expressed as units per milligram of protein.
Determination of non-enzymatic antioxidant activity
GSH assay
Enzymatic determination of GSH levels was carried out by using a strain of Staphylococcus aureus (ATCC 29213) and Escherichia coli (ATCC 25922) obtained from the American Type Culture Collection, Rocksville Md., USA. Cultures were maintained by streaking a bacterial colony in MHB agar plates and sub-culturing every fortnight. Pure colonies were isolated and stored at -800C. All test strains were grown, maintained and incubated in MHB medium at 370C with or without samples to be studied for 12 h. Cells were centrifuged and pelleted out at 10,000 rpm (7826 g) for 5 min, washed with phosphate buffer solution and lysed. The lysate was prepared and GSH levels in the clear supernatant were determined based on the reduction of 5,5′-dithiobis-(2-nitrobenzoic acid) by the GSH reductase system as previously described [Citation31]. All samples were prepared in triplicate. DTNB (Elman’s reagent, 5,5′-dithio-bis-(2-nitrobenzoic acid) Sigma-Aldrich) was added to the mixtures to yield a yellow product. The absorbance was taken at 412 nm using a spectrophotometer.
Oxidative stress assay
Lipid peroxidation (LPO)
Lipid peroxidation (LPO), or malondialdehyde (MDA), as a marker of unsaturated cell membrane lipid damage by free radicals, was measured by the thiobarbituric acid-reactive substances assay as previously described with slight modifications [Citation32]. Briefly, cells treated with complex 1 or complex 2 were mixed with 2 mL of freshly prepared thiobarbituric acid (TBA) and incubated at 95 °C for 60 min. The reaction was allowed to cool at room temperature and was centrifuged at 5000 rpm (1957 g) for 10 min. The OD of the supernatant was measured at 530 nm.
Protein leakage test (Lowry method)
This assay demonstrates the total level of protein in a solution and was based on the earlier reported method with little modification [Citation33]. To validate the effects of complex 1 and complex 2 on the metabolic activity, the levels of intracellular macromolecules such as proteins were analyzed. The concentration complex was adjusted to the desired level for each isolate, and the concentration of Staphylococcus aureus (ATCC 29213) and Escherichia coli (ATCC 25922) was 106 CFUs/mL. Cultures were incubated at 37 °C for four hours and the samples were centrifuged at 10,000 g for 30 min at 40C. The supernatants were stored at −20°CC for the estimation of protein.
Cytotoxicity study in MG-63 cells
The cytotoxicity method is used for drug screening. MG-63 cell lines are human cells from osteosarcoma. MG-63 cells were obtained from (NCCS, Pune, and Maharashtra). MTT assay is used to assess cell proliferation because optical density (OD) values can provide an indicator of the cell growth. The cells were seeded at a density of 5,000 × 104 cells/mL into 24-well plates and incubated for 24 h for attachment. After 3, 5 and 7 days, MTT test was carried out and used for the treatment. Cell proliferation was examined by the {3-(4,5-dimethylthiazol-2-yl)-2,5-diphenyl-tetrazolium-bromide} test (MTT) after, 3, 5 and 7 days of culture. Six groups of samples were placed in a 24-well plate. The cell suspension (1 mL) at a cell density (later) of viable cells was seeded on the samples and then kept at 37 °C in a humidified incubator with 5% CO2. Subsequently, the well plate was put out of the incubator, washed two times using PBS solution, and 500 µL MTT solutions were added. The samples were incubated at 37 °C for 6 h. After incubation, 500 µL dimethyl sulfoxide (DMSO, SRL, 28580, India) was added per well to dissolve the purple formazan, and this was mixed thoroughly by pipetting the solution. The solution was incubated at 37 °C for 10 min after which the 96-well plates were taken and 150 µL of solutions were added in each well. All experiments were performed in triplicate. The optical density (OD) was measured at 595 nm using an automated plate reader (ELISA Microplate Readers bio rad). Cell viability was plotted as the percentage of the control value [Citation34]. Finally, the cell-seeded samples were stained with fluorescein isocyanate (FITC), and 4′,6′-diamidino-2-phenylindole (DAPI) for 40 min and 5 min, respectively. The morphology of the cells on the samples was observed by confocal laser scanning microscopy (CLSM; Hitachi).
Statistical analysis
Statistical analyses and graphical representations of data were performed with SPSS software where appropriate, statistical analyses used analysis of variance (ANOVA) with Tukey’s post hoc test for multiple comparisons. Statistical significance was determined as p ≤ 0.05. Data are presented in bar graphs as mean values with standard deviation (± SD).
Synthesis
The synthesis of complex 1 and complex 2 was performed as shown in . The product was obtained by the reaction of the two ligands such as Bpy or Phen and Q with cadmium acetate (metal-ligand) at 1:1:1 molar ratio in methanol. Complex 1 {Cd (Q) (2, 2-bipyridine) (acetate)} was synthesized by a reaction of Bpy 0.026 g (1 mmol) in methanolic solution, Q 0.302 g (1 mmol) in 20 mL of absolute methanol and cadmium acetate 0.267 g (1 mmol) in 3 mL of deionized water. After 2 h of stirring, a reddish-brown precipitate was obtained. The complex was separated from the reaction mixture through filtration and recrystallized from acetonitrile followed by drying in vacuum [Citation23].
Figure 2. Proposed chemical structure of complex 1 and complex 2.
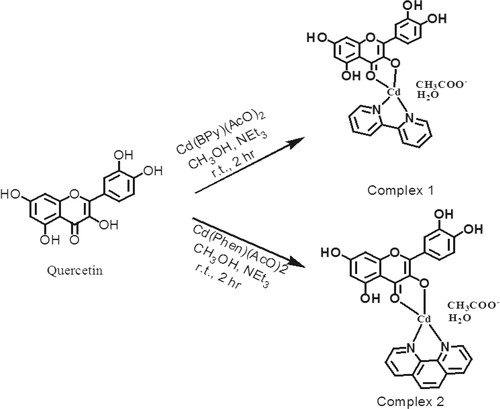
All the procedure for the synthesis of complex 2 {Cd (Q) (1, 10-phenanthroline) (acetate)} prepared was the same as above. The only a difference was that here Phen 0.180 g (1 mmol) was taken instead of Bpy.
Complex 1 C27H20CdN2O9- (630 g/mol−1): Yield: 71%, IR (KBr, cm−1): 3017.52 (ƲO-H), 1659.69(ƲC = O), 1415.01 (ƲC-OH), 1592.90 (ƲC = N), 1267.15 (ƲC-O-C), 1171.23 (ƲCC+ƲCCH), 771, 735 (ƲNCCH+ƲCCCH). Elemental analysis: Expt. (Calc.) C% 51.35(51.48), H% 3.43(3.36), N% 4.32(4.45), HRMS: m/z [M + 1] 649.0201 [(Q-H) + Cd (II) BPY + 1 H2O + 1 AcO] and m/z 631.2450 [(Q-H) + Cd (II) BPY + ½ H2O + 1 AcO].
Complex 2 C29H20CdN2O9- (654 g/mol−1): Yield: 65%, IR (KBr, cm−1): 3049.29 (ƲO-H), 1659.66(ƲC = O), 1415.34 (ƲC-OH), 1567.87 (ƲC = N), 1265.82 (ƲC-O-C), 1171.54 (ƲCC+ƲCCH), 782, 725 (ƲNCCH+ƲCCCH). Elemental analysis: Expt. (Calc.) C% 53.18(53.27), H% 3.19(3.24), N% .4.35(4.28), HRMS: m/z [M + 1] 673.0284 [(Q-H) + Cd (II) Phen + 1 H2O + 1 AcO] and 663.0016 [(Q-H) + Cd (II) Phen + ½ H2O + 1 AcO].
Results and discussion
Solid orange-colored complexes were obtained and characterized by UV-Vis, FTIR spectroscopy, HRMS and elemental analysis. Their in-vitro biological activities (antioxidant, cytotoxic, antibacterial activities) and their effect on the antioxidant enzyme activities in E.coli and S.aureus were studied. The proposed chemical structure of the complexes as in Scheme 1 was drawn based on spectroscopy and analytical methods in solid-state. HRMS and FTIR data supported well the proposed stoichiometry. The compounds are scarcely soluble, only in DMSO <10−3mol/L, which did not permit a reliable NMR analysis [Citation23].
The estimated chemical structure of the complexes presented in Scheme 1 was established based on a combo analysis of spectroscopy and analytical methods in the solid-state. The HRMS, FTIR and UV-visible results agree well with the proposed stoichiometry.
Infra-red analysis
The assignments of the wavenumbers of selected bands from the FTIR of Q and its Complex 1 and Complex 2 are presented in and . FTIR analysis of the residue obtained after heating of complex 1 and complex 2 above 800 °C showed bands at 1114 cm−1 and 1404 cm−1 () [Citation23]. The bands are characteristic of (CdO) left after heating, indicating the presence of Cd in the reported complexes (1 and 2).
Figure 3. FTIR spectra of quercetin (Q), complex 1 and complex 2.
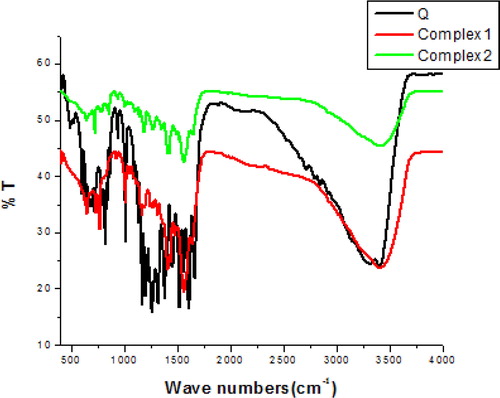
Table 1. Results of FTIR analysis of quercetin (Q), complex 1 and complex 2.
UV-visible characteristics
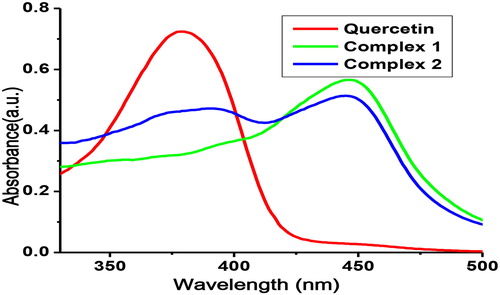
The absorption spectra of Q, complex 1 and complex 2 were determined in DMSO solution of 10 µmol/L. The absorption band of the ligand (Quercetin) lies at 379 nm and in Complex 1 and complex 2 this band got shifted towards longer wavelength (bathochromic shift), i.e. at 447 nm and 444 nm, respectively, as shown in . This bathochromic shift is due to π-π* transition of Q, Bpy, and Phen concerning a quercetin cinnamoyl band conferring the formation of a metal-oxygen bond in ring C and participation of a 3-OH group in the chelation.
Figure 4. Absorption spectra of quercetin (Q), complex 1 and complex 2.
Note: 10 µmol/L solution in DMSO.
HRMS study
The HRMS spectra of complex 1 were taken in positive mode and the peak obtained at m/z [M + 1] 649.0201 [(Q-H) + Cd (II) Bpy + 1 H2O + 1 AcO] and m/z 631.2450 [(Q-H) + Cd (II) Bpy + ½ H2O + 1 AcO] indicates the formation of complex with a stoichiometry of 1:1:1 (). The HRMS spectra of complex 2 were also taken in positive mode and the peak obtained at m/z [M + 1] 673.0284 [(Q-H) + Cd (II) Phen + 1 H2O + 1 AcO] and 663.0016 [(Q-H) + Cd (II) Phen + ½ H2O + 1 AcO] indicates the formation of complex with a stoichiometry of 1:1:1 ().
DFT study
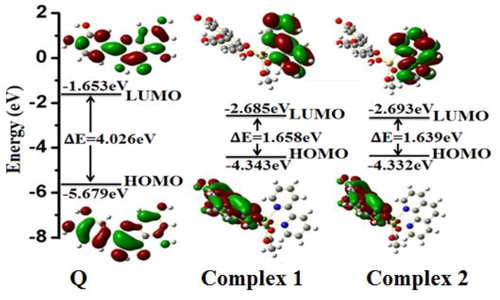
The energy-optimized structures of Q and its Cd2+ metal complexes with 2,2′-bipyridyl and 1,10-phenanthroline () were obtained using density functional theory (DFT) calculations with the B3LYP level 6-31 G** basis set for Q and the LANL2DZ basis set for its metal complexes using the Gaussian 09 program as given in . The electron density at the HOMO and LUMO of Q is surrounded by the whole conjugated skeleton. In complex 1 and complex 2, the electron density of the HOMOs is distributed over the quercetin moiety, whereas in LUMOs it is occupied on the 2,2′-bipyridyl and 1,10-phenanthroline ring, respectively. The energy gaps of HOMO–LUMO of Q, complex 1 and complex 2 were found to be 4.026 eV, 1.658 eV and 1.639 eV, respectively, which demonstrates that, after complexation of Q and Cd2+ ion with BPY and Phen, the energy gap decreases resulting in stabilization of the system [Citation35].
Figure 5. The HOMO and LUMO orbitals of quercetin (Q), complex 1 and complex 2 obtained from DFT.
Free radical scavenging activity in vitro (DPPH method)
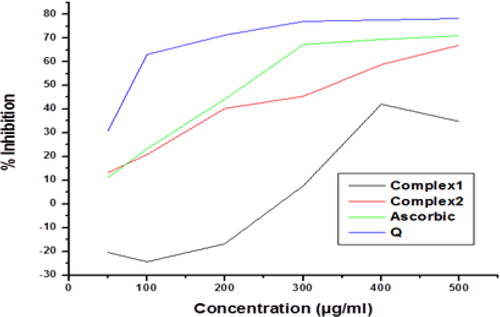
Ascorbic acid (IC50 235.932 µg/mL), quercetin (IC50 83.1427 µg/mL), complex 2 (IC50 340.175 µg/mL) had significant free radical scavenging activity at concentrations of 50,100,200 µg/mL, while at 300 µg/mL complex 1 did not show any significant (50% range) scavenging activity as compared to ascorbic acid and quercetin in any of the concentrations. These results suggest that complex 2 has free-radical scavenging activity but complex 1 did not show scavenging activity at this concentration ().
Figure 6. Comparison of the antioxidant activity of quercetin (Q), complex 1 and complex 2 with standard ascorbic acid.
Minimum inhibitory concentration
The minimum inhibitory concentration of the ligand (quercetin) and its complexes was determined based on the growth of tested bacterial species. The metal complexes had a higher inhibitory effect than the free ligand. In the case of E. coli, complex 2 (7.80 µg/mL) showed more potent activity as compared to complex 1 (12.0 µg/mL) and quercetin (31.25 µg/mL). The same trend was observed in the case of S. aureus also, with slightly higher MIC values in comparison to E. coli: complex 2 (15.62 µg/mL), complex 1 (24.21 µg/mL) and quercetin (61.25 µg/mL). Finally, it was observed that the MIC value of complex 2 is most significant in both E.coli and S. aureus as compared to the free ligand and complex 1 ().
Table 2. Minimum inhibitory concentration data for quercetin (Q), complex 1 and complex 2.
Superoxide dismutase (SOD) and catalase (CAT) activity
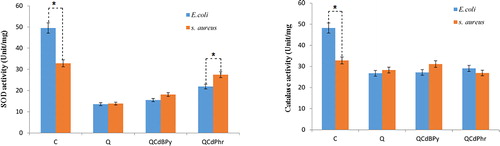
The tested bacterial strains treated with complex 1 and complex 2 exhibited significantly lower SOD levels. The SOD activity in E. coli treated for 12 h with complex 1 (15.52 units/mg), complex 2 (21.87 units/mg) and quercetin (13.54 unit/mg) was lower than the DMSO control (49.52 unit/mg). The same trend was observed in the case of S. aureus also (): 18.12 and 27.50 units/mg in cells treated with complex 1 and complex 2, respectively, as compared to the control (32.86 units/mg) and quercetin (13.85 units/mg). The catalase activity was also reduced significantly in the bacterial cells treated with the complexes and quercetin as compared to the normal control (). E. coli treated with complex 1 and 2 showed a similar activity pattern (27.17 units/mg and 29.07 units/mg), which was comparable to that in the quercetin-treated E. coli (26.76 unit/mg) but much lower than the normal control (48.22 unit/mg). A similar catalase reduction effect was observed in the case of S. aureus also upon treatment with complex 1 (31.13 unit/mg) and complex 2 (28.89 unit/mg) as compared to the quercetin-treated cells (28.28 unit/mg). Thus, the observed decrease in antioxidant enzyme activities following treatment of E. coli and S. aureus with complex 1 and complex 2 may be due to the disruption of the electron transport assemblies in the plasma membrane or to increased permeability of membrane and denaturation of oxidative enzymes. Cell membrane disruption causes down-regulation of antioxidant molecules like GSH and GST, as well as denaturation of enzymes like SOD and CAT, which impairs the electron transport pathway and leads to cell death [Citation36].
Figure 7. Effect of complex 1 and complex 2 on SOD (A) and CAT (B) activity in E. coli and S. aureus.
Note: Cells were treated with respective MIC (see ) of quercetin (Q), complex 1 and complex 2 for 24 h. Results are expressed as the mean values ± SD of three separate experiments, with three replicates per experiment. Asterisks indicate statistically significant differences between treatment and control groups determined using Student's t-test (p < 0.05).
Effect of complex 1 and complex 2 on metabolic activity
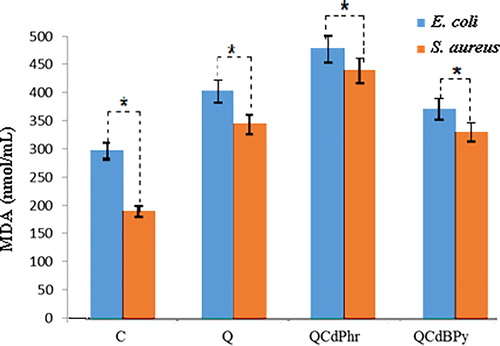
Lipid peroxidation during oxidative stress generates MDA, by losing peroxy radicals and singlet oxygen. The released MDA is a marker of oxidative stress in bacterial culture. Therefore, we measured the effect of treatment with complex 1 and complex 2 on the MDA level of E. coli and S. aureus. E. coli treated with complex 2 (438.04 nmol/mL) showed the highest level of MDA as compared to complex 1 (341.53 nmol/mL), quercetin (369.82 nmol/mL) and normal control (272.89 nmol/mL). However, it probably has denaturation activity on SOD and CAT as the results showed down regulation of these enzymes. A similar trend was observed in S. aureus treated with complex 2 (403.52 nmol/mL), complex 1 (303.68 nmol/mL), quercetin (316.16 nmol/mL) and normal control (175.13 nmol/mL) (). These results suggest that the inhibition of bacterial growth was probably due to complex 1- and complex 2-mediated up-regulation of MDA level in the bacterial cells.
Figure 8. Effect of quercetin (Q), complex 1 and complex 2 on MDA levels in E. coli and S. aureus.
Note: E. coli and S. aureus cells were treated with respective MIC (see ) of quercetin (Q) complex 1 and complex 2 for 12 h. Results are expressed as mean values ± SD of three separate experiments, with three replicates per experiment. Asterisks indicate statistically significant differences between treatment and control groups determined using Student's t-test (p < 0.05).
Protein leakage and GSH level
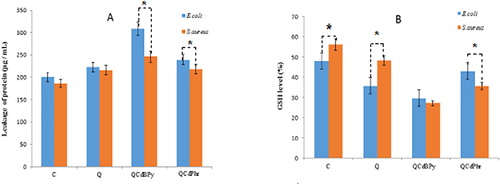
To analyze the effects of complex 1 and complex 2 on metabolic activity, the levels of intracellular macromolecules such as proteins were analyzed. The effect of complex 1 and complex 2 on protein leakage was analyzed by treating E. coli and S. aureus cells at their MIC (15.62 and 7.8 µg/mL respectively) for 12 h. The amounts of protein released in the suspension of the treated cells were estimated using the Lowry method. Protein leakage was found to be higher in complex 1 and complex 2 treated cells compared to untreated cells () However, E.coli cells treated with complex 1 showed significantly higher protein leakage (308 µg/mL) compared to S. aureus cells (246 µg/mL), and E.coli cells treated with complex 2 showed significantly higher protein leakage (239 µg/mL) compared to S. aureus cells (218 µg/mL). This suggests that the gram-positive S. aureus had higher tolerance to the antibacterial activity than the gram-negative E.coli cells. Therefore, our results were consistent with those of previous studies for intracellular leakage of macromolecules in treatment with antibacterial agents. Glutathione (GSH) plays an important role in maintaining an intracellular reducing environment and combating oxidative stress [Citation37]. GSH, a thiol-containing tripeptide, predominantly exists at high levels in reduced form and functions by scavenging ROS to maintain balance in the cellular redox environment and protect cells against oxidative stress [Citation10]. We observed a decrease in GSH levels in E. coli treated with complex 1 and complex 2 (70% and 60%, respectively) and in S. aureus (70% and 65%, respectively) when compared to untreated cells (). These results provide evidence that GSH depletion in cells treated with complex 1 and complex 2 was responsible for loss of cell viability. Therefore above results suggest that complex 1 and complex 2 exerts negative effects on antioxidant molecules present in normal bacterial cells.
Figure 9. Effect of quercetin (Q), complex 1 and complex 2 on leakage of protein (A) and GSH activity (B) in E. coli and S. aureus.
Note: E. coli and S. aureus cells were treated with the respective MIC (see ) of quercetin (Q), complex 1 and complex 2 for 12 h. Protein levels were measured using the Lowry method. GSH levels were measured enzymatically in the clear supernatant based on the reduction of 5, 5’-dithiobis-(2-nitrobenzoic acid) by the GSH reductase system. Asterisks indicate statistically significant differences between treatment and control groups determined using Student's t-test (p < 0.05).
Microbial cell proliferation assay
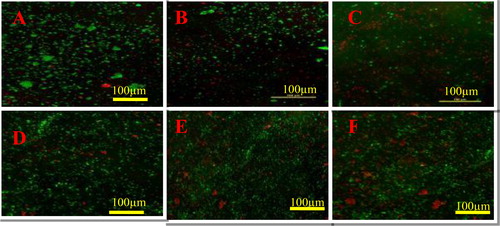
The dose-dependent microbial cell proliferation activity of complex 1 and complex 2 was determined in E. coli and S. aureus (). The results showed the inhibitory effect at different concentrations ranging from 0.2 to 2 µg/mL. Treatment with complex 1 and complex 2 decreased the cell viability in both bacterial strains compared to quercetin. Complete growth inhibition was observed at 2 µg/mL in E. coli treated with complex 2, whereas S. aureus did not show complete growth inhibition. The results also showed a dose-dependent effect in both cases but lacking complete inhibition in S. aureus. Furthermore, these results are consistent with the obtained MIC values for each bacterial strain. Therefore, complex 1 and complex 2 produced via quercetin-mediated synthesis displayed antibacterial effect in the cell viability assay. Images captured by confocal microscopy indicating dead microbes in red colour (). Green colour indicates the viable cells. The number of dead cells was greater in complex-2-treated cells as compared to those treated with complex 1 and quercetin ().
Figure 10. Effect of complex 1 and complex 2 on cell viability of E. coli (A) and S. aureus (B).
Note: Cells were incubated with various concentrations of complex 1, complex 2 and quercetin (Q). Bacterial survival was determined at 24 h supported by a CFU count assay. The experiment was performed with controls accounting for all concentrations. The results are expressed as mean values ± SD of three separate experiments, with three replicates per experiment. Asterisks indicate statistically significant differences between treatment and control groups determined using Student's t-test (p < 0.05).
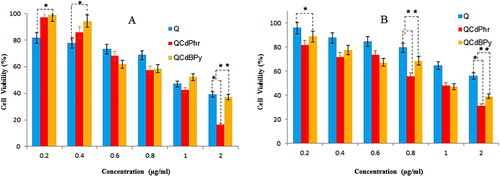
Figure 11. Confocal laser scanning microscopy (CLSM) images of E.coli treated with quercetin (A), complex 1 (B) and Complex 2 (C), and S. aureus treated with quercetin (D), complex 1 (E) and complex 2 (F).
Note: Viable cells in green colour; dead cells in red colour.
MG-63 cell cytotoxicity assay
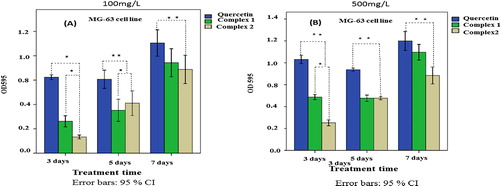
MG-63 cells were cultured in the presence of complex 1 and complex 2 for 3, 5 and 7 days. A time-dependent increase in cell proliferation was observed in all samples, which could be considered to indicate good cytocompatibility of the materials. At day 1, at 100 mg/L concentration there were slight differences in the OD values among the different groups of samples, but on day 3 and day 5, the OD values for the cells treated with complex 1 and complex 2 were significantly higher (p < 0.05). As the concentration increased to 500 mg/L the OD value increased fast. This showed that the drugs will bind more tightly to the cells. At 100 mg/L concentration, there was lower cellular metabolic activity, and as the concentration increased, i.e. 500 mg/L, the cellular metabolic activity increased. The MTT results proved that the proliferation of cells in the presence of complex 1 was higher than in the presence of complex 2 (). The cytotoxicity results supported the observation found in microbial cells. The toxicity results of complex 1 and complex 2 were comparable to that of quercetin.
Figure 12. MTT assay for cytotoxic potential of complex 1 and complex 2 in MG-63 cells.
Note: The cells were treated with 100 mg/L (A) and 500 mg/L (B) of complex 1, complex 2 and quercetin (Q), and the metabolic activity was measured at 3, 5 and 7 days. The results are mean values from three separate experiments, with three replicates per experiment. Asterisks indicate statistically significant differences (p < 0.05).
Fluorescence microscopy
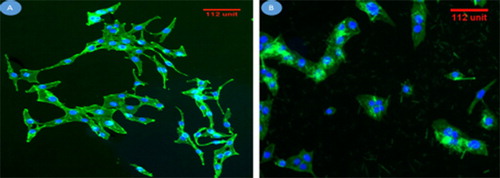
Cell adhesion and spreading is an important step for later cell proliferation and differentiation. Fluorescence microscopy images of the cytoskeletons stained by DAPI and FITC after MG-63 cells cultured in the presence of complex 1 and complex 2 for 3 days showed adhesion and linking. The cell morphology suggested that there was little cytotoxic effect. In this study, clearly show the presence of increased cell attachment on the cytoskeleton that measure bond strength and cellular activity. More MG-63 cells spread and anchored on the complex 1 surface, indicating better cytocompatibility than complex 2. These observations support the results in microbial cells and MTT assay in MG-63 cells. Cell adhesion regulates different growth factor signalling in different cell lines. Cell anchorage is recognized to have considerable effects on cell proliferation and differentiation [Citation38]. This is consistent with our results, which show that the synthesized complexes (1, 2) do not negatively influence the eukaryotic cell proliferation and viability.
Figure 13. Fluorescence microscopic images revealing the morphology of human osteoblast-like MG-63 cells, while cultured on complex 1 (A) and complex 2 (B) for 6 h.
Note: DAPI staining shows a single, round cell nucleus for each cell (stained in blue), and FITC staining shows the cytoplasm (stained in green).
Potential application
The newly synthesized cadmium acetate complexes with two biologically related chelating ligands (BPY = 2, 2′-bipyridine, Phen= 1, 10-phenanthroline) and quercetin were synthesized and characterized by spectroscopic and analytical methods. FTIR, UV spectroscopy showed that quercetin coordinates through ring C i.e. carbonyl group and 5-OH hydroxyl group. HRMS studies indicate the complexation sites of the complexes along with its composition and stoichiometry based upon the masses of complexions. Both the complexes coordinate through ring C i.e. carbonyl group and 5-OH hydroxyl group with a stoichiometry of metal: flavonoid: N–N dentate ligands at 1:1:1. Both the complexes, i.e. complex 1 and complex 2, are only soluble in DMSO and DMFsolvents. DFT calculations showed the electronic structure and the electronic properties of cadmium, bipyridine and phenanthroline complexes. Both the antioxidant and the antibacterial activity of complexes were more pronounced as compared to quercetin alone, probably due to an increase in bioavailability as the earlier report suggests [Citation39]. Both complex 1 and complex 2 induced loss of cell viability may be mediated via mechanisms, such as the impairment of metabolic activity, leakage of intracellular proteins, and increased oxidative stress. The free radical scavenging activity assay showed that complex 2 had stronger antioxidant potential than complex 1. MIC data indicated that complex 2 is more potent than complex 1 and quercetin against E.coli and S. aureus in vitro. The fluorescence microscopy analysis of microbial cells also supports the finding. Our findings also suggest that complex 1 and complex 2 exert an antibacterial effect in a dose-dependent manner and the activity involves the effect on antioxidant enzymes, protein leakage and ROS production. These results are in accordance with an earlier report [Citation9]. Flavonoid metal chelates are reported showing enormous therapeutic potential, broadening the spectrum of pharmacological activities [Citation11]. Cytotoxicity in mammalian osteosarcoma cell line also confirmed that the complexes were safe up to 500 mg/L in vitro. Thus, such studies could be easily expanded to the analysis of these types of metal-quercetin (flavonoid) complexes, even other metallic complexes, and may greatly contribute to a better understanding of the chelating chemistry quercetin (flavonoids) with transition metal ions and beyond, and further promote the research in the potential drug discovery and development from flavonoid metal complexes [Citation11]. The quercetin metal complexes specifically synthesized here can be further studied using several other microbes and the activity can be compared with some standard marketed antibiotics.
Conclusions
Two newly synthesized cadmium acetate complexes with two biologically related chelating ligands (BPY = 2, 2′-bipyridine, Phen= 1, 10-phenanthroline) and quercetin were characterized by spectroscopic and analytical methods. Quercetin coordinates through ring C i.e. carbonyl group and 5-OH hydroxyl group. Both the complexes coordinate through ring C i.e. carbonyl group and 5-OH hydroxyl group with a stoichiometry of metal: flavonoid: N–N dentate ligands at 1:1:1. The complexes had more potent antibacterial activity compared to quercetin and were non-cytotoxic in mammalian cells in vitro. The antibacterial activity was better pronounced in gram-positive as well as in gram-negative bacteria. The antibacterial mechanisms of action probably involve various routes leading to redox disbalance.
| Abbreviations | ||
| Q | = | quercetin |
| DPPH | = | 1,1-diphenyl-2-picrylhydrazyl |
| FTIR | = | Fourier transformation – infrared spectroscopy |
| DFT | = | density functional theory |
| Ac | = | acetate ions |
| DMSO | = | dimethyl sulfoxide |
| DMF | = | dimethylformamide |
| HRMS | = | high-resolution mass spectroscopy |
| LPO | = | lipid peroxidation |
| MDA | = | malondialdehyde |
Supplemental Material
Download PDF (180 KB)Acknowledgment
The authors are thankful to Dr. S. K. Mishra Department of Pharmaceutics IIT-BHU for his moral support, encouragement.
Disclosure statement
The authors declare that there is no conflict of interest regarding the publication of this paper.
Data availability statement
The data that support the findings of this study are available on request from the corresponding author, [Tanu Srivastava]. The data are not publicly available due to [restrictions e.g. their containing information that could compromise the privacy of research participants].
Correction Statement
This article has been republished with minor changes. These changes do not impact the academic content of the article.
Additional information
Funding
References
- WHO Promoting Access to Medical Technologies and Innovation Intersections between public health, intellectual property, and trade. World Health Organization, World Intellectual Property Organization, and World Trade Organization. 2012. (www.who.int/phi/en/, www.wto.org).
- Rocha DP, Pinto GF, Ruggiero R, et al. Coordenação de metais a antibióticos como uma estratégia de combate à resistência bacteriana. Quím Nova. 2011;34(1):111–118.
- Tortora GJ, Funke BR, Case CL. Microbiologia. 6th ed. Porto Alegre: Artmed; 2003.
- Willey JM, Sherwood LM, Woolverton CJ. Prescott, Harley, and Klein's microbiology. 7th ed. New York (NY): McGraw-Hill; 2008.
- Santos AF, Brotto DF, Favarin LRV, et al. Study of the antimicrobial activity of metal complexes and their ligands through bioassays applied to plant extracts. Rev Bras Farmacogn. 2014;24(3):309–315. http://dx.doi.org/10.1016/j.bjp.2014.07.008).
- Mendiguchia BS, Aiello I, Crispini A. Zn(ii) and Cu(ii) complexes containing bioactive O,O-chelated ligands: Homoleptic and heteroleptic metal-based biomolecules. Dalton Trans. 2015;44(20):9321–9687.
- Proença C, Freitas M, Ribeiro D, et al. α-Glucosidase inhibition by flavonoids: an in vitro and in silico structure-activity relationship study. J Enzyme Inhib Med Chem. 2017;32(1):1216–1228.
- Torreggiani A, Tamba M, Trinchero A, et al. Copper (II)-Quercetin complexes in aqueous solutions: Spectroscopic and kinetic properties. J Mol Struct. 2005;744-747:751–759.
- Selvaraj S, Krishnaswamy S, Devashya V, et al. Flavonoid-metal ion complexes: a novel class of therapeutic agents. Med Res Rev. 2014;34(4):677–702.
- Masip L, Veeravalli K, Georgiou G. The many faces of glutathione in bacteria. Antioxid Redox Signal. May 2006;8(5-6):753–762.).
- Liu Y, Guo M. Studies on Transition Metal-Quercetin Complexes Using Electrospray Ionization Tandem Mass Spectrometry. Molecules. 2015;20(5):8583–8594.
- Kasprzak MM, Erxleben A, Ochocki J. Properties and applications of flavonoid metal complexes. RSC Adv. 2015;5(57):45853–45877.
- Zhou Y, Wu Y, Jiang X, et al. The effect of quercetin on the Osteogenesic Differentiation and Angiogenic Factor Expression of Bone Marrow-Derived Mesenchymal Stem Cells . PLoS One. 2015;10(6):e0129605[Cited 2015 Jun 08].
- Raie DS, Mhatre E, Thiele M, et al. Application of quercetin and its bio-inspired nanoparticles as anti-adhesive agents against Bacillus subtilis attachment to surface. Mater Sci Eng C Mater Biol Appl. 2017;70(Pt 1):753–762.
- Usman M, Khurram Amin M, Khan TA, et al. Effects of luteolin and quercetin in combination with some conventional antibiotics against methicillin-resistant Staphylococcus aureus. Int. J. Mol. Sci. 2016;17(11):1947.
- Pejin B, Ciric A, Markovic JD, et al. Quercetin potently reduces biofilm formation of the strain pseudomonas aeruginosa PAO1 in vitro. Curr Pharm Biotechnol. 2015;16(8):733–737.
- Cornard JP, Merlin JC. Comparison of the chelating power of hydroxyflavones. J Mol Struct. 2003;651–653:381–387.
- Liu HK, Sadler J. Metal complexes as DNA intercalators. Acc Chem Res. 2011;44(5):349–359.
- Zhao MH, Yuan L, Meng LY, et al. Quercetin-loaded mixed micelles exhibit enhanced cytotoxic efficacy in non-small cell lung cancer in vitro . Exp Ther Med. 2017;14(6):5503–5508.
- Nataraj L, Perumal S, Sellamuthu M. Antioxidant activity and free radical scavenging capacity of phenolic extracts from Helicteres isora L. and Ceiba pentandra L. J Food Sci Technol. 2013; 50(4):687–695.
- Sanz Mendiguchia B, Pucci D, Mastropietro TF, et al. Non-classical anticancer agents: on the way to water soluble zinc(II) heteroleptic complexes . Dalton Trans. 2013;42(19):6768–6774.
- Pucci D, Crispini A, Sanz Mendiguchía B, et al. Improving the bioactivity of Zn(II)-curcumin based complexes . Dalton Trans. 2013;42(26):9679–9687.
- Andelescu AA, Cretu C, Sasca V, et al. New heteroleptic Zn (II) and Cu (II) complexes with quercetin and N^N ligands. Polyhedron. 2018;147:120–125. DOI:.
- Wang S, Yao J, Zhou B, et al. Bacteriostatic effect of quercetin as an antibiotic alternative in vivo and its antibacterial mechanism in vitro. J Food Prot. 2018; 81(1):68–78.
- de Araújo RF, de Araújo AA, Pessoa JB, et al. Anti-inflammatory, analgesic, and anti-tumor properties of gold nanoparticles of malignant cells. Pharmacol. Rep. 2017;69(1):119–129.
- Granato M, Rizzello C, Montani MSG, et al. Quercetin induces apoptosis and autophagy in primary effusion lymphoma cells by inhibiting PI3K/AKT/mTOR and STAT3 signaling pathways. J Nutr Biochem. 2017; 41:124–136.
- Meerloo van J, Kaspers GJL, Cloos J. Cell sensitivity assays: The MTT assay. Methods Mol. Biol. 2011; 731:237–245.
- Guru Nathan S, Han JW, Kwon DN, et al. Enhanced antibacterial and anti-biofilm activities of silver nanoparticles against Gram-negative and Gram-positive bacteria. Nano Scale Res. Lett. 2014; 9:373.
- Saravanan S, Vimalraj S, Vairamani M, et al. Role of mesoporous wollastonite (calcium silicate) in mesenchymal stem cell proliferation and osteoblast differentiation: a cellular and molecular study. J Biomed. Nanotechnol. 2015;11(7):1124–1138.
- Zhou J, Wang L, Wang J, et al. Complexation and antioxidant activity of flavonoids with biologically relevant metal ions trans. Met. Chem. 2001;26(1/2):57–63.
- Arakha M, Pal S, Samantarrai D, et al. Antimicrobial activity of iron oxide nanoparticle upon modulation of nanoparticle–bacteria interface. Sci. Rep. 2015;5:14813. 10.1038/srep14813.
- Singh M, Mallick AK, Banerjee M, et al. Loss of outer membrane integrity in Gram-negative bacteria by silver nanoparticles loaded with Camellia sinensis leaf phytochemicals: plausible mechanism of bacterial cell disintegration. Bull. Mater. Sci. 2016;39(7):1871–1878.
- Li M, Ren L, Li LHua, et al. Cytotoxic Effect on Osteosarcoma MG-63 Cells by Degradation of Magnesium. Journal of Materials Science & Technology. 2014;30(9):888–893.
- Keegan K, Halegoua S. Signal transduction pathways in neuronal differentiation. Curr Opin Neurobiol. 1993;3(1):14–19.
- Frisch MJ, Trucks GW, Schlegel HB, et al. 2016. Gaussian 09. Wallingford CT: Gaussian, Inc..
- Yuan Y-G, Peng Q-L, Guru Nathan S. Effects of Silver Nanoparticles on Multiple Drug-Resistant Strains of Staphylococcus aureus and Pseudomonas aeruginosa from Mastitis-Infected Goats: An Alternative Approach for Antimicrobial Therapy. IJMS. 2017;18(3):569.
- Franco R, Cidlowski JA. Glutathione efflux and cell death. Antioxid Redox Signal. 2012;17(12):1694–1713. [cited 2012 Dec 15].
- Xu XR, Yu HT, Yang Y, et al. Quercetin phospholipid complex significantly protects against oxidative injury in ARPE-19 cells associated with activation of the Nrf2 pathway. Eur J Pharmacol. 2016; 770:1–8.
- Xu D, Hu M-J, Wang Y-Q, et al. Antioxidant Activities of Quercetin and Its Complexes for Medicinal Application. Molecules. 2019;24(6):1123. [cited 2019 Mar 21];
- Lee HJ, Kerr RA, Korshavn KJ, et al. Effects of hydroxyl group variations on a flavonoid backbone toward modulation of metal-free and metal-induced amyloid-β aggregation. Inorg Chem Front. 2016;3(3):381–392.