
Abstract
Sophora tonkinensis is an important source of herbal medicine for treatment of swelling and pain in the throat. Its chemical composition has been extensively studied; however, there are still gaps in the research on genetic diversity of S. tonkinensis which can provide insights for better utilization and conservation of genetic resources. In this study, 23 populations of diverse locations from southern China were evaluated using AFLP markers. The average number of alleles (Na and Ne) from all populations was 0.608 (Na) and 1.153 (Ne), average Shannon’s information index was 0.137, which indicated that the genetic diversity of the whole populations was low. Unweighted pair-group method with arithmetic mean (UPGMA) clustering and principal coordinates analysis (PCoA) showed that the populations could be divided into three clades. The analysis of molecular variance (AMOVA) indicated that 20% of the molecular variance was due to differences among wild populations and 80% of the molecular variance was due to divergence within wild populations. There was a significant positive correlation between genetic distance and geographical distance, as well as ecological factors including altitude and temperature. It is necessary to closely monitor the status of the wild populations and consider expanding their genetic diversity. Establishment of the conservation basis in different areas is more conducive to the protection of S. tonkinensis.
Introduction
There has been more attention on the Traditional Chinese Medicine (TCM) genus Sophora because plants from this genus contain alkaloids and flavonoids [Citation1,Citation2]. In China, Sophora tonkinensis is an important medicinal plant that provides a rich source of isoprenyl- and lavandulyl-substituted flavonoids [Citation3]; however, few studies have assessed its genetic diversity and structure. In recent years, the wild resources of S. tonkinensis have decreased as a result of its growing demand [Citation4].
Through long-term practice, S. tonkinensis from Guangxi Province was recognized as having the best therapeutic effect [Citation5], implying that the effect might depend on specific genetic characteristics and ecological factors in Guanxi’s populations. The distribution of S. tonkinensis is limited to a relatively small area of karst topography near the Tropic of Cancer. The environment which is suitable for S. tonkinensis growth is mountainous regions with rocky or limestone substrates. In China, S. tonkinensis is mainly found in Guangxi Province, although it also occurs sporadically in some areas surrounding the Guanxi Province [Citation4]. There have been few studies on the genetic diversity of Sophora tonkinensis with only one report of a phylogenetic analysis within the genus Euchresta that dealt with S. tonkinensis [Citation6]. Many studies of S. tonkinensis were limited to its phytochemical constituents and pharmacological implications [Citation7–9]. Data on the genetic diversity and structure of S. tonkinensis were the foundation for developing conservation strategies, which can provide insights for better utilization and conservation of genetic resources [Citation10].
In the development of conservation strategies, DNA-based markers have various advantages, such as genome coverage, and have been widely used in the analysis of genetic diversity and structure. Many kinds of DNA-based markers, such as RAPDs (random-amplified polymorphic DNA), ISSRs (inter simple sequence repeat markers), and AFLPs (amplified fragment length polymorphism), have been used to demonstrate genetic diversity and structure in plants [Citation11–13]. Many studies on the genetic diversity and structure of plants, such as Opuntia ficus-indica, Capsicum chinense, Polygala tenuifolia, and Elymus tangutorum were based on AFLP markers [Citation12, Citation14–16]. AFLP markers have high reproducibility and the ability to simultaneously detect polymorphisms using a single assay. Here, we performed AFLP assay to investigate the genetic diversity and population structure of S. tonkinensis in China. The genetic diversity and population structure of S. tonkinensis from different areas can demonstrate its evolutionary potential, which is essential to develop conservation strategies.
In this study, we collected 69 S. tonkinensis germplasms from 23 populations that cover the Guangxi, Yunnan and Guizhou provinces. DNA was extracted and used for creating the AFLP markers. The AFLP analysis was carried out by using high-performance capillary electrophoresis. The genetic diversity and population structure of S. tonkinensis were evaluated, demonstrating the present states of S. tonkinensis in China.
Materials and methods
The collection of materials and DNA extraction
In 2018, silica-dried leaf material was collected in 23 populations (). In each population, 5–10 plants were sampled. Sampled plants were growing at least 3 m apart. Genomic DNA was extracted from leaves by the CTAB method. The leaves were ground with PVP powder in liquid nitrogen before DNA extraction. The quality and concentration of the extracted DNA were detected by 1% agarose gel electrophoresis and a NanoDrop® spectrophotometer.
Table 1. Geographic description of collection sites of S. tonkinensis.
AFLP
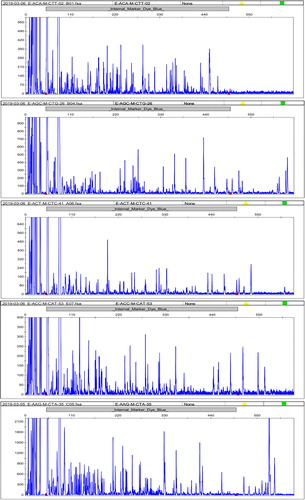
AFLP markers were developed according to the protocol from previously published studies with minor modifications [Citation17,Citation18]. Briefly, the extracted DNA was digested with two restrictive enzymes, MseI and EcoRI, and the adaptors were ligated to the fragments of the digested DNA. After the ligation, pre-amplification and selective amplification were performed with the EcoRI + A/MseI + C primers and 5 pairs of the EcoRI + 3/MseI + 3 primers, respectively. After amplification, the DNA fragments were separated and detected with an ABI 3730xl sequencer (Thermo Fisher Scientific Applied Biosystems™). The GeneRuler DNA Ladder Mix (Thermo Scientific™) was used as an internal control for the sizing and approximate quantification of the DNA fragments. The results of electrophoresis were shown in the form of spectrogram (). Data of spectorgram from the sequencers were processed into a binary matrix using GeneMapper™ Software 5 (Applied Biosystems™).
Figure 1. Electrophoretic results of some materials with five pairs of primers (E-ACA-M-CTT, E-AGC-M-CTG, E-ACT-M-CTC, E-ACC-M-CAT and E-AAG-M-CTA).
Data analysis
The AFLP marker data were saved as a binary matrix in the form of a spreadsheet, so they were conveniently processed by GenAlEx 6.5 in Excel [Citation19,Citation20]. AFLP markers were constructed with 1234 loci, and the band pattern from the AFLP data and the characteristics of every population were observed. The Nei’s genetic distance between populations was estimated for PCoA (principal coordinate analysis) and AMOVA (analysis of molecular variance). All of the abovementioned analyses were performed using GenAlEx 6.5.
The genetic structure of S. tonkinensis was analysed via the STRUCTURE 2.3.4 software (http://web.stanford.edu/group/pritchardlab/structure.html). The parameters were chosen by the introduction of the dominant markers in STRUCTURE 2.3.4 [Citation21]. The admixture model was used for the analysis, and the data of the heterozygous loci were treated as missing values. The optimal number of clusters was estimated by a Bayesian model. The number of clusters (K) was set from 1 to 8 (10 times for each K) for the assessment by the STRUCTURE 2.3.4 software. The length of the burn-in period was 100,000, and the number of MCMC Reps after burn-in was 10,00,000. The Structure Harvester software (http://taylor0.biology.ucla.edu/struct_harvest/) was used to detect the optimum value of K [Citation22]. CLUMMP and DISTRUST were used to construct a graphical representation of the genetic structure of the plant germplasms [Citation23,Citation24].
The clustering analysis was performed with the NTSYS-pc 2.10e software. The clustering analysis tree was constructed by the UPGMA (unweighted pair-group method with arithmetic mean) based on the pairwise Nei’s genetic distance calculated by GenAlEx 6.5.
Mantel test was used to analyze whether eco-geographical factors influenced the genetic structure of populations. The corresponding data (precipitation and temperature) was acquired from DIVA-GIS (version 7.5.0.0, http://swww.diva-gis.org) with the data of WorldClim. The distance matrix of every environmental factor and geography was calculated by programing in R language with the geosphere and vegan package [Citation25,Citation26]. R language with vegan package was also used for mantel test.
Results and discussion
AFLP marker information indicated low genetic diversity in S. tonkinensis
The distribution and locations of 69 S. tonkinensis germplasms from 23 populations are shown in and . The peak in the spectrum represents the intensity of the fluorescence signal (). The spectrum data of each sample was transformed into a 0-1 vector with 1234 sites by software (GeneMapper™ Software 5) processing, which indicated the band distribution. The band patterns across populations are shown in and . From the band patterns, we observed the percentage of polymorphic loci in every population (). A total of 33.06% of the loci in population 21 (pop21) were polymorphic. In contrast, population 3 (pop3) was the least polymorphic population, with 16.29% of the loci being polymorphic. The number of alleles (Na and Ne), Shannon's information index, the heterozygosity of every population were also calculated (). The average number of polymorphic loci per population was 440.8. Pop3, which had the lowest number of polymorphic loci, had 298 bands. By comparison, pop21 had the greatest number of polymorphic loci with 570 bands. The mean of the values of Shannon's information index for all of the populations was 0.137. The number of alleles (the mean of Na = 0.608; the mean of Ne = 1.153) and the heterozygosity (the mean of heterozygosity = 0.0914) indicated that the genetic variation of all groups was not high. These results indicated that S. tonkinensis populations exhibited a relatively low genetic diversity.
Figure 2. Geographic locations of S. tonkinensis. The colours of circle dots represent the clade to which dots belong. Orange: clade I, Blue: clade II, Red: clade III. Source: Constructed by software DIVA-GIS.
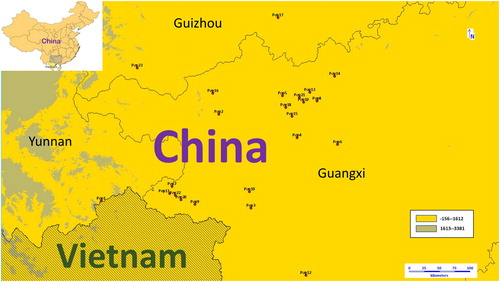
Figure 3. Information on band pattern. Note: The data were processed by GenAlEx 6.5.
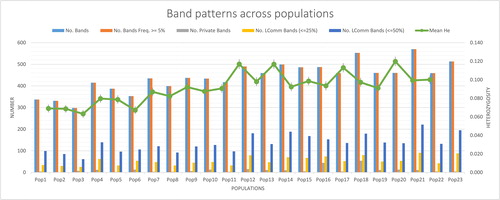
Table 2. Information on band pattern.
Table 3. Percentage of polymorphic loci.
Table 4. Estimated number of allele and Shannon's information index.
Genetic diversity and population structure were determined by a combination of factors, including geographic distribution, life cycle, mating system, selection and adaptation [Citation27]. The growth environment of the wild populations was confined to the tropical and subtropical karst regions in South China and northern Vietnam, which led to directional selection for adaptation to specific environments and resulted in the low genetic diversity of S. tonkinensis. The seeds of S. tonkinensis are mainly dispersed by gravity, which might also restrict the increase in genetic diversity. The increased demand for S. tonkinensis led to excessive exploitation, which also reduced the genetic diversity of S. tonkinensis. From our data, S. tonkinensis in China demonstrated low genetic diversity and deserves a high conservation priority.
Cluster pattern and genetic structure
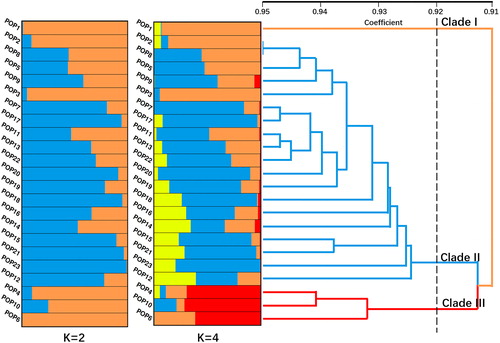
Data calculated by STRUCTURE 2.3.4 was analysed. The delta K value showed two peaks at the point where K was set at 2 and 4 (), which suggested that the germplasms belonged to 2 or 4 genome fractions. The tree based on Nei’s genetic distance was constructed via NTSYS-pc 2.10e software by UPGMA. The clustering tree showed three major clades at the 0.92 coefficient level (). There are some corresponding relationships between the genetic structure and clustering tree, especially in the clade III ().
Figure 4. Estimated number of subpopulations (K). Note: The studied panel from STRUCTURE 2.3.4 analysis.
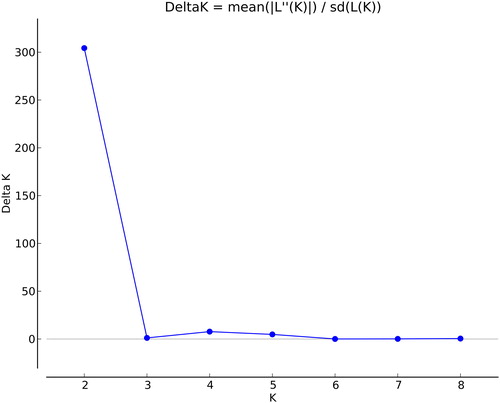
Figure 5. Genetic structure and dendrogram. Note: Genetic structure was constructed using Bayesian method by STRUCTURE 2.3.4 and UPGMA dendrogram was drawn based on Nei’s genetic distance by NTSYS-pc v2.10.
The principal coordinate analysis (PCoA) resulted in a similar germplasm clustering pattern. The scatterplot based on Nei’s genetic distance also showed three clusters (). The circles correspond to the branching of the germplasms in the clustering tree. In summary, three clades were categorized from the clustering tree and the PCoA.
Figure 6. Principal coordinate analysis (PCoA) based on AFLP data. Note: PCoA with Nei’s genetic distance and data processed by GenAlEx 6.5.
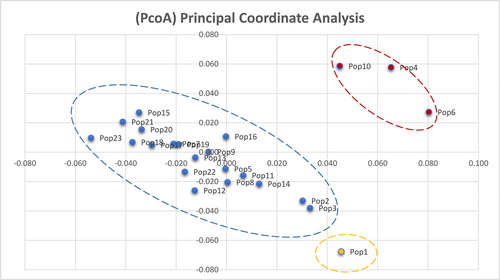
As shown in and , pop1 exists as a separate clade. Pop4, pop10 and pop6 together constitute clade III, and the other populations constitute clade II. When K was set at 2, there was no significant correspondence between the genetic structure map and the clustering tree. The genetic structure map showed some correspondence with the clustering tree when the K value was set at 4. Clade III had more genetic components represented in red (>60%) than the other populations (<6%) (). Clade I, which was formed by pop1, had fewer genetic components represented in blue and red (<1%) (). The other populations, which formed clade II, had more genetic components represented in blue (>5%) and fewer red components (<6%) (). The genetic structure data were generally consistent with the results from the AFLP markers. Pop3, with the lowest number of polymorphic loci, was mainly formed by one genetic component (>94%); however, Pop21, with the highest number of polymorphic loci, was mainly formed by three genetic components (>3%).
The wild populations, including pop1, pop3, pop6, pop9, pop10, pop16, pop20 and pop22, fell into all clades in the clustering tree. As clade III has a much higher proportion of red genetic components than the other clades (), the areas in which individuals from pop6 and pop10 were collected might have specific factors favourable for the selection of genetic components, or the populations might have been affected by bottleneck effects. Some populations, such as pop1, pop2 and pop3, had low genetic diversity, which suggested that these populations were at risk of extinction. Besides, the majority of the cultivated populations including one population from Guizhou province were grouped closely with the Jingxi populations in clade II, suggesting that these cultivated populations mainly originated from the Jingxi area. This is also in line with the local tradition of the introduction of S. tonkinensis.
In the wild populations, pop16 from Leye had a higher Shannon index than the other wild populations. The genetic components of pop16 were more evenly distributed than those of other wild populations, which was consistent with the higher genetic diversity of the population (). Compared with the wild population, the values of Shannon’s index of some cultivated populations (pop12, pop14, pop18, pop21 and pop23) were higher than those of the wild populations. In particular, the Shannon index of pop21 was the highest. On the one hand, it might be related to the rich source materials of introduction in these places. On the other hand, the local adoption of pop21, where the model of imitating wild cultivation was adopted, might be conducive to the maintenance of genetic diversity. Meanwhile, the result suggested that the ex-situ conservation in these areas was conducive to S. tonkinensis protection.
The level of gene flow was low in S. tonkinensis
The AMOVA analysis was implemented on wild populations and cultivated populations, respectively. The result indicated that 20% of the molecular variance was due to differences among wild populations and 80% of the molecular variance was due to divergence within wild populations. The low genetic variation among wild populations might be related to the narrow distribution of the population and the absence of multiple centres of origin. The seed dispersal of S. tonkinensis occurred mainly through gravity near the parent plants and the seeds were short-lived, which promotes divergence within populations [Citation28].
The result of AMOVA indicated that the level of gene flow was low. There was a lack of germplasm exchange among different regions, even among cultivated populations. In cultivated populations, only 9% of the molecular variance was due to differences among populations and 91% of the molecular variance was due to divergence within populations. The gene flow among cultivated populations was lower than that among wild populations (9% and 20% among populations, ). Moreover, ΦST in cultivated populations was smaller than that in wild populations (0.088 < 0.204), which indicated that cultivated populations came from a small number of populations (greatly affected by genetic drift or selection). Thus, it is necessary to pay attention to expanding the sampling for ex-situ protection.
Table 5. Summary of AMOVA.
Correlation of genetic structure and environmental factors
Many internal and external factors have some effect on genetic structure. Isolation by distance (IBD) and isolation by environment (IBE) serve as explanations for the effect of geographic isolation and environmental dissimilarity on genetic differentiation [Citation29,Citation30]. The above theory mainly explains the formation of genetic diversity of wild population, while the genetic structure of cultivated populations is greatly influenced by humans. Therefore, this study was only aimed at the wild populations to explore the impact of geography and ecological environment on the genetic structure.
Mantel test was performed to investigate the correlations between genetic distance and geographical and environmental factors, including altitude, average annual temperature and average annual precipitation distances. The results showed that there was a significant correlation between genetic distance and geographical distance in the eight wild populations (r = 0.6755, p = 0.0004), indicating that IBD had a great influence on genetic diversity. The correlation analysis of ecological factors and genetic distance showed that the altitude (r = 0.4198, p = 0.0326) and temperature (r = 0.3798, p = 0.0309) also significantly affected the genetic structure of wild populations, while the correlation between the average annual precipitation and the genetic structure of wild populations was very weak (r = 0.03657, p = 0.4152) (). The results showed that IBE also had some effect on genetic structure.
Table 6. Correlation between genetic distance and eco-environmental distance based on pairwise Mantel test for all populations and populations in clade II and clade III.
Considering that the species distribution was narrow, and the AMOVA results revealed that the gene flow among populations was small, we speculated that the genetic structure of wild S. tonkinensis populations was mainly caused by natural selection in the region. One study reported a significant positive correlation between precipitation and the alkaloid contents of S. tonkinensis [Citation5], but the effect of precipitation on genetic structure was weak in our study, which suggested that the studied populations of S. tonkinensis were mainly affected by environment rather than genetics.
Conservation implications
Based on all the obtained results, we proposed the conservation strategy of S. tonkinensis. Given the low genetic diversity observed in China, this would represent a loss of adaptive potential for S. tonkinensis. It is necessary to closely monitor the status of the wild populations and consider expanding the genetic diversity of the population through wild tending. At the same time, when introducing, it is necessary to ensure multiple sources of the cultivated population to maintain its genetic diversity, so as to maintain the adaptability of the population. In our study, the genetic variation of S. tonkinensis was affected by many factors including geographic and ecologic ones. AMOVA analysis indicated relatively low genetic variation among populations and low level of gene flow among populations in different regions. Accordingly, it is helpful to protect the genetic diversity by setting up the protection bases of S. tonkinensis in different regions, so as to protect the genetic diversity of S. tonkinensis in general.
Conclusions
This study used AFLP markers as an effective tool for analysis of the genetic diversity and population structure of S. tonkinensis. The results suggested that low genetic diversity has an adverse effect on plant conservation. It is important to note that some populations have relatively lower genetic diversity and deserve high conservation priority. According to the results, the combination of ex situ and in situ conservation can better protect the genetic diversity of the population. We found a wild population with rich genetic diversity (pop16), so the results suggested that the environment of pop16 was conducive to the maintenance of genetic diversity of S. tonkinensis, and the environmental factors of the area where pop16 was located should be used as a reference for the selection of ex situ conservation areas. Because the introduction time was not long, we still need to pay close attention to the changes in the genetic diversity of the subsequent cultivated populations, so as to achieve the purpose of better protecting the genetic diversity of the populations. Future studies should evaluate the effects of genetic diversity on the pharmacodynamics, which demonstrate the correlation between genetic diversity and stability of the S. tonkinensis medicine efficacy.
Acknowledgements
We are grateful to Yu Jianbin, Wang Xing, Li Xia and Wei Li (National Demonstration Center for Experimental Plant Science Education, College of Agriculture, Guangxi University) for their help in collecting materials and to Liang Ying (Department of Conservation Center of Medicinal Plants, Guangxi Key Laboratory of Medicinal Resources Conservation and Genetic Improvement, Guangxi Botanical Garden of Medicinal Plants) for providing materials from Guangxi Botanical Garden of Medicinal Plants.
Disclosure statement
The authors declare that they have no competing interests.
Data accessibility statement
The datasets generated in this study are available from the corresponding author on reasonable request. AFLP data can be accessed at: https://datadryad.org/stash/share/CKSepDVRwyqTBd640V8JeBsefycgjWVHOckUmKQ_ec4
Additional information
Funding
References
- Boozari M, Soltani S, Iranshahi M. Biologically active prenylated flavonoids from the genus Sophora and their structure-activity relationship—a review. Phytother Res. 2019;33(3):546–560.
- Wang H, Xia C, Chen L, et al. Phytochemical information and biological activities of quinolizidine alkaloids in Sophora: a comprehensive review. CDT. 2019;20(1):1–15.
- Ding P, Chen D. Isoprenylated flavonoids from the roots and rhizomes of Sophora tonkinensis. HCA. 2006;89(1):103–110.
- Huang B, Nong D, Huang X, et al. Resources investigation report on Chinese Materia Medica Sophora tonkinensis (in Chinese). Mod Chin Med. 2014;16:740–744.
- Yao SC, Lin ZZ, Lan ZZ, et al. Analysis on the suitable climatic factors of Sophora tonkinensis Gapnep in Guangxi (in Chinese). Chin J Agrometeorol. 2013;34(6):673–677.
- Matsuura N, Iinuma M, Tanaka T. Phylogenetic analysis in genus Euchresta based on secondary metabolites. Biochem Systemat Ecol. 1994;22(6):621–629.
- Huang M, Deng S, Han Q, et al. Hypoglycemic activity and the potential mechanism of the flavonoid rich extract from Sophora tonkinensis Gagnep. in KK-Ay mice. Front Pharmacol. 2016;7:288.
- Pan QM, Zhang GJ, Huang RZ, et al. Cytisine-type alkaloids and flavonoids from the rhizomes of Sophora tonkinensis. J Asian Nat Prod Res. 2016;18(5):429–435.
- Yang X, Deng S, Huang M, et al. Chemical constituents from Sophora tonkinensis and their glucose transporter 4 translocation activities. Bioorg Med Chem Lett. 2017;27(6):1463–1466.
- Zhang DY, Jiang XH. Mating system evolution, resource allocation, and genetic diversity in plants. Acta Phytoecol Sin. 2001;25:130–143.
- Chaudhary V, Kumar M, Sharma S, et al. Assessment of genetic diversity and population structure in gladiolus (Gladiolus hybridus Hort.) by ISSR markers. Physiol Mol Biol Plants. 2018;24(3):493–501.
- Wu WD, Liu WH, Sun M, et al. Genetic diversity and structure of Elymus tangutorum accessions from western China as unraveled by AFLP markers. Hereditas. 2019;156:8.
- Zarini HN, Jafari H, Ramandi HD, et al. A comparative assessment of DNA fingerprinting assays of ISSR and RAPD markers for molecular diversity of Saffron and other Crocus spp. in Iran. Nucleus. 2019;62(1):39–12.
- Mashope BK, Herselman L, Labuschagne MT. Genetic diversity among South African cactus pear genebank accessions using AFLP markers. Bradleya. 2011;29(29):103–114.
- Moreira AFP, Ruas PM, Ruas CDF, et al. Genetic diversity, population structure and genetic parameters of fruit traits in Capsicum Chinese. Sci Hortic. 2018; 236:1–9.
- Peng YQ, Fan LL, Mao FY, et al. Genetic diversity and population structure of a protected species: Polygala tenuifolia Willd. C R Biol. 2018;341(3):152–159.
- Janssen P, Coopman R, Huys G, et al. Evaluation of the DNA fingerprinting method AFLP as a new tool in bacterial taxonomy. Microbiology. 1996;142(7):1881–1893.
- Vos P, Hogers R, Bleeker M, et al. AFLP: a new technique for DNA fingerprinting. Nucleic Acids Res. 1995;23(21):4407–4414.
- Peakall ROD, Smouse PE. Genalex 6: genetic analysis in Excel. Population genetic software for teaching and research. Mol Ecol Notes. 2006;6(1):288–295.
- Peakall ROD, Smouse PE. GenAlEx 6.5: genetic analysis in Excel. Population genetic software for teaching and research-an update. Bioinformatics. 2012;28(19):2537–2539.
- Falush D, Stephens M, Pritchard JK. Inference of population structure using multilocus genotype data: dominant markers and null alleles. Mol Ecol Notes. 2007;7(4):574–578.
- Evanno G, Regnaut S, Goudet J. Detecting the number of clusters of individuals using the software structure: a simulation study. Mol Ecol. 2005;14(8):2611–2620.
- Jakobsson M, Rosenberg NA. CLUMPP: a cluster matching and permutation program for dealing with label switching and multimodality in analysis of population structure. Bioinformatics. 2007;23(14):1801–1806.
- Rosenberg NA. distruct: a program for the graphical display of population structure. Mol Ecol Notes. 2003;4(1):137–138.
- Oksanen J, Blanchet FG, Friendly M, et al. vegan: Community Ecology Package. In: R package version 2.5-6. 2019. https://cran.r-project.org/web/packages/vegan/vignettes/decision-vegan.pdf. Accessed 19 Mar 2020.
- Hijmans RJ. geosphere: Spherical Trigonometry. In: R package version 1.5-10. 2019. https://cran.r-project.org/web/packages/geosphere/geosphere.pdf. Accessed 19 Mar 2020.
- Hamrick JL, Godt MJW, Sherman-Broyles SL. Factors influencing levels of genetic diversity in woody plant species. New Forest. 1992;6(1–4):95–124.
- Loveless MD, Hamrick JL. Ecological determinants of genetic structure in plant populations. Annu Rev Ecol Syst. 1984;15(1):65–95.
- Wang IJ, Summers K. Genetic structure is correlated with phenotypic divergence rather than geographic isolation in the highly polymorphic strawberry poison-dart frog. Mol Ecol. 2010;19(3):447–458.
- Wright S. Isolation by distance. Genetics. 1943;28(2):114–138.