
 ?Mathematical formulae have been encoded as MathML and are displayed in this HTML version using MathJax in order to improve their display. Uncheck the box to turn MathJax off. This feature requires Javascript. Click on a formula to zoom.
Abstract
In this study, we investigated the effect of genotype × environment interaction (GEI) on the grain yield of 15 different sesame genotypes on four test areas (Arak, Birjand, Karaj and Shiraz) in two years (2017–2018). We observed significant differences in all sources of combined variance analysis. The interaction items in AMMI (additive main effects and multiplicative interactions) analysis of variance were divided into three parts, in which the interaction principal components IPC1 and IPC2 items justified about 85% of interactions. Also, IPC2 and residual items were non-significant. Our experiments showed that the superior genotypes were G8 > G13 > G9 > G10 > G15 > G14 > G7. The labile locations were Karaj > Birjand > Arak > Shiraz. Furthermore, G4, G1, G13, G8 and G10 (G4 > G8 > G9 > G10 > G13 > G6, respectively) had the least GEI concerning IPC1 vs. grain yield (IPC1 vs. IPC2, respectively). The recommended genotypes for each region include G9, G2, G3 and G12 for Arak and Birjand; G7, G11 and G14 for Karaj; and G10, G8, G4 and G13 for Shiraz. According to the low environmental impact and the proximity of the IPC values of Shiraz, Arak and Birjand environments, Arak can be considered as the mega-environment for these three locations. The stable genotypes with higher general durability consisted of G4 > G6 > G1 > G2. Based on the AMMI stability value (ASV) and genotype selection index (GSI), Jirouf 13 (G4), Darab 14 (G8), Safi Abad 1 (G9), Ahwaz Local Cultivar (G10) and Isfahan Local Cultivar (G13) were superior genotypes about grain yield and GEI impact, and can be recommended for future investigations.
Introduction
Sesame (Sesamum indicum L.) is a member of the Pedaliaceae family. In terms of genetics, sesame is a diploid species with 2n = 2x = 26 chromosomes [Citation1]. Sesame has abundant wild relatives in Africa and India and is one of the oldest cultivated and important oilseed crops in the world. Because of having high-quality nutritional seeds, it is cultured vastly in Africa, Asia and South America [Citation2]. Most researchers believe that West Asia, India, China and Japan are secondary distribution centres, and for now, sesame is cultivated in different parts of the world [Citation3].
Sesame seeds contain oil (45%–55%), protein (18%–25%), vitamins E, A and B complex, carbohydrates and minerals like calcium, phosphorus, iron, copper, magnesium, zinc and potassium [Citation4]. According to FAOSTAT (2018), from about 12-million-hectare world sesame area harvest, the production was about 6.45 million tons, and the estimated average productivity is 535 kg/ha. In Iran, these numbers are 42,000 ha, 29,000 tons and 690.5 kg/ha, respectively. The main sesame production regions in the world are Asia (54.3%) and Africa (41.8%). Other territories have about 3.9% share in the sesame production [Citation5].
In the past, genotypes were selected only by comparing their average productivity, but nowadays genotype × environment interaction (GEI) and stability are required as a basis for an adequate breeding program to serve as a decision tool in releasing improved varieties and deciding the adaptation domain of such varieties [Citation6].
Analysis of genotypes by environmental data is often limited to evaluation based on genotype main effect (G), while GEIs are disorder factors. A large value of GEI usually has a negative effect on the yield estimate precision and indicates a decreased genotype effect on the value of the phenotypic trait.
Because of the GEI, it is important to select stable genotypes that interact less with the varying environments in which they are to be grown [Citation7].
Several multivariate procedures proposed to explore GEI include principal component analysis (PCA), additive main effects and multiplicative interactions (AMMI) and genotype plus GEI biplot (GGE) analysis [Citation8,Citation9]. The statistical analyses used to obtain data are multivariate analysis using AMMI model for the analysis of variance (ANOVA) based on a linear model with additive main effects and interactions, and a joint regression analysis using a model proposed by Eberhart and Russell [Citation10]. The AMMI model has been recommended for statistical analysis of yield trials, and it was preferred over any other statistical analyses [Citation9]. Although AMMI is essential to identify the contribution of the different sources of variation in relation to GEI, it provides no insight into the particular patterns of genotypes or environments that give rise to GEI. Generally, in yield data, all three sources of variance, namely the genotype main effect, the environment main effect and G × E interaction, are statistically significant and substantial [Citation11]. By AMMI analysis, we can predict the stability based on mean performance and magnitude of interaction principal component axis scores [Citation12,Citation13].
The objectives of this investigation were: (1) to apply the AMMI model to evaluate the magnitude of the effect of GEI on grain yield tested across four locations and (2) to identify the stable and superior sesame genotypes in each test environment.
Materials and methods
Plant materials
Nine varieties and six cultivars of sesame plants were evaluated from June up to early July 2017 and 2018 in four test locations ( and ). The genotypes were sown in a randomized complete block design replicated thrice in a plot consisting of three rows 4 m long with a spacing of 60 cm between rows and 10 cm between plants. Depth of about 2.5 cm was used in the planting of seeds. A cropped cut of one square metre from the middle of each plot was harvested for grain yield data.
Table 1. Sesame genotypes used in this study.
Table 2. Characteristics of the study sites.
Data analysis
Since the ANOVA considers only the main effects, the AMMI model was used. The first step of AMMI analysis includes two parts: additive variance and multiple (interaction) variance. After that, PCA was applied on the interaction part, thus, the residual section of the ANOVA model which exploits a new set of peculiarities axes makes the interaction patterns more effective [Citation14]. The genotype stability between locations via using the principal component axis scores was specified by AMMI analysis.
ANOVA for grain yield was carried out for combined variance analysis between locations. The statistical methods were PCA, AMMI.
For a simple ANOVA of a randomized complete block design, the model was:
where μ is the overall mean of the studied trait (grain yield) in the population, Gi is the effect of the ith genotype, Ej is the efficacy of the jth environment, GEij is the interaction of the ith genotype with the jth environment, Bij is the effect of the kth replication in the jth environment, and ɛijk is the random error.
To compute G × E interaction, AMMI methods were used. The combined variance analysis was done and the means served as a basis for the AMMI analysis. The base on the mathematical formula of AMMI was as follows:
where
is the yield of the ith genotype in the jth environment, N is the number of principal components in the AMMI model,
is the overall mean of genotypes,
and
are the genotype and environment deflections from the overall mean,
is the eigenvalue of the PCA axis k,
and
are the genotype and environment principal components scores for axis k and
is the remaining value.
Purchase [Citation15] suggested an equation for AMMI analysis called AMMI stability value (ASV) [Citation15]. The distance from the zero point in a two-dimensional scatter plot between IPC1 (interaction PCA 1) vs. IPC2 is the ASV. IPC1 has a stronger effect than IPC2 in the sum of square G × E; therefore, a factor must be added to IPC1 for the symmetrical discrepancy with IPC2, in such a way that, the role of IPC1 and IPC2 fit in the sum of square G × E [Citation16]. In this equation, the most stable genotype and test environment have minimum ASV [Citation17].
The following equation was used to quantify and rank genotypes and locations:
Another parameter that we can calculate in AMMI analysis is the genotype selection index (GSI). Selection of stability will not necessarily lead to the best genotype (in terms of performance). Thus, the GSI for each genotype was computed via the sum of the rank of the genotype grain yield (RYi) and the rank of the genotype ASV (RASVi). Any genotype that has the least GSI, was suggested as the most stable genotype [Citation17,Citation18].
Results and discussion
ANOVA
The ANOVA showed significant differences for the year and genotype items (level of 99.9%). The location item was significant at the 95% level too. Furthermore, all interaction effects (Year × Location, Location × Genotype, Year × Genotype, and Year × Location × Genotype) were significant at the 99% level (). This result was similar to previous reports by Seyni et al. [Citation19] and Baraki and Gebremariam [Citation20].
Table 3. ANOVA of grain yield.
AMMI and PCA
Grain yield was investigated by AMMI ANOVA (). For the grain yield trait, we found significant differences between genotypes, locations, interactions and IPC1 parts. Because the cumulative contribution from IPC1 and IPC2 justified more than 85% of the interaction but IPC2 and the residuals were non-significant, the model of AMMI analysis variance with IPC1 and IPC2 seems adequate.
Table 4. AMMI analysis of variance of grain yield of sesame genotypes.
According to the results shown in , when genotypes are examined in multi-location yield experiments, a cross over GEI most often happens [Citation21]. The cumulative percentage of the G × E interaction that was justified by IPC1 and IPC2 was 85.05%. Also, the contributions of IPC1 and IPC2 were 56.17% and 28.88%, respectively. These results are similar to the observations reported by Baraki and Gebremariam [Citation20] and Okello-Anyanga et al. [Citation22].
The scatterplot of grain yield vs. IPC1 () illustrates that the superior genotype had a higher agricultural yield (horizontal axis) and in terms of the first interaction item (IPC1), which is shown on the vertical axis, had a minimum value and was near zero. Not only high grain performance but also the stable genotypes need to be taken into consideration. The vertical line that divides the horizontal axis into two parts is the mean of grain yield and the genotypes that are located on the right side had a higher grain yield than the average. On the other hand, the horizontal line that divided the vertical axis into parts is the zero line for IPC1. The stable genotypes are near to this line and have a minimum G × E interaction. The genotypes that can be recommended in poor and weak locations have low grain yield performance (below average) but they should have a positive value of IPC1.
Figure 1. Scatterplot of IPC1 vs. grain yield in AMMI analysis.
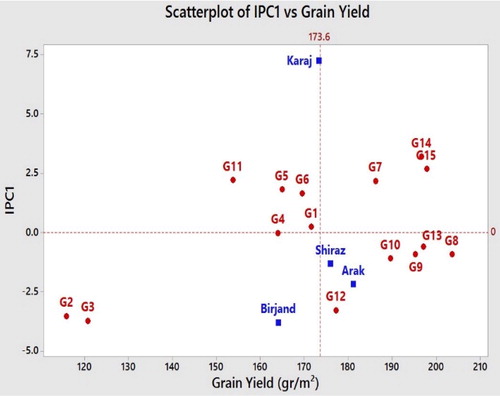
According to a similar approach applied by Baraki and Gebremariam [Citation20], the genotypes and environments average was 173.6 g/m2. The superior genotypes were G8 > G13 > G9 > G10 > G15 > G14 and G7, and where located on the right side of the graph and close to zero in terms of the IPC1 axis. The most unstable genotypes and the lowest grain yield among the genotypes belonged to G2 and G3. G4, G1, G13, G8 and G10 had the least G × E interaction. The labile locations were Karaj > Birjand > Arak and Shiraz.
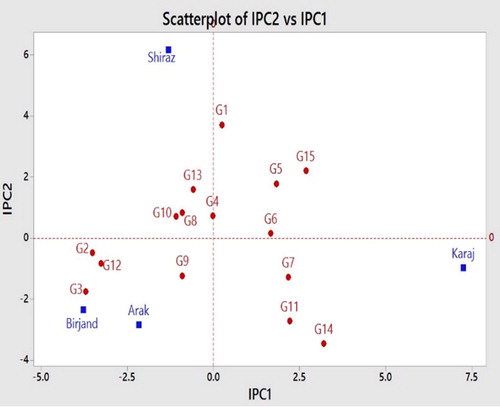
According to the correlation between IPC1 and IPC2, the genotypes that were positioned near the origin had the least interaction, and the genotypes positioned near to the axis had more general stability. Furthermore, any genotypes that are close to each location have specific stability in that environment [Citation23]. In terms of the grain yield feature, G4 > G8 > G9 > G10 > G13 and G6 showed minimum interplay between genotypes and locations. The locations could be classified into three groups: Birjand and Arak formed a group, Shiraz was placed in another group and Karaj was in the third group. Likewise, the genotypes could be grouped, too. G9, G2, G3 and G12 had specific stability in Arak and Birjand. The genotypes that had specific stability in Karaj location included G7, G11 and G14. The genotypes with specific stability in the Shiraz experimental area were G10, G8 G4 and G13. The genotypes G1, G5, G6 and G15 were plotted in the fourth quadrant and could not be attributed to any locations. The genotypes that have more general stability included G4 > G6 > G1 and G2 (). Similar to the method used by Singh et al. [Citation24] to introduce a mega-environment and reduce the research costs, Arak can be suggested for future primary breeding activities instead of Birjand and Shiraz. This is feasible because of the vicinity of Arak to these two locations, as well as because of its low IPCs value and better grain yield performance, as demonstrated in and .
Figure 2. Scatterplot of IPC1 vs. IPC2 in AMMI analysis of grain yield.
shows the average grain yield, IPC score, ASV and GSI of each genotype.
Table 5. Grain yield average, IPC scores, ASV and GSI sesame genotypes and test locations.
According to the ASV, the five superior stable genotypes were G4 > G8 > G13 > G9 and G10. These genotypes had the highest stability and the lowest role in G × E.
Accordingly, the labile locations were Karaj > Birjand > Shiraz and Arak.
If we consider the statistic GSI, the stable genotypes with minimum GSI were G8 > G13 > G9 > G10 ().
AMMI is one of the best analyses for testing genotype stability. According to Kindeya et al. [Citation25], the AMMI model and GGE biplot are the best methods to assay the GEI. In this study, our analysis of 15 sesame genotypes on four test locations in two years for the grain yield trait gave similar F-test results to the AMMI analysis performed by Gebeyehu et al. [Citation16]. Each of the AMMI stability parameters relates to a different concept of yield stability and may be useful to plant breeders attempting to select genotypes with high, stable and predictable yield across environments [Citation26]. Due to the low environmental impact and the proximity of the IPC value of Shiraz, Arak and Birjand environments, Arak is being suggested for future primary breeding plans as the mega-environment.
Conclusions
In this study, we analysed 15 sesame genotypes on four test locations in two years for the grain yield trait. All items of the combined ANOVA were significant; the interaction items in AMMI ANOVA were significant, too. The F-test indicated IPC2 as non-significant, and the cumulative percentage of IPC1 and IPC2 justified 85.05% of the G × E interaction, so IPC1 and IPC2 were sufficient for the AMMI ANOVA model. The grain yield average was 173.6 g/m2. The superior stable genotypes were G8 > G13 > G9 > G10 > G15 > G14 and G7. The minimum interaction G × E of genotypes was observed for G4, G1, G13, G8 and G10. The labile locations were Karaj > Birjand > Arak and Shiraz. G4 > G8 > G9 > G10 > G13 and G6 had minimum interplay between genotypes and locations. The ASV showed that Jirouf 13 (G4), Darab 14 (G8), Safi Abad 1 (G9), Ahwaz Local Cultivar (G10) and Isfahan Local Cultivar (G13) were superior genotypes and had less G × E interaction impact than other genotypes in this trial. According to the GSI, Darab 14 (G8), Isfahan Local Cultivar (G13), Safi Abad 1 (G9) and Ahwaz Local Cultivar (G10) had minimum GSI values and can be recommended for further popularization. Arak is suggested for future primary breeding plans in Iran as the mega-environment.
Disclosure statement
No potential conflict of interest was reported by the authors.
References
- Mushtaq A, Hanif MA, Ayub MA, et al. Sesame. In: Hanif M, Nawaz H, Khan M, et al., editors. Medicinal plants of South Asia. Amsterdam: Elsevier; 2020. p. 601–615.
- Dossa K, Diouf D, Wang L, et al. The emerging oilseed crop Sesamum indicum enters the “Omics” era. Front Plant Sci. 2017;8:1154.
- Yamanura D. Sesame growing: an idealized overview. In: Riley KW, editor. Oil Crops: Proceedings of a Workshop; 1983 Sep 3–8; Cairo, Egypt. Ottawa: IDRC-MR93e, IDRC; 2008.
- Ceccarelli S, Guimarães EP, Weltzien E. Plant breeding and farmer participation. Rome: Food and Agriculture Organization of the United Nations; 2009.
- FAOSTAT. Crops area harvested, yield and production data. 2018 [cited 2020 Feb 6]. Available from: http://www.fao.org/faostat/en/#data/QC
- Yan W. GGE biplot vs. AMMI graphs for genotype-by-environment data analysis. J Indian Soc Agric Stat. 2011;65(2):181–193.
- Kumaresan D, Nadarajan N. Genotype × environment interactions for seed yield and its components in sesame (Sesame indicum L.). Electron J Plant Breed. 2010;1(4):1126–1132.
- Yan W, Hunt LA, Sheng Q, et al. Cultivar evaluation and mega-environment investigation based on the GGE biplot. Crop Sci. 2000;40(3):597–605.
- Zobel RW, Wright MJ, Gauch HG. Statistical analysis of a yield trial. Agron J. 1988;80(3):388–393.
- Eberhart SA, Russell WA. Stability parameters for comparing varieties. Crop Sci. 1966;6(1):36–40.
- Kempton RA. The use of biplots in interpreting variety by environment interactions. J Agric Sci. 1984;103(1):123–135.
- Tadesse H, Abay F. Additive main effects and multiplicative interactions analysis of yield performance of sesame genotypes across environments in Northern Ethiopia. J Drylands. 2011;4:259–266.
- Zenebe M, Hussien M. Study on genotype × environment interaction of oil content in sesame (Sesamum indicum L.). Middle East J Sci Res. 2009;4(2):100–104.
- Gauch HG, Zobel RW. Predictive and postdictive success of statistical analyses of yield trials. Theor Appl Genet. 1988;76(1):1–10.
- Purchase JL. Parametric analysis to describe genotype × environment interaction and yield stability in winter wheat [PhD thesis]. Bloemfontein: University of the Orange Free State; 1997.
- Gebeyehu C, Bulti T, Dagnachew L, et al. Additive main effect and multiplicative interactions (AMMI) and regression analysis in sorghum [Sorghum bicolor (L). Moench] varieties. J Appl Biosci. 2019;136(1):13877–13886.
- Baraki F, Tsehaye Y, Abay F. Grain yield performance and stability analysis of sesame (Sesamum indicum L.) genotypes in Western Tigray, Ethiopia. J Exp Agric Int. 2019;29(6):1–9.
- Farshadfar E, Vaisi Z, Yaghotipoor A. Non parametric estimation of phenotypic stability in wheat-barley disomic addition lines. Ann Biol Res. 2011;2(6):586–598.
- Seyni B, Abdoua Y, Sitou L. Seed yield stability and analysis of genotype × environment interaction of sesame genotypes in central south of Niger. J Anim Plant Sci. 2017;34(3):5535–5547.
- Baraki F, Gebremariam G. Genotype × environment interaction and stability of oil content of sesame (Sesamum indicum L.) genotypes in Northern Ethiopia. J Plant Breed Genet. 2018;6(2):57–65.
- Ceccarelli S, Grando S, Booth RH. International breeding programmes and resource-poor farmers: crop improvement in difficult environments. Workshop on Participatory Plant Breeding; 1995 Jul 26–29; Wageningen, Netherlands; 1996. Rome: IPGRI.
- Okello-Anyanga W, Rubaihayo P, Gibson PT, et al. Genotype by environment interaction in sesame (Sesamum indicum L.) cultivars in Uganda. Afr J Plant Sci. 2016;10(10):189–202.
- Nikkhah HR, Yousefi A, Mortazavian SMM, et al. Analysis of yield stability of barley (Hordeum vulgare L.) genotypes-using additive main effects and multiplicative interaction (AMMI) model. Iran J Crop Sci. 2007;9(33):1–13.
- Singh C, Gupta A, Gupta V, et al. Genotype × environment interaction analysis of multi-environment wheat trials in India using AMMI and GGE biplot models. Crop Breed Appl Biotechnol. 2019;19(3):309–318.
- Kindeya YB, Mekbib F, Abraha Alle E, et al. AMMI and GGE bi-plot analysis for seed yield and oil content of sesame (Sesamum indicum L.) genotypes in Tigray, Northern Ethiopia. J Agric Crops. 2020;6(64):58–67.
- Mohammadi M, Sharifi P, Karimizadeh R. Stability of grain yield of durum wheat genotypes by AMMI model. Agric Forest/Poljopriv Sumars. 2015;61(3):181–193.