
 ?Mathematical formulae have been encoded as MathML and are displayed in this HTML version using MathJax in order to improve their display. Uncheck the box to turn MathJax off. This feature requires Javascript. Click on a formula to zoom.
Abstract
This study was conducted to investigate the genetic diversity and population structure of globally diverse mini core collection of safflower (Carthamus tinctorius L.) using agro-morphological, sequence-related amplified polymorphism (SRAP) and simple-sequence repeats (SSR) molecular markers. Field experiment results showed significant differences between genotypes for agro-morphological traits such as: number of capitula per plant, number of seeds per plant, 1000-seed weight and seed yield. Ten SRAP primer combinations generated 120 polymorphic bands with an average polymorphism information content (PIC) value of 0.23. High allelic variation using 10 SSR markers observed across genotypes, with an average value of 6.8 alleles per locus and relatively high value for PIC (0.69). Pooled molecular data (SSR + SRAP) were used to identify the population structure and genetic diversity using discriminant analysis of principal components (DAPC) and STRUCTURE analysis. The results revealed four clusters within the safflower accessions, while there was no strong correlation between geographical origins and estimated genetic diversity. Our results showed high genetic diversity for both agro-morphological and molecular analysis in the examined safflower germplasm. This mini core germplasm can be used for germplasm management and future safflower breeding programs.
Introduction
Safflower (Carthamus tinctorius L.) is an annual oilseed crop with multi-purpose properties used for production of vegetable oil, natural dye or pharmaceuticals [Citation1, Citation2]. Safflower is widely adapted over a range of agro-climatic regions and it is believed to have originated in the Fertile Crescent about 4000 years ago [Citation3, Citation4]. Safflower oil contains 70–75% linoleic acid, which is considered high quality oil, and this made safflower an important source for edible oil production [Citation5]. As Iran import more than 90% of vegetable oils, there is need of critical efforts for development of oilseed production. Oilseed crop consumption has increased in the last decade due to rising demands for oil sources as food and also for industrial uses [Citation6, Citation7]. This demands for crops productivity to continue to rise, and there is an important need to develop new varieties that have higher yield and are able to generate produce in different challenging environments. Safflower production is affected by various biotic and abiotic stresses, which restricts the yields and discourages farmers from cultivating it [Citation2]. Characterization of the genetic diversity in breeding lines and cultivars among global germplasm and main origins is fundamental for the development of efficient breeding strategies [Citation8, Citation9]. Safflower genotypes of different origins are very similar for most of the agro-morphological traits. Therefore, it is difficult to determine the main centers of diversity and emergence [Citation1, Citation10]. Recently, molecular classification of safflower germplasm revealed five distinct centers of origin for this crop, including Europe, Central Middle-East (Iran, Iraq, Turkey and Afghanistan), Far-East (India and Pakistan) and Levantine (Israel, Syria and Jordan) [Citation10], but most of the safflower accessions collected from each ‘Center’ are very similar in morphological characteristics such as height, flower color and seed morphology [Citation11]. A recent study on a globally diverse set of safflower germplasm revealed that safflower accessions from Iran, Turkey and Pakistan are genetically very different from those that originated from the Near East (Afghanistan and China) [Citation12]. Most of safflower breeding strategies and activities have focused on oil content and seed yields and this has narrowed up the genetic basis of safflower germplsms [Citation13, Citation14]. Therefore, characterization of germplasms from diverse geographical zones is a fundamental strategy for germplasm conservation and future utilization in breeding programs [Citation14–16]. In this case, the development of a core collection from different origins that represents a minimum number of accessions and captures high diversity is an efficient alternative strategy [Citation2, Citation3, Citation17]. Characterization of diverse germplasm in plant species by agro-morphological traits could be affected by environmental conditions. In addition, large tracts of land are often required for these experiments, making it not appropriate for accurate analysis and possibly more expensive than molecular assessment [Citation18, Citation19]. Nowadays, molecular markers as a versatile tool have been used to study the genetic diversity and analyze the population structure among different plant species as well as in safflower [Citation7, Citation8].
The genetic diversity in safflower germplasm has been explored using agro-morphological characteristics [Citation20, Citation21], biochemical markers [Citation5, Citation22] and different molecular markers such as RAPD [Citation9], ISSR [Citation5, Citation23], AFLP [Citation2], SRAP [Citation3, Citation24], SSRs [Citation25–28] and gene-based functional markers [Citation4]. SSR markers are co-dominant, highly polymorphic and typically with known position on genome and have been introduced as a one of the best markers for genome mapping, genetic diversity and population structure analysis in a wide range of plant species [Citation29]. Sequence-related amplified polymorphism (SRAP), a recently developed dominant marker, is inexpensive and highly polymorphic and has been used in many plant species [Citation30, Citation31]. This technique was designed to specifically amplify the coding regions within a genome, and co-dominance has been identified in up to 20% of SRAP markers, making this marker more efficient than AFLP, ISSR and RAPD [Citation30, Citation31].
The present study aimed at analysis of the genetic diversity and population structure of a mini core subset of safflower, comprising of 135 accessions from different geographical origins using SSR and SRAP markers.
Materials and methods
Plant material and DNA extraction
A mini core subset of 135 safflower accessions and cultivars representing from 15 countries were used in this study (). The genotypes belonged to Afghanistan (4), Bangladesh (1), China (10), Egypt (2), Germany (1), India (30), Iran (41), Israel (4), Mexico (1), Morocco (2), Pakistan (5), Portugal (4), Sudan (2), Turkey (12) and the USA (16). These genotypes were chosen from a core collection of 250 safflower genotypes based on three years (2015-2017) field performance at Sararood Dryland Agricultural Institute, Kermanshah, Iran. Selection of genotypes was based on desirable agronomical traits and seed yield. Ten seeds from each genotype were sown in plastic pods and total DNA was extracted from young leaves following a CTAB DNA extraction protocol [Citation32]. Extracted DNA was tested for quality in 0.8% agarose gels and concentrations were determined by a Nanodrop 2000 spectrophotometer (Thermo Fischer Scientific, USA). All samples were diluted in final concentration (20 ng/µL) for polymerase chain reaction (PCR) analysis.
Table 1. Details of 135 safflower accessions (Accession name and origin) subjected for genetic diversity analysis.
Morphological traits evaluation
One hundred thirty-five safflower (Carthamus tinctorius L.) accessions were grown in Sararood Dryland Agricultural Research Institute, Kermanshah, Iran, from October to February in two consecutive years, 2015-2016 and 2016-2017. The accessions were grown in Lattice design with two replications. Each genotype was planted in three rows 2 m long, with 0.5 m distance between rows and 20 cm between plants in rows. Moreover to determine the seed yield and morphological traits, after discarding the border rows, ten plants from the middle row (in each replication) were chosen for measurement of 9 morphological traits, namely: plant height (cm), number of secondary branches, number of capitula per plant, 1000-seed weight (g), head diameter, number of seeds per capitula, number of seeds per plant, seed yield (g/plant), seed oil content (%).
During the flowering time, the youngest fully-expanded leaves from each genotype were used for measurement of the relative water content (RWC) using the following equation [33]:
where FM is leaf fresh weight, DM is dry weight of leaves after drying at 75 °C for 72 h, and TW is the turgid weight of leaves after soaking in water for 12 h at 15-20 °C (room temperature).
SRAP-PCR analysis
The molecular phylogenetic analysis using SRAP markers was done according to previous studies in safflower [Citation3]. Twenty-five SRAP primer combinations () were initially tested for polymorphism rate on a set of twenty accessions; finally ten primer combinations with clear and strong bands were used for genetic diversity on the entire germplasm. PCR was performed in 20 µL reaction volumes containing: 1× PCR buffer, 1.8 mmol/L MgCl2, 0.3 mmol/L dNTPs, 0.3 μmol/L of each primer, 1.5 U of Taq polymerase enzyme (Cinagen, Iran) and 30 ng of DNA template, using an Eppendorf PCR machine (Master Cycler Gradiant, Eppendorf, Germany). The PCR conditions for amplification using SRAP markers have been described previously [Citation30]. DNA fragments were separated in 2% MetaPhor® agarose gels, stained with ethidium bromide and visualized under ultraviolet (UV) light.
Table 2. Primers used for sequence-related amplified polymorphism (SRAP) analysis in safflower accessions.
SSR marker analysis
Eighteen previously published SSR primer pairs were selected based on allele size and polymorphism level [Citation25]. Ten primer pairs () with scorable and strong amplification were selected for genetic diversity on entire germplasm. PCRs were performed in 25 µL total reaction volumes containing: 1× PCR buffer, 2.5 mmol/L MgCl2, 0.2 mmol/L each dNTP, 0.4 μmol/L of each primer, 1 U of Taq polymerase enzyme (Cinagen, Iran) and 20 ng of DNA template. The thermal profile followed was 94 °C for 5 min (initial denaturation), followed by 30 cycles of denaturation at 94 °C for 1 min, annealing at 55 °C for 1 min, extension at 72 °C for 2 min, and a final extension of 10 min at 72 °C. All PCR products were separated in 3% MetaPhor® agarose gels, stained with ethidium bromide and visualized under UV.
Table 3. SSR markers used for genetic diversity analysis in safflower accessions.
Data analysis
Descriptive statistics parameters including mean, maximum, minimum, median and coefficient of variation (CV) for all measured morphological traits were calculated through STATISTICA software. Mean value of data from two years field evaluation were used to generate similarity (GS) index with SIMQUAL routine Dice and this GS matrix transferred into distance matrix. All procedures were done by NTSYS-pc software [Citation34].
Genetic similarities (GS) of safflower genotypes based on agro-morphological traits were calculated by NTSYS-pc statistical package [Citation34], then GS was transformed to a distance matrix using Ward methods [Citation35]. The cluster analysis of morphological traits was performed using SAS JMP Statistical package. Amplified SRAP markers were scored visually for present (1) and absent (0) of each band in all safflower accessions. SSR markers were scored based on allele size at each locus, and genetic dissimilarity (GD) values between individuals were calculated through DARwin 5.0.128 [Citation36]. Population genetic parameters including number of alleles (Na), number of effective alleles (Ne), gene diversity (He), Shannon diversity index (I), observed heterozygosity (Ho), expected heterozygosity (He) and polymorphism information content (PIC) were calculated by GENALEX 6.1 software [Citation37]. GD matrix was used for construction of a dendrogram by the neighbor-joining (NJ) method [Citation38] using DARwin 5.0 software [Citation38]. Population structure was analyzed using STRUCTURE 2.1 based on an admixture model. The hypothetical number of populations (K-value) was estimated ranging from 2 to 10, with ten independent simultaneous runs, followed by 100,000 Markov chain Monte Carlo replicates.
The outputs of STRUCTURE were submitted to STRUCTURE HARVESTER WEB version 0.6.94 [Citation39] to estimate the optimal value of K using the Delta (K) method [Citation40]. The appropriate number of clusters was chosen by plotting the ln P(D) values against Δk values with the best K-value selected according to the Evanno test. In order to determine the fitting population structure in the safflower germplasm and estimate the number of subgroups in the population, Eigen vectors (loadings) of the first three principal components were determined and used for Discriminant Analysis of Principal Component (DAPC) using the adegenet package [Citation41] for R software version 3.2.3 [Citation42].
Results and discussion
Morphological traits diversity
The morphological traits and seed yield of 135 safflower accessions were assessed under field conditions in two growing seasons (2015-2016 and 2016-2017). For each of the traits evaluated, the descriptive statistics including the means, median, maximum, minimum with their coefficient of variation (CV) obtained on the basis of the averages of data are summarized in . The results indicated high differences between all measured morphological traits. The grain yield ranged from 2.64 to 63.06 (g/plant) with an average value of 11.30 (). There were high differences between the minimum and maximum values of seed yield, number of seeds per plant, number of capitula per plant and 1000-seed weight among the safflower accessions. Cluster analysis of materials was conducted on morphological traits based on complete linkage algorithm using Jaccard's coefficient. The 135 safflower accessions were grouped into 4 clusters (). Cluster I, comprised 10 genotypes originating mainly from Iran (6) and 4 genotypes from India and Germany. These accessions were superior for high seed yield and oil content in comparison to other accessions belonging to other clusters (). Cluster II, comprised 18 genotypes from different sources that have moderate seed yield and seed oil content, but higher 1000-seed weight in comparison to other genotypes (). Cluster III and IV, comprised 60 and 47 genotypes, respectively. The accessions grouped in these clusters did not correlate with geographical origins and showed relatively low seed yield in comparison to other accessions in cluster I and II.
Figure 1. Cluster analysis of 135 safflower accessions based on morphological traits data across two years (2015-2016 and 2016-2017). The x–y coordinates are the principal components, which are linear combinations of the original dimensions.
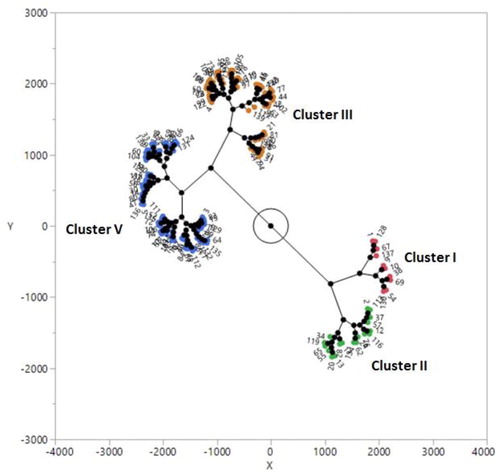
Table 4. Descriptive statistics for agro-morphological traits in 135 safflower accessions evaluated in the field in 2015-2016 and 2016-2017.
SRAP analysis
Initially, 25 SRAP primer pair combinations were tested for polymorphism level on 30 accessions from diverse origins. Finally, 10 SRAP primer pair combinations that showed high polymorphism with clear and scorable bands were chosen for genetic diversity analysis on 135 safflower accessions (). A total of 165 bands were amplified using 10 SRAP primer combinations, of which 120 bands were polymorphic with an average value of 12 polymorphic bands per primer (). The number of polymorphic bands varied from 10 to 14; all primer combinations showed relatively the same polymorphism rate. The polymorphism information content (PIC) values ranged from 0.16 to 0.29, with an average value of 0.23. The highest (0.29) and lowest (0.16) values of PIC were obtained by Em2-Me1 and Em3-Me3 primer combinations, respectively (). The genetic diversity (GD) for the primer combinations ranged from 0.18 to 0.37, with and average value of 0.29. Shannon’s diversity index (I) ranged from 0.30 to 0.50, with an average value of 0.43. There were highly positive correlations of PIC with gene diversity (r = 0.99**) and PIC with Shannon’s diversity index (r = 0.95**). Neighbor-joining (NJ) cluster analysis based on the genetic distance matrix of SRAP markers, grouped the safflower accessions into five distinct clusters (). Cluster I comprised of 48 accessions that originated from diverse sources. Cluster II comprised 3 accessions, from China (2) and Morocco (1). Cluster III comprised 61 safflower accessions, which differentiated into 3 sub-clusters. Most of the Iranian improved cultivars in this cluster grouped in a sub-cluster separately. Cluster IV comprised 4 accessions from India, the USA and Turkey. Cluster V, included 19 accessions mostly originating from the Middle-East and Far-East (Iran, Turkey and India) ().
Figure 2. PCR amplification profile obtained with SRAP marker (Em2-Me1) (a) and SSR marker (GBCT-184) (b) in safflower genotypes. M: molecular size marker (Cinagen, Iran).
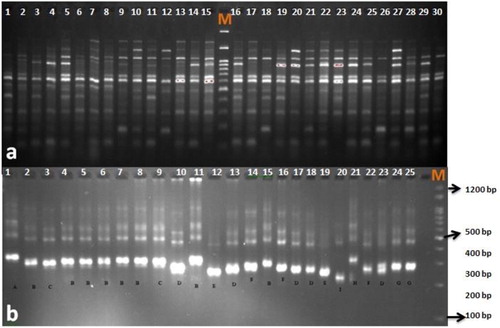
Figure 3. Cluster analysis of 135 safflower genotypes based on genetic dissimilarity matrix obtained by SRAP markers.
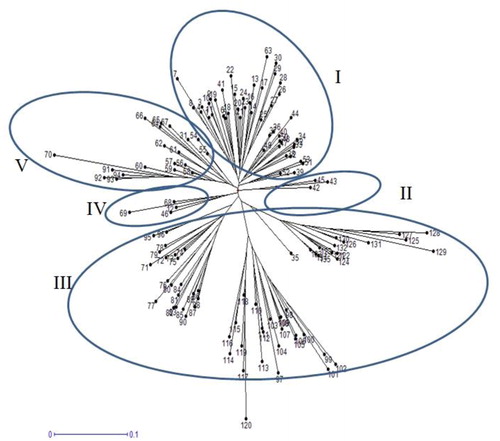
Table 5. Polymorphism characteristics of 10 SRAP primer combinations in 135 safflower accessions.
SSR analysis
One hundred thirty-five safflower accessions were amplified using 10 SSR markers. All markers successfully amplified across all genotypes and produced clear and distinguished allelic variation (). Overall, the SSR markers produced 68 alleles, with an average of 6.8 alleles per SSR locus (). The number of alleles (Na) per locus ranged from 4 to 9. The lowest and highest numbers of alleles were produced by GBCT-329 and GBCT-184, respectively. The number of effective alleles ranged from 2.24 (GBCT-329) to 5.25 (GBCT-445), with an average of 3.90 per locus. The major allele frequency for each SSR locus ranged from 0.29 (GBCT-294) to 0.44 (GBCT-264), with an average value of 0.39 per locus. The polymorphism information content (PIC) values ranged from 0.50 (GBCT-329) to 0.78 (GBCT-445), with an average value of 0.69 per marker (). All SSR loci showed a high level of genetic variation. High level of expected heterozygosity (average He=073) and lower rate of observed heterozygosity (average Ho=0.26) indicated a high level of diversity in safflower as a self-pollinated crop. The average values of Nei and Shannon (I) diversity indices were 0.73 and 1.51, respectively, with the lowest and highest values belonging to GBCT-329 and GBCT-445, respectively. Neighbor-joining (NJ) cluster analysis based on genetic dissimilarity matrix obtained from SSR markers, grouped 135 safflower accessions into four clusters, while cluster I and II divided into five and four sub-clusters (). Cluster I, comprised 21 accessions, mostly originating from India and Turkey, except two genotypes from the USA and Portugal. The genotypes grouped into the second cluster (24 accessions) were mostly from Iran, India and Pakistan. Cluster III comprised 36 accessions of diverse origins and improved Iranian cultivars. Cluster IV comprised 54 accessions, mostly originating from India, Turkey and a few genotypes from the USA and China ().
Figure 4. Cluster analysis of 135 safflower genotypes based on genetic dissimilarity obtained by SSR markers.
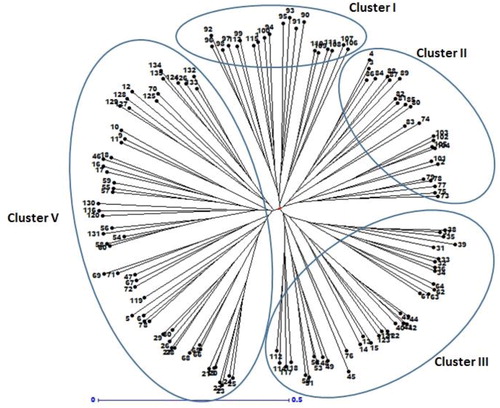
Table 6. Genetic parameters of the 10 polymorphic SSR markers used for genetic diversity in safflower.
Population structure and discriminant analysis of principal components (DAPC)
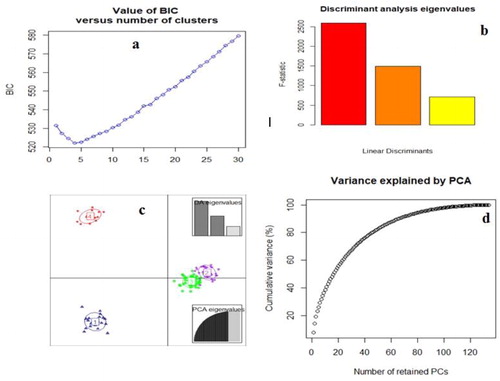
Un-weighted neighbour-joining (UNJ) cluster analysis based on genetic dissimilarity matrix from pooled SRAP and SSR data, grouped 135 safflower accessions into four clusters (). In order to understand the grouping of safflower accessions better, STRUCTURE and discriminant analysis of principal components (DAPC) analysis were used across all genotypes. The population structure of 135 safflower genotypes using a Bayesian Markov chain Monte Carlo approach was analyzed in STRUCTURE 2.2.3. The number of genetic groups (K) showed clear peaks at 4 (), so we analyzed the genetic structure of the 135 safflower genotypes for K = 4 value. Four groups could be distinguished (), which was completely in agreement with the SRAP + SSR molecular based clustering. Discriminant Analysis of principal components (DAPC) also was employed to improve the fitting population structure. The results of DAPC were similar to the result of structure analysis (). The lowest BIC value was obtained at K = 4. Three discrimination functions were detected; these components explained 26.79, 19.78 and 11.09% of the total variance. The comparisons of DAPC and STRUCTURE analysis showed high similarity.
Figure 5. Cluster analysis of 135 safflower genotypes based on genetic dissimilarity obtained by combined data (SRAP and SSR markers).
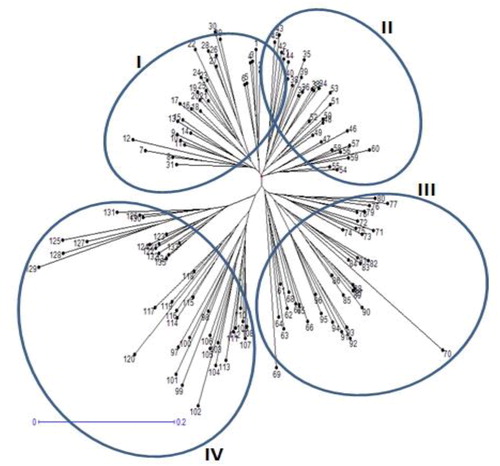
Figure 6. K values based on three independent runs and K ranging from 1 to 10 based on 135 safflower genotypes using SRAP and SSR markers.
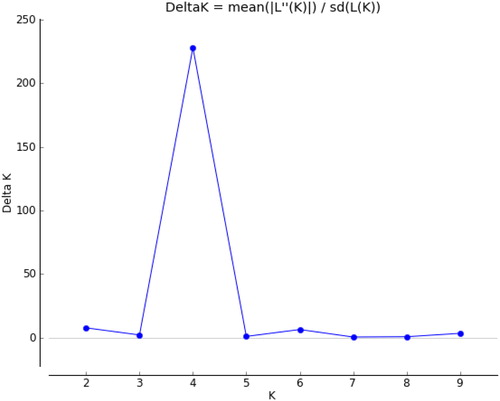
Figure 7. Population genetic diversity of 135 safflower genotypes based on SRAP and SSR markers.
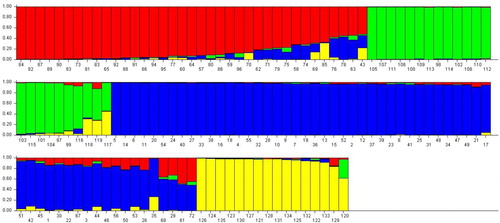
Figure 8. Bayesian information criterion (BIC)(a), the F statistic of the DAPC (b), Scatter plot from the DAPC (c) and the percentage of cumulative variance for the retained PCA eigen vectors (d) for 135 safflower accessions that were used to determine the optimal k number of clusters.
Relationship between safflower accessions and geographical origins
Characterization of genetic diversity in crops germplasm collections is basic and most important for germplam conservation and defining best strategies in crop breeding programs [Citation43]. The present study aimed to evaluate the genetic diversity and population structure in a globally diverse of 135 safflower genotypes using agro-morphological and molecular markers (SRAP and SSR). Field evaluation showed wide range of variation among genotypes for agro-morphological traits such as: number of capitula per plant, 1000-seed weight, number of seeds per capitula and seed yield. The importance of these characters for improvement of safflower in breeding programs has been reported previously [Citation5, Citation8] and also previous studies indicated the high broad-sense heritability for these traits [Citation8]. Selection based on these traits can be used effectively for high yield potential in safflower [Citation8, Citation44]. The variability for most of the morphological traits in the present germplasm can be concluded based on their long-term response to selection in breeding programs from different countries or deliberate selection by farmers for preferred phenotypes. Cluster analysis based on agro-morphological traits, divided safflower genotypes into four distinct clusters. The morphological diversity pattern showed weak correlation with geographical origins and it can be concluded for environmental effects on morphological traits and also the genetic nature of genes that controlled the morphological traits. These finding are in agreement with previous studies on safflower [Citation2, Citation5, Citation9] and other crops [Citation45, Citation46]. Increasing the seed oil content is an important factor in safflower breeding programs and there are efforts for development of cultivars with oil content ranging from 44 to 55% [Citation2], but mostly high oil content safflower genotypes are in consonance with lower 100-seed weight and consequently seed yield [Citation2]. The safflower genotypes that grouped in cluster I showed high oil content and also seed yield as compared to others. The accessions that are mostly from Iran and India distinctly showed superior characters. Overall, the accessions that belonged to cluster I and II showed desirable morphological traits and could be incorporated in various safflower breeding programs. Yield-components such as number of seeds per plant, number of capitula per plant, 1000-seed weight and number of capitula per plant are known as significantly positive traits for yield increasing in safflower [Citation14, Citation47], therefore combined selection criteria from these characteristics can efficiently improve the selection processes in breeding programs [Citation14]. The safflower genotypes were selected for this study based on their field performance in a collection of ∼500 safflower accessions from diverse geographical origins. The relationship observed from morphological traits alone may not reflect the origins, so we believe that complementary evaluation based on molecular markers is needed to better understand the genetic differentiation between safflower genotypes. In this study, we evaluated 10 SRAP primer combinations and 10 SSR markers in 135 safflower accessions. High level of genetic diversity between safflower accessions was observed using SRAP and SSR markers. SRAP markers generated high polymorphism with an average of 12 polymorphic bands per primer and relatively high Shannon index (0.43). The genetic similarity coefficient between accessions ranged from 0.39 to 0.99, with an average value of 0.74, which was in agreement with previous SRAP analysis in safflower [Citation3]. The SSR markers used in this study generated a high level of allelic variation (Na = 6.8, Ne = 3.90, Nei’s index = 0.73 and PIC = 0.69), which is significantly higher than previous reports for allelic diversity in different safflower genotypes [Citation26, Citation48]. Different genetic variation by SSR markers reported in most crops as well as in safflower may reflect the number of markers, origins of genotypes, population size or use of genotypes from diverse origins that have not yet been exposed to selection in parallel breeding programs [Citation26]. Here we reported the cluster analysis, population structure and DAPC for better understanding the genetic differentiation in the studied safflower accessions. SRAP and SSR analysis grouped the safflower accessions into 5 and 4 clusters, respectively. Cluster analysis based on pooled data (SRAP + SSR) divided the accessions into 4 clusters, which is in accordance with STRUCTURE and DAPC analysis. Most of the Iranian improved genotypes showed close relationships in morphological, SRAP and SSR analysis, but overall there were no relationships between cluster grouping and geographical origins. It can be concluded that safflower plants from diverse origins show similar morphological attributes [Citation49, Citation50] and this could possibley be attributed to exchange of breeding materials from diverse sources that are widely used in breeding programs across the world [Citation2, Citation4, Citation9, Citation26]. Most of the safflower genotypes used in this study from reported origins (Iran, Turkey, Sudan) showed admixture grouping with those originating from the USA and China. This could be explained by large worldwide distribution of improved promising safflower accessions from the USA into international breeding programs during the last decades. This is in agreement with previous reports on safflower population genetic structure and domestication analysis [Citation12, Citation50]. High genetic diversity reported in this study can be used for germplasm management and target crosses between genetically distinct parents for enhancing higher heterosis and genetic recombination in their progenies [Citation51]. Population size in a core collection is an important factor for capturing high diversity; in other words, the geographical divergence in a highly self-pollinating crop such as safflower that is grown in different climatic regions can influence the extent of genetic diversity [Citation2, Citation10].
Conclusions
The mini-core collection in the present study was selected from a large-scale composite core collection. The advantages of the present study lie in the extensive characterization in this collection for both molecular and morphological characters. The obtained results can be used effectively in global breeding programs for development of safflower for high seed yield and oil content.
Disclosure statement
No potential conflict of interest was reported by the authors.
References
- Burke JM, Tang S, Knapp SJ, et al. Genetic analysis of sunflower domestication. Genetics. 2002;161(3):1257–1267.
- Kumar S, Ambreen H, Variath MT, et al. Utilization of molecular, phenotypic and geographical diversity to develop compact composite core collection in the oilseed crop, Safflower (Carthamus tinctorius L.) through maximization strategy. Front Plant Sci. 2016; 7:1554.
- Golkar P, Mokhtari N. Molecular diversity assessment of a world collection of safflower genotypes by SRAP and SCoT molecular markers. Physiol Mol Biol Plants. 2018;24(6):1261–1271.
- Talebi R, Nosrati S, Etminan A, et al. Genetic diversity and population structure analysis of landrace and improved safflower (Cartamus tinctorious L.) germplasm using arbitrary functional gene-based molecular markers. Biotech Biotech Equip. 2018; 32(5):1183–1194.
- Talebi R, Abhari SA. Evaluation of genetic diversity in safflower (Carthamus tinctorius L.) using agro-morphological, fatty acid composition and ISSR molecular markers. Res J Biotech. 2016; 11(7):19–27.
- Ghaderi M, Pahlavani MH, Razavi SE. Inheritance of resistance to Pythium ultimum in safflower determined by generation means analysis. Aust J Crop Sci. 2011; 5(4):439–446.
- Golkar P. Breeding improvements in safflower (Carthamus tinctorius L.): a review. Aust J Crop Sci. 2014; 8:1079–1085.
- Amini F, Saeidi G, Arzani A. Study of genetic diversity in safflower genotypes using agro-morphological traits and RAPD markers. Euphytica. 2008;163(1):21–30.
- Khan MA, von Witzke-Ehbrecht S, Maass BL, et al. Relationships among different geographical groups, agro-morphology, fatty acid composition and RAPD marker diversity in safflower (Carthamus tinctorius). Genet Resour Crop Evol. 2009;56(1):19–30.
- Chapman MA, Hvala J, Strever J, et al. Population genetic analysis of safflower (Carthamus tinctorius; Asteraceae) reveals a Near Eastern origin and five centers of diversity. Am J Bot. 2010;97(5):831–840.
- Knowles PF, Ashri A. Safflower: Carthamus tinctorius (Compositae). In: Smartt J, Simmonds NW, editors. Evolution of crop plants. 2nd ed.Harlow, UK: Longman, 1975. p. 47–50.
- Hassani SMR, Talebi R, Pourdad SS, et al. In-depth genome diversity, population structure and linkage disequilibrium analysis of worldwide diverse safflower (Carthamus tinctorius L.) accessions using NGS data generated by DArTseq technology. Mol Biol Rep. 2020;47(3):2123–2135.
- Ali F, Yılmaz A, Nadeem MA, et al. Mobile genomic element diversity in world collection of safflower (Carthamus tinctorius L.) panel using iPBS-retrotransposon markers. PLoS One. 2019; 14(2):e0211985
- Ali F, Yilmaz A, Chaudhary HJ, et al. Investigation of morphoagronomic performance and selection indices in the international safflower panel for breeding perspectives. Turk J Agric For. 2020;44(2):103–120.
- Yang YX, Wu W, Zheng YL, et al. Genetic diversity and relationships among safflower (Carthamus tinctorius L.) analyzed by inter-simple sequence repeats (ISSRs). Genet Resour Crop Evol. 2007;54(5):1043–1051.
- Mahboubi M, Mehrabi R, Naji AM, et al. Whole-genome diversity, population structure and linkage disequilibrium analysis of globally diverse wheat genotypes using genotyping-by-sequencing DArTseq platform. 3Biotech. 2020;10:48.
- Talebi R, Naji AM, Fayaz F. Geographical patterns of genetic diversity in cultivated chickpea (Cicer arietinum L.) characterized by amplified fragment length polymorphism. Plant Soil Environ. 2008;54(No. 10):447–452.
- Mondini L, Noorani A, Pagnotta MA. Assessing plant genetic diversity by molecular tools. Diversity. 2009;1(1):19–35.
- Seyedimoradi H, Talebi R, Kanouni H, et al. Agro-morphological description, Genetic diversity and population structure of chickpea using genomic-SSR and EST-SSR molecular markers. J Plant Biochem Biotechnol. 2019; 28(4):483–495.
- Jaradat AA, Shahid M. Patterns of phenotypic variation in a germplasm collection of Carthamus tinctorius L. from the Middle East. Genet Resour Crop Evol. 2006;53(2):225–244.
- Mohammadi SA, Prasanna BM. Analysis of genetic diversity in crop plants-salient statistical tools and considerations. Crop Sci. 2003;43(4):1235–1248.
- Zhang ZW. Studies on genetic diversity and classification of safflower (Carthamus tinctorius L.) germplasm byisozyme techniques. In: Bergman J, Mündel HH, editors. Proceedings of the 5th international safflower conference. Williston, ND and Sidney, MT. 23–27 Jul. 2001. p. 157–162.
- Golkar P, Arzani A, Rezaei AM. Genetic variation in safflower (Carthamus tinctorious L.) for seed quality-related traits and inter-simple sequence repeat (ISSR) markers. Int J Mol Sci. 2011;12(4):2664–2677.
- Mokhtari N, Rahimmalek M, Talebi M, et al. Assessment of genetic diversity among and within Carthamus species using sequence-related amplified polymorphism (SRAP) markers. Plant Syst Evol. 2013;299(7):1285–1294.
- Lee GA, Sung JS, Lee SY, et al. Genetic assessment of safflower (Carthamus tinctorius L.) collection with microsatellite markers acquired via pyrosequencing method. Mol Ecol Resour. 2014;14(1):69–78.
- Kiran BU, Mukta N, Kadirvel P, et al. Genetic diversity of safflower (Carthamus tinctorius L.) germplasm as revealed by SSR markers. Plant Genet Resour. 2017; 15(1):1–11.
- Bahmankar M, Ahmadi Nabati D, Dehdari M. Genetic relationships among Iranian and exotic safflower using microsatellite markers. J Crop Sci Biotechnol. 2017;20(3):159–165.
- Ambreen H, Kumar S, Kumar A, et al. Association mapping for important agronomic traits in safflower (Carthamus tinctorius L.) core collection using microsatellite markers. Front Plant Sci. 2018; 9:402.
- Chapman MA, Hvala J, Strever J, et al. Development, polymorphism, and cross -taxon utility of EST-SSR markers from safflower (Carthamus tinctorius L.). Theor Appl Genet. 2009;120(1):85–91.
- Li G, Quiros CF. Sequence-related amplified polymorphism (SRAP), a new marker system based on a simple PCR reaction: its application to mapping and gene tagging in Brassica. Theor Appl Genet. 2001; 103:455–461.
- Robarts DW, Wolfe AD. Sequence-related amplified polymorphism (SRAP) markers: a potential resource for studies in plant molecular biology. Appl Plant Sci. 2014;2(7):1400017.
- Lassner MW, Peterson P, Yoder JI. Simultaneous amplification of multiple DNA fragments by polymerase chain reaction in the analysis of transgenic plants and their progeny. Plant Mol Biol Rep. 1989;7(2):116–128.
- Turner NC. Techniques and experimental approaches for the measurement of plant water status. Plant Soil. 1981;58(1-3):339–366.
- Rohlf FJ. NTSYS-PC: numerical taxonomy and multivariate analysis system version 2.0. State University of New York, Stony Brook. 1992.
- Nei M, Li WH. Mathematical model for studying genetic variation in terms of restriction endonucleases. Proc Natl Acad Sci USA. 1979;76(10):5269–5273.
- Perrier X, Flori A, Bonnot F, et al. Data analysis methods. In: Genetic diversity of cultivated tropical plants. Montpellier: Enfield Science Publishers, 2003. p. 43–76.
- Peakall R, Smouse PE. GENALEX 6: genetic analysis in Excel. Population genetic software for teaching and research. Mol Ecol Notes. 2006;6(1):288–295.
- Perrier X, Jacquemoud-Collet JP. DARwin software. Available from http://darwin.cirad.fr/darwin. 2006.
- Earl DA, vonHoldt BM. STRUCTURE HARVESTER: a website and program for visualizing STRU CTU RE output and implementing the Evanno method. Conservation Genet Resour. 2012;4(2):359–361.
- Evanno G, Regnaut S, Goudet J. Detecting the number of clusters of individuals using the software STRUCTURE: a simulation study. Mol Ecol. 2005;14(8):2611–2620.
- Jombart T, Devillard S, Balloux F. Discriminant analysis of principal components: a new method for the analysis of genetically structured populations. BMC Genet. 2010; 11(1):94
- R Core Team. R: a language and environment for statistical computing. Vienna: R Core Team,2014.
- Ghaffari P, Talebi R, Keshavarzi F. Genetic diversity and geographical differentiation of Iranian landrace, cultivars, and exotic chickpea lines as revealed by morphological and microsatellite markers. Physiol Mol Biol Plants. 2014; 20(2):225–233.
- Mahforojaki MS, Talebi R, Pourdad SS. Analysis of tolerance indices for germplasm evaluation in safflower (Carthamus tinctorius L.) subjected to terminal drought stress. South Asian J Exp Biol. 2015; 5(5):156–161.
- Talebi M, Mokhtari N, Rahimmalek M, et al. Molecular characterization of Carthamus tinctorius and C. oxyacanthus germplasm using sequence related amplified polymorphism (SRAP) markers. Plant Omics J. 2012; 5:136–142.
- Pakseresht F, Talebi R, Karami E. Comparative assessment of ISSR, DAMD and SCoT markers for evaluation of genetic diversity and conservation of landrace chickpea (Cicer arietinum L.) genotypes collected from north-west of Iran. Physiol Mol Biol Plants. 2013; 19(4):563–574.
- Shafiei-Koij F, Majidi MM, Mirlohi A, et al. The use of wild relatives of safflower to increase genetic diversity for fatty acid composition and drought tolerance. Crop Sci. 2019;59(5):2109–2110.
- Sehgal D, Raina SN. Genotyping safflower (Carthamus tinctorius) cultivars by DNA fingerprints. Euphytica. 2005;146(1-2):67–76.
- Ashri A. Evaluation of the germplasm collection of safflower, Carthamus tinctorius L. V. Distribution and regional divergence for morphological characters. Euphytica. 1975;24(3):651–659.
- Pearl SA, Bowers JE, Reyes-Chin-Wo S, et al. Genetic analysis of safflower domestication. BMC Plant Biol. 2014; 14:43
- Chahal GS, Gosal SS. Principles and procedures of plant breeding: biotechnological and conventional approaches. New Delhi: Narosa, 2002.