
Abstract
The genetic and flower volatile diversity of 59 plants from two natural populations of Hyssopus officinalis L. situated 73 km away from each other in typical growing regions for this species in Bulgaria were analysed. Analysis with 10 sequence related amplified polymorphism (SRAP) primer combinations scored a total of 1045 peaks of which 88.7% were polymorphic. Principal Coordinate Analysis (PCoA) and unweighted pair group method with arithmetic mean (UPGMA) clustering revealed clear grouping of samples based on their population origin. However, analysis of the genetic differentiation revealed that the two populations (Godech and Izvor) are genetically similar as shown by the low Fst and Gst values as well as by the low Nei’s genetic distance and high gene flow (Nm). Gas chromatography–mass spectrometry (GC-MS) analysis of flower extracts from the same individual plants that were used in the genetic diversity analysis identified 32 compounds. Principal Component Analysis (PCA) based on compound abundances revealed two major clusters of samples which did not correspond to their population origin. In depth analysis of the compound abundances showed large variation between the two identified clusters including complete presence/absence of major compounds and the existence of two distinct chemotypes corresponding to the identified clusters. Our results indicate that future efforts towards development of genetic resource collections as well as transition towards field cultivation of this species in Bulgaria should take into account the presence of the two identified chemotypes in natural populations and the factors (both genetic and epigenetic) which determine their existence.
Introduction
Hyssopus officinalis L. or simply known as hyssop is a traditional medicinal plant belonging to the Lamiaceae family which has been used for centuries in traditional medicine due to its antiseptic, cough relief and mucoactive properties [Citation1]. A number of studies have investigated the pharmacological properties of different extracts and essential oils from H. officinalis including antioxidant, anticonvulsant, antifungal, antimicrobial, antihemolytic, antiulcer, antispasmodic among others [Citation2]. The composition of the essential oil and extracts from different parts of the plant have also been studied and reported [Citation3].
In recent years, Bulgaria has become the largest exporter of herbs in Europe according to Eurostat (https://ec.europa.eu/eurostat). More than 80% of the herbs produced in the country are exported abroad and only a small part is used for local production of essential oils and extracts [Citation4]. The majority of fresh herbs (75–80%) are obtained directly from natural populations [Citation5], which, on the one hand, poses a direct negative impact on the ecosystems and, on the other hand, raises the question of the uniformity of the obtained material due to intra- and inter-population variation. A logical step in overcoming the problem is the transition from gathering herbs from wild populations to field cultivation of selected lines and further development of superior cultivars. This process first requires evaluation of the genetic and metabolite diversity in natural populations of herbs and development of genetic resource collections representing the natural diversity.
The main regions where natural populations of H. officinalis have been discovered in Bulgaria include the west and south-west part of the country [Citation6]. In the present study, we analysed both the genetic and flower volatile diversity in two natural populations of H. officinalis in Bulgaria located near the town of Godech (west Bulgaria) and near the village of Izvor (south-west Bulgaria) and situated 73 km from each other. We applied sequence related amplified polymorphism (SRAP) markers and gas chromatography–mass spectrometry (GC-MS) analysis of flower extracts from individual hyssop plants.
Materials and methods
Plant material collection
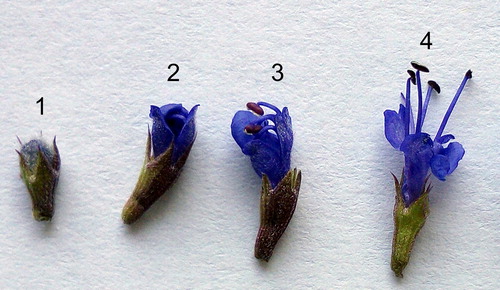
Hyssopus officinalis L. plant material was collected from two natural populations in Bulgaria located near the town of Godech (42°58'04.4"N 23°08'53.4"E) and near the village of Izvor (42°21'31.8"N 22°49'19.3"E). Plant leaf material from 28 plants with fully developed inflorescences from population “Godech” as well as 31 plants from population “Izvor” was collected in plastic containers and immediately frozen in liquid nitrogen. The frozen material was stored at −80 °C until genomic DNA was extracted. Extraction of flower volatiles from individual hyssop plants was carried out following a slight modification of our recently developed procedure for lavender [Citation7]. Twenty fully developed flowers (stage 4, ) from the inflorescences of the same plants that were used for plant leaf material collection were collected with sharp tweezers without pressing the calyx and transferred to 20 mL headspace vial followed by addition of 2 mL ethyl acetate (Sigma) and closed with a cap using a crimp. All flower samples were collected in three biological replications. The tightly closed vials were stored at 4 °C for 24 to 120 h prior to removal of residual water with anhydrous sodium sulphate and proceeding for GC/MS analysis.
Figure 1. Developmental stages of Hyssopus officinalis L. single flowers.
Analysis with SRAP markers
Plant leaf material was ground to powder using TissueLyser laboratory mill (Qiagen). Genomic DNA was extracted from 100 mg of ground material using a modified CTAB protocol by Murray and Thompson [Citation8]. Polymerase chain reactions (PCR) were performed with 50 ng of genomic DNA, 10 pmol of each Fw and Rev primer, 2x MyTaq™ HS Mix (Bioline) in a total volume of 25 µL. The primer sequences according to Li and Quiros [Citation9] are shown in . Each forward primer was labelled with FAM. The conditions for PCR performed on a Quanta Biotech QB-96 were the following: initial denaturation for 4 min at 94 °C, 3 cycles of 94 °C for 1 min, 35 °C for 1 min and 72 °C for 1 min, followed by 35 cycles of 94 °C for 1 min, 50 °C for 1 min and 72 °C for 1 min, and final elongation at 72 °C for 1 min. DNA fragments were analysed on an Applied Biosystems 3130 Genetic Analyzer (Thermo) using 36-cm long capillaries (Thermo), POP 7 polymer (Thermo) and LIZ500 (Thermo) as a size standard. Fragment sizing was performed using the GeneMapper 4.0 software (Thermo).
Table 1. Nucleotide sequences of forward and reverse primers used for PCR amplification of SRAP markers.
GC/MS analysis of flower extracts from individual plants
All GC/MS analyses were carried out on an Agilent 7890 A/5975C GC/MS system. The compounds were separated using an Agilent HP-5MS non-polar column utilising (5%-phenyl)-methylpolysiloxane as a stationary phase with helium 5.0 (purity 99.999 vol.%) as a carrier gas at a septum purge flow of 3 mL/min, injection of 1 µL of sample using a split of 1:5 and the following acquisition parameters: injector temperature 250 °C. Oven program: 40 °C for 3 min then 5 °C/min to 300 °C, hold for 5 min at 300 °C, Run Time 60 min. The 5975 C mass-selective detector was operated at a transfer line temperature of 280 °C, electron impact ionisation voltage of 70 eV and vacuum of 1.5 × 10⁻³ Pa. Peak areas were calculated based on MSD ChemStation (Agilent). Normal alkanes C10–C40 (Sigma) were used for RI calculation using AMDIS ver. 2.71 (National Institute of Standards and Technology (NIST), USA). Compounds identification was carried out based on comparison of their mass spectrum and RI data with the NIST 2008 Mass spectral library (National Institute of Standards and Technology (NIST), USA) the Robert Adams library [Citation10] and literature data.
Statistical analysis of experimental data
GeneAlex 6.5 [Citation11,Citation12] was used for performing analysis of molecular variance (AMOVA) and Principal Coordinate Analysis (PCoA). FAMD 1.31 [Citation13] was used to build a UPGMA (unweighted pair group method with arithmetic mean) dendrogram based on Jaccard indices. The online tool GDdom [Citation14] was used to calculate gene diversity/polymorphic information content (PIC) per each marker (primer pair) applying the formula by Roldan-Ruiz et al. [Citation15]. AFLP-surv [Citation16] was used for calculation of the pairwise fixation index Fst. Shannon’s information index (i), geneflow (Nm), Gst, Nei’s gene diversity (h), Nei’s genetic distance and identity were calculated using Popgene [Citation17]. Structure v 2.3.4 was used for analysis of the genetic structure where the method by Evanno et al. was used to estimate the most probable K [Citation18,Citation19]. The Mass Profiler Professional module of GeneSpring 14.9.1 (Agilent Technologies) was used to perform Principal Component Analysis (PCA) and analysis of variance (ANOVA) on GC/MS data. IBM SPSS Statistics 25 was used to perform ANOVA on SRAP marker data. MS Excel 2019 was used to build box and whiskers plots.
Results and discussion
Genetic diversity analysed by SRAP markers
We studied the genetic diversity among 59 H. officinalis plants from two natural populations in Bulgaria located at a distance of 73 km from each other applying SRAP markers. One hundred combinations of SRAP primer sequences according to Li & Quiros 2001 [Citation9] were initially tested for their ability to produce high quality fragment patterns. Eight SRAP primer combinations were selected based on the high number of amplified fragments and the visual clarity of the obtained electrophoregrams (). A total of 1045 peaks/bands with a size between 50 and 950 bp were produced of which 88.7% (927) were polymorphic. The percentage of polymorphic loci per population was higher in population Izvor (80.26%) compared to population Godech (70.12%) (). The average gene diversity (GD)/polymorphic information content (PIC) per SRAP marker/primer pair ranged from 0.1544 to 0.1869 with an average of 0.1659 (), which were comparable to other studies including application of AFLP markers in Salvia species [Citation22], but were lower compared to SRAP markers applied in Ocimum species [Citation23]. The estimated mean gene diversity “h” as well as Shannon’s information index were slightly but significantly higher (p ≤ 0.01) in population Izvor compared to population Godech (). shows the distribution of the data for Nei’s gene diversity index and Shannon’s index among the plants from both populations. As can be seen from , due to the higher number of monomorphic bands, a higher number of plants scoring values close to 0 for both indices were observed in population Godech as visualised by the lower position of the median.
Figure 2. Distribution of data for Nei’s gene diversity index (a) and Shannon’s index (b) among plants from the two analysed populations, Godech and Izvor.
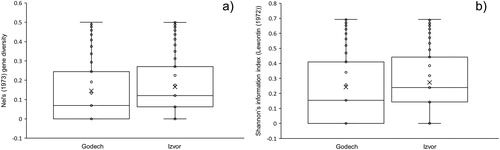
Table 2. Average gene diversity (GD)/polymorphic information content (PIC) for each SRAP marker/primer pair as well as range of variation per the average gene diversity for all SRAP markers.
Table 3. Genetic variation within the two analysed populations.
shows the PCoA based on a distance matrix produced by Genealex. As seen from , the samples were clearly separated into two distinct clusters corresponding to the two populations from which they originate. Similar results were obtained applying UPGMA clustering of Jaccard indices, where again two major clusters formed largely corresponding to the two analysed populations (). Analysis of the genetic structure of the two populations further confirmed the existence of two separate clusters () with delta K maximising at K = 2 ().
Figure 3. Principal Coordinates Analysis (PCoA) (a) and UPGMA clustering of Jaccard indices (b) of samples from the two analysed populations. Blue diamonds indicate samples from population Godech; red squares indicate samples from population Izvor. Ellipses and semicircles marked with 1 and 2 indicate clusters of samples belonging to population Godech and Izvor, respectively.
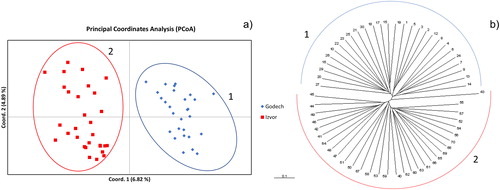
Figure 4. Genetic structure of two Hyssopus officinalis L. populations based on SRAP marker data. (a) Estimation of the most probable K using the delta K method by Evano et al. [Citation19]. (b) Bar plot representing the genetic structure at K = 2 for populations Godech and Izvor.
![Figure 4. Genetic structure of two Hyssopus officinalis L. populations based on SRAP marker data. (a) Estimation of the most probable K using the delta K method by Evano et al. [Citation19]. (b) Bar plot representing the genetic structure at K = 2 for populations Godech and Izvor.](/cms/asset/32875f06-2d5b-4468-bb6d-3d9d1ea39763/tbeq_a_1835537_f0004_c.jpg)
Although the performed clustering analyses showed that the samples were clustered corresponding to their population origin, analysis of the genetic differentiation revealed that the two populations are genetically closely related as revealed by the low values of Fst, Gst and Nei’s genetic distance as well as the high value of genetic identity (). The same was also apparent from the very high estimated value of gene flow (). Further analysis of molecular variance (AMOVA) showed that only 9% of the total variation was due to variation among the population, while 91% was due to within population variation ().
Table 4. Genetic differentiation between the two analysed populations.
Table 5. Summary AMOVA table based on analysis of two natural H. officinalis populations in Bulgaria.
The overall results from the genetic diversity analysis in the present study showed that the two analysed populations, although separated by a significant distance of 73 km, are genetically closely related, which could be an indication of their origin from common ancestors.
Recently, we also used SRAP markers for assessment of the diversity in lavender varieties, where SRAP markers proved to be a powerful and affordable tool for analysis of genetic diversity [Citation24]. The results from the present study show again that SRAP markers are a successful strategy for analysis of the genetic diversity especially in species where other highly polymorphic markers like SSR markers have not yet been developed.
Volatile diversity in flowers from individual hyssop plants
The international standard for essential oil from H. officinalis L. (ISO 9841:2007) sets the limits for 13 terpenoid compounds which are present in the oil from this species [Citation25]. In the present study, a total of 32 compounds were identified in the extracts from single flowers obtained from the same plants that were used for the analysis of the genetic diversity from the two analysed populations (). Of these 32 compounds, 9 are part of the ISO standard for essential oil from H. officinalis [Citation25]. Large variations in the amounts of the identified compounds were observed in each of the two populations (). ANOVA analysis showed that only 6 compounds varied statistically significantly between the two populations including cis-ocimene, caryophyllene, β-copaene, α-humulene, hexacosane and octacosane. Of the six compounds only cis-ocimene was above 1% with average amounts of 11.56% in population Godech and 14.37% in population Izvor. However, the span of variation of this compound in population Izvor effectively overlapped that of population Godech.
Table 6. Mean percentage and range of variation for all identified compounds in the two analysed populations and the two identified metabolite clusters as seen in . Compounds shown in bold are part of ISO 9841:2007[23].
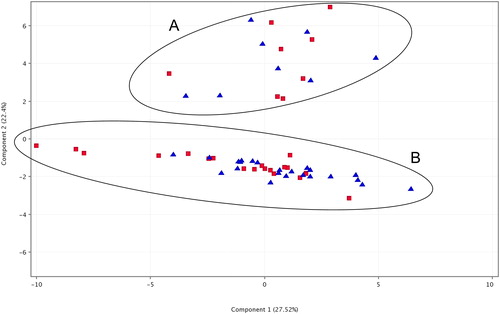
The performed Principal Component Analysis (PCA) based on the data of compound abundances did not show clustering of samples based on their population origin (). The majority of samples were grouped in a major cluster designated as “B” in , containing almost an equal number of samples from both populations. A second cluster designated as “A” in consisting of 16 samples was separated from the major cluster “B” and consisted of an equal number of samples from both populations. ANOVA showed that 10 compounds varied statistically significantly between cluster A and cluster B. Of the 10 compounds, 6 were with amounts over 1% in the samples. Moreover, several major compounds in one of the clusters were either not detected or were only minor compounds in samples from the other cluster. For example, the average amount of iso-pinocamphone was 23.72% in the cluster A samples but was only 0.04% in the samples from cluster B, making it the most abundant compound in the samples from Cluster A. Eucalyptol, which was the most abundant compound in the Cluster B samples with an average of 44.44%, was almost half that amount in the cluster A samples (21.29%), although the cluster A samples also showed high deviation for this compound.
Figure 5. Principal Component Analysis (PCA) of samples from the two analysed populations based on GC/MS data for compound abundances. Red squares indicate samples from population Godech; blue triangles indicate samples from population Izvor. The two ellipses marked with A and B indicate the observed two clusters corresponding to the two different chemotypes.
A number of studies have analysed the composition of the essential oil obtained from H. officinalis and the composition reported by different authors varies in a large range. For example, Zawislak [Citation26] did not detect any amounts of eucalyptol (1,8-cineole) in the essential oil from H. officinalis plants grown in south-eastern Poland in two consecutive years, although the author identified 99.9% of the compounds in the samples. Similarly, no eucalyptol was reported in the composition of H. officinalis essential oil from Egypt by Said-Al Ahl et al. [Citation27] after identifying 99.99% of the compounds in the oil. At the same time Semerdjieva et al. [Citation28] identified eucalyptol as a major compound in the essential oil of H. officinalis accounting for 25–59% in the samples. Guardo et al. [Citation29] also reported eucalyptol as a major component of the H. officinalis essential oil accounting for 53% of its composition. The composition of the essential oil from H. officinalis could be influenced by a number of factors including climatic conditions and the application of different agronomic practices [Citation30], the use of different subspecies or genotypes as a biomass for essential oil distillation [Citation31] and even the application of different distillation conditions [Citation28]. The results from the present study showed that large variation of H. officinalis flower volatiles is observed at the level of single natural populations in Bulgaria. The obtained data revealed the existence of two distinct chemotypes in each of the two analysed populations separated geographically at a distance of 73 km from each other. Further studies are necessary in order to identify the factors which determine the existence of the observed different chemotypes as well as their seasonal dynamics during and year-to-year stability.
Conclusions
The results from the present study show that natural populations of H. officinalis in Bulgaria separated by a significant geographical distance may be genetically closely related. The discovered existence of two distinct chemotypes of H. officinalis in one and the same location indicates that direct harvesting of hyssop plants from natural populations may result in variations in the volatile composition of the final product depending on the ratio of the gathered plants belonging to different chemotypes. The development of genetic resource collections of H. officinalis in Bulgaria targeting future field cultivation of this medicinal plant should take into account the existence of different chemotypes in natural populations and the factors which determine their existence. Further studies are necessary in order to analyse the stability of the identified chemotypes, their dynamics throughout the season and the genetic/epigenetic factors which are responsible.
Acknowledgements
The authors would like to thank Rumyana Velcheva (technician at ABI) for the excellent technical assistance.
Disclosure statement
The authors report no conflict of interest
Additional information
Funding
References
- Javadi B, Sahebkar A, Emami SA. Medicinal plants for the treatment of asthma: A traditional Persian medicine perspective. Curr Pharm Des. 2017;23(11):1623–1632.
- Tahir M, Khushtar M, Fahad M, et al. Phytochemistry and pharmacological profile of traditionally used medicinal plant Hyssop (Hyssopus officinalis L.). JAPS. 2018;8(7):132–140.
- Fathiazad F, Hamedeyazdan S. A review on Hyssopus officinalis L.: Composition and biological activities. Afr J Pharm Pharmaco. 2011;5(17):1959–1966.
- Evstatieva L, Hardalova R, Stoyanova K. Medicinal plants in Bulgaria: diversity, legislation, conservation and trade. Phytol Balcan. 2007;13(3):415–427.
- Popova A, Mihaylova D. A review of the medicinal plants in Bulgaria – collection, storage, and extraction techniques. AJPCR. 2018;11(3):28–35.
- Cerneva Z. Distribution and ignificance of Hyssopus fficinalis (Labiatae) in Bulgaria. Bocconea. 1997;5(1):637–641.
- Zagorcheva T, Rusanov K, Stanev S, et al. A simple procedure for comparative GC-MS analysis of lavender (Lavandula angustifolia Mill.) flower volatile composition. J Pharm Biol Sci. 2016;11(4):9–14.
- Murray M, Thompson W. Rapid isolation of high molecular weight plant DNA. Nucleic Acids Res. 1980;8(19):4321–4326.
- Li G, Quiros CF. Sequence-related amplified polymorphism (SRAP), a new marker system based on a simple PCR reaction: its application to mapping and gene tagging in Brassica. Theor Appl Genet. 2001;103:455–461.
- Adams RP. Identification of essential oil components by gas chromatography/mass spectrometry. Carol Stream, Ill: Allured Publishing Corporation; 2007.
- Peakall R, Smouse PE. GenAlEx 6.5: genetic analysis in Excel. Population genetic software for teaching and research-an update. Bioinformatics. 2012;28(19):2537–2539.
- Peakall R, Smouse PE. GENALEX 6: genetic analysis in Excel. Population genetic software for teaching and research. Mol Ecol Notes. 2006;6(1):288–295.
- Schluter PM, Harris SA. Analysis of multilocus fingerprinting data sets containing missing data. Mol Ecol Notes. 2006;6(2):569–572.
- Abuzayed M, El-Dabba N, Frary A, et al. GDdom: An online tool for calculation of dominant marker gene diversity. Biochem Genet. 2017;55(2):155–157.
- Roldan-Ruiz I, Dendauw J, Van Bockstaele E, et al. AFLP markers reveal high polymorphic rates in ryegrasses (Lolium spp.). Mol Breeding. 2000;6(2):125–134.
- Vekemans X, Beauwens T, Lemaire M, et al. Data from amplified fragment length polymorphism (AFLP) markers show indication of size homoplasy and of a relationship between degree of homoplasy and fragment size. Mol Ecol. 2002;11(1):139–151.
- Yeh FC, Boyle TJB. Population genetic analysis of co-dominant and dominant markers and quantitative traits. Belgian J Botany. 1997;129:157.
- Pritchard JK, Stephens M, Donnelly P. Inference of population structure using multilocus genotype data. Genetics. 2000;155(2):945–959.
- Evanno G, Regnaut S, Goudet J. Detecting the number of clusters of individuals using the software STRUCTURE: a simulation study. Mol Ecol. 2005;14(8):2611–2620.
- Nei M. Analysis of gene diversity in subdivided populations. Proc Natl Acad Sci U S A. 1973;70(12):3321–3323.
- Lewontin R. The apportionment of human diversity. Evol Biol. 1972;6:381–398.
- Blignaut M, Ellis AG, Le Roux JJ. Towards a transferable and cost-effective plant AFLP protocol. PLoS One. 2013;8(4):e61704.
- Chen S-Y, Dai T-X, Chang Y-T, et al. Genetic diversity among Ocimum species based on ISSR, RAPD and SRAP markers. Australian J Crop Sci. 2013;7(10):1463–1471.
- Zagorcheva T, Stanev S, Rusanov K, et al. SRAP markers for genetic diversity assessment of lavender (Lavandula angustifolia Mill.) varieties and breeding lines. Biotechnol Biotechnol Equip. 2020;34(1):303–308.
- ISO_9841:2007. Oil of Hyssopus officinalis L. ssp. officinalis. 2nd ed. Geneva, Switzerland: International Organization for Standardization (ISO). 2007.
- Zawislak G. Essential oil composition of Hyssopus officinalis L. grown in Poland. J Essent Oil Bear Pl. 2016;19(3):699–705.
- Said-Al Ahl HAH, Abbas ZK, Sabra AS, et al. Essential oil composition of Hyssopus officinalis L. cultivated in Egypt. Int J Plant Res. 2015;1(2):49–53.
- Semerdjieva IB, Burducea M, Astatkie T, et al. Essential oil composition of Ruta graveolens L. fruits and Hyssopus officinalis subsp. aristatus (Godr.) Nyman biomass as a function of hydrodistillation time. Molecules. 2019;24(22):4047.
- Guardo NI, Sainz P, Gonzalez-Coloma A, et al. Trypanocidal effects of essential oils from selected medicinal plants. Synergy among the main components. Nat Prod Commun. 2017;12(5):709–712.
- Moro A, Zalacain A, de Mendoza JH, et al. Effects of agronomic practices on volatile composition of Hyssopus officinalis L. essential oils. Molecules. 2011;16(5):4131–4139.
- Baj T, Korona-Glowniak I, Kowalski R, et al. Chemical composition and microbiological evaluation of essential oil from Hyssopus officinalis L. with white and pink flowers. Open Chem. 2018;16(1):317–323.