
Abstract
A low-cost disposable lipase activity sensor was developed and characterized overcoming the main drawbacks of the already existing disposable ones: insufficient reproducibility to be applied for automatic lipase activity quantification and complicated and long manual analytical procedure performed by qualified personnel. The sensor is based on a capacitor formation on an electrode surface by a substrate layer deposition possessing high electrical resistivity and dielectric constant (composite of olive oil mixed with BaTiO3 nanoparticles) serving as both: sensor sensitive layer and capacitor dielectric. Its decomposition by lipase catalyzed hydrolysis causes its thickness decrease resulting in capacitance increase proportional to the lipase activity. The sensor was characterized in terms of limit of quantification, linear quantification range, sensitivity, response time, precision, repeatability, storage time and the results are presented and discussed. The validation experiment showed excellent agreement with the standardized titrimetric method.
Introduction
The lipases (E.C. 3.1.1.3, triacylglycerol acylhydrolase, part of the hydrolases enzymes group) catalyzing the cleavage of the lipids ester bonds, find a wide and expanding application in many industrial biotechnological processes related to production of food, textile, leather, biodiesel, etc. [Citation1]. The maintenance of the enzymatic processes efficiency requires enzyme activity monitoring and correction, which defines the need to apply simple, precise and economical sensors for real-time lipase activity quantification, compatible with the industrial automation systems.
The advantages, the limitations and the drawbacks of the great variety of the existing lipase activity sensors developed so far are discussed in the reviews presented by Jensen [Citation2], Thomson et al. [Citation3], Beisson et al. [Citation4], Gupta et al. [Citation5], Starodub [Citation6], Hasan et al. [Citation7], Stoytcheva et al. [Citation8], Sandoval [Citation9], Pohanka [Citation10]. Almost all of them are based on the enzymatic degradation of a specific lipase’s substrate deposited as a sensitive layer coupled with a transducer employing measuring technique such as: UV-VIS or IR spectrophotometry, turbidimetry and nephelometry, quartz crystal microbalance, conductometry, chromatography, etc. [Citation11–21]. The main common drawbacks of the existing lipase activity sensors, in addition to their high cost are: long response time and complicated analytical procedures requiring qualified personnel, not allowing their application in automated industrial processes control.
Being degradable, the sensor sensitive layer changes its thickness and surface regularity in contact with the lipase during the measurement. As a result, the sensor characteristics changes and it cannot provide reliable and reproducible response any more, if used again. Thus, the continuous precise monitoring of the lipase activity can be achieved by the employment of a series of disposable sensors only possessing however equal metrological characteristics attributed to the same calibration plot. The reliable industrially applicable lipase activity sensor must meet also requirements such as: characteristics stability during a long storage time (suitable sensitive layer composition, physical state and structure), sensitivity and precision adequate to the analytical task, short response time, simple and low-cost construction, and ability for automatic application.
The approach proposed by the authors earlier [Citation22,Citation23]: a lipase substrate sensitive layer deposited on an electrode surface combined with the registration of some electrical parameters as sensor response seems to be promising to develop a sensor meeting all the mentioned requirements. This approach was already realized twice by the development of two simple sensors: conductometric and impedimetric [Citation22,Citation23] employing the same type of sensitive layer (olive oil as a specific lipase substrate mixed with SiO2 high resistivity nanoparticles). The sensitive layer active resistance was registered as sensor response in the first case, while the impedance (the total resistance including the sum of the active, capacitive, and inductive resistance at fixed frequency) was registered in the second one. The nanoparticles presence in the sensitive layer increases much its active and reactive resistance, due to the SiO2 high resistivity and dielectric constant. As a result, the nanoparticles release during the sensitive layer enzymatic degradation causes sensor response amplification (sensor sensitivity augmentation). However, the nanoparticles percentage is very limited, because a high percentage caused mechanical instability of the sensitive layer resulting in low reproducibility of the sensor response.
The irregular thickness of the sensitive layer (resulting from the applied deposition procedure: drop coating) combined with the irregular degradation of the sensitive layer during the measurement [Citation24] is the second reason causing insufficient reproducibility of the sensor response not allowing its application automatically. This deposition technique has been chosen because it allows deposition of thin layers. Thus, to overcome the reproducibility problem, preliminary measurements of the initial resistance or impedance of each sensor had to be done in buffer solution in the absence of lipase, followed by sensors sorting in groups possessing same/similar characteristics. In spite of the satisfactory sensitivity and response time, the mentioned drawbacks made it complicated and difficult to apply the two sensors in the automated biotechnological processes control.
The successful application of the mentioned approach in the development of a reliable and reproducible disposable sensor applicable automatically requires: (1) the development of a long lasting and mechanically stable lipase substrate composite able to be deposited precisely and reproducibly on the electrode surface as a sensitive layer applying a simple deposition procedure; (2) sensor response registration by the application of a simple measuring technique.
The aim of this work is the development of a simple and low cost, reproducible and precise disposable lipase activity sensor suitable for automatic industrial application and evaluation of its characteristics in respect to: limit of quantification, linear quantification range, sensitivity, reproducibility, precision, and response time registering the capacitance as a sensor response.
Materials and methods
Theoretical and general considerations
As known, the capacitance C of a flat capacitor is determined by the plates surface area S in contact with the dielectric layer, its thickness d and permittivity (dielectric constant) ε, according to the equation: C = εS/d (Equation (1)) well known in physics. According to the approach proposed by the authors earlier and mentioned above [Citation22], if a layer of a lipase substrate possessing high electrical resistivity is deposited on an electrode surface, a flat capacitor is formed when put the modified electrode in contact with a high conductivity solution (such as a buffer one for maximal enzyme activity) serving as a second capacitor plate. The substrate layer serves as a capacitor’s dielectric one between the two plates, the solid (metallic) plate and the liquid one.
When the solution contains lipase, then the substrate hydrolysis catalyzed by the enzyme will cause dielectric layer thickness d decrease resulting in corresponding capacitance C increase. This can be applied to build a capacitive lipase activity sensor meeting the requirements mentioned above, if appropriate composite could be developed to serve as a sensitive/dielectric layer possessing a high dielectric constant, excellent dimension, reproducibility, and long-term stability combined with the capacitance registration as sensor response.
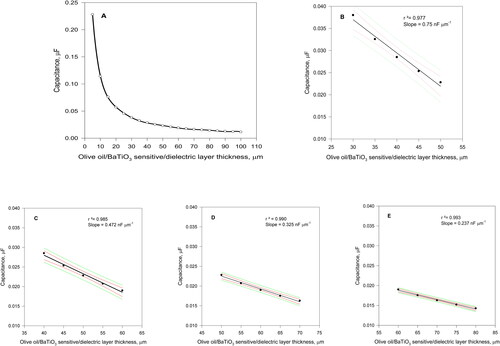
The flat capacitors capacitance however is not a linear, but a hyperbolic function of the dielectric (sensitive) layer thickness d according to the Equation (1), which is graphically presented in . Nevertheless, the Equation (1) curve can be approximated to various shorter straight lines providing the required results precision within a certain thickness range of the sensitive/dielectric layer (). The theoretical increase in capacitance caused by 20 μm decrease in the sensitive/dielectric layer was calculated for 50, 60, 70 and 80 μm initial layer thicknesses, respectively, taking into consideration the following data: the dielectric constant ε of the nanocomposite (olive oil to BaTiO3 weight ratio = 1:1, see the text bellow) was considered to be 0.82 × 10³ ε0=0.82 × 103 ×8.85 × 10−12=7.26 × 10⁻⁹ F m−1= 7.26 nF m−1 [Citation25–27], the half of the pure BaTiO3 one and surface areas of the capacitor plates on both sides of the sensors = 157 × 10−6 m2. Thus, the maximal lipase activity causing 20 μm thickness decrease of the degradable sensitive layer can be evaluated precisely as seen from regression coefficients. As presented there, high sensitivity but low precision can be achieved by thin sensitive/dielectric layer employment (), while higher precision but lower sensitivity can be obtained by thick sensitive/dielectric layer application (). For example, the sensor sensitivity obtained with 80 μm thick layer is about 3 times lower than that obtained with 50 μm thick one.
Figure 1. Curve A: Theoretical graphic presentation of Equation (1) for composite thicknesses range from 5 to 100 µm; Curves B - E: Equation (1) applied for 20-µm thick dielectric starting from 50 µm initial nanocomposite thicknesses up to 80 µm, together with the 95% confidence and prediction intervals (red and green lines respectively).
The main requirement for a lipase activity sensor to be applied automatically is the formation of highly reproducible sensitive layers on the disposable sensors allowing all of them to possess equal metrological characteristics. Because the drop coating technique is problematic to apply as mentioned above, another simpler and much more precise and reproducible procedure must be found, and the screen-printing method seems to be the adequate one. This procedure requires dense, semi-liquid materials, and it is suitable for deposition of relatively thick layers, which will cause loss of sensor sensitivity (see Equation (1)). According to this equation, the effect of the increased dielectric layer thickness d can be compensated by the application of a material possessing a high dielectric constant ε. This can be achieved by mixing of a specific lipase's substrate such as olive oil, triolein, stearin, etc. with some substance possessing high electrical resistivity and extremely high dielectric constant ε such as BaTiO3, providing ε as high as 1.64 × 10³ at 1 KHz [Citation25–27]. Moreover, the mix of olive oil with BaTiO3 is a creamy like composite able to be deposited precisely by a screen-printing procedure forming a thick, but reproducible high dielectric constant sensitive/dielectric layer.
Experimental design
Reagents and materials
Lipase from Sigma possessing enzymatic activity of 25.1 U.S.P. U. mg−1 was dissolved in phosphate buffer with pH 8 for a stock lipase solution preparation. This pH value was recommended by the enzyme producer for maximal lipase enzymatic activity achievement. The buffer was prepared by dissolution of appropriate amounts of analytical grades K2HPO4 and KH2PO4 in deionized water. The stock solution was distributed in many 1 mL Eppendorf tubes stored in a freezer, using one tube per experimental day. The lipase solutions used for sensor characterization were prepared by addition of small (microliter) volumes of the stock solution directly to the measuring cell containing a buffer solution.
Instrumentation
The capacitance C versus time curves were registered employing Model CompactStat.h 20250, Ivium Technologies, Netherlands running IviumSoft software in all the sensor characterization experiments performed in a home-made 5 mL stainless steel measuring cell. A Handheld Capacitance Meter model Keysight U1701A/B coupled Graphical User Interface (GUI) Data Logger software was used in some of the real sample experiments employing the same measuring cell.
Lipase substrate and sensitive layer composite preparation
The olive oil possesses a high specificity to the lipase allowing its employment for sensor’s sensitive layer composite preparation. Also, it contains up to 30% triolein, a very specific lipase substrate [Citation17]. Its resistivity of about 109 Ω m and its relative dielectric constant of 3.1 [Citation28,Citation29] make it suitable to serve as a capacitor dielectric and sensor sensitive layer in lipase activity assays. The addition of some material possessing high dielectric constant (such as BaTiO3 [Citation25–Citation27]) to the olive oil will strongly increase the dielectric constant of the resulting composite.
The olive oil/BaTiO3 composite was prepared by mixing a commercial extra virgin olive oil with cubic BaTiO3 nanoparticles sized 100 nm (US Research Nanomaterials, Inc., Houston TX, USA) in weight proportion 1:1 and stirring manually till a creamlike mixture was obtained. It possesses excellent long-term stability (more than 1 year) at room temperature stored in closed containers preventing from dust. Its semi-liquid (creamlike) physical state was very suitable for application by screen printing. The composite surface was observed by optical microscope only because its high electrical resistance does not allow characterization by scanning electron microscopy (SEM). The application of smooth screen-printing squeegees produced very smooth composite layer surfaces, which is very important for the reproducibility of the sensor characteristics.
Sensor construction and electrode modification procedure
Disposable sensors were prepared using printed circuit board (PCB) sticks made by FR-4 epoxy impregnated woven fibreglass cloth, 0.8 mm thick, 1.5 cm wide and 4 cm long, laminated by 35 μm thick copper foil on both sides (). FR-4 is the most common and economic material industrially applied for PCB production. The copper layer on both sides of the stick was partly covered by standard epoxy soldering mask commonly applied for electrical insulation in the industrial PCB production. Circles with a diameter of 1 cm located at both sides of the lower end of the stick serving together as one of the capacitor plates and the last 8 mm of the upper end of the stick (on both sides) serving as sensor electrical terminals were left uncovered (see ).
Figure 2. PCB sensor stick construction: 1, epoxy impregnated woven fiberglass cloth; 2, copper layers; 3, epoxy soldering mask serving as insulator and stencil for sensitive layer deposition; 4, sensitive layer having diameter of 1 cm and the thickness of the soldering mask.
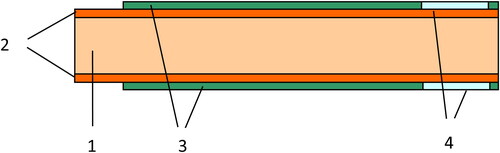
The sensitive/dielectric layer was deposited by screen printing using the soldering mask as a stencil. As the soldering mask deposited industrially possesses very precise thickness, as a result very reproducible sensitive layers were achieved in respect of the thickness, resulting in high reproducibility of the sensor response. Thus, the use of soldering masks possessing different thicknesses allows the production of sensors with controlled sensitivity, reproducibility, and linear quantification range in accordance with the analytical task, because the sensitivity layer initial thickness determines these parameters (see ).
Automated measurements setup and procedure
The disposable types of sensors (almost all of the known lipase activity sensors) can be applied automatically only if the metrological characteristics of each of the produced sensors are identical allowing the employment of the same calibration plot. The main goal of the present work is the development of lipase activity sensor possessing high reproducibility. The automatic application of a disposable sensor requires a simple mechanism to change the disposable sticks and two pumps to manage the samples and the rinsing water.
An example of disposable sensors change is the following: 50 sticks are fixed at a 2-cm distance from one another on a flexible, electrically conductive tape rolled up on a spool. The spools must be stored in a closed plastic container preventing dust contamination. A simple mechanism moves the tape forward rolling it on the second spool located at a 15-cm distance from the first. Below the tape, between the two spools was located a cylindrical measuring cell made by stainless steel fixed to an acrylic platform able to move it up to immerse the sensor into the sample and down to allow the tape movement and sensors change. A magnetic bar was located on the cell bottom while the small magnetic stirrer motor was mounted in the acrylic cell supporting platform. The measuring cell was filled, emptied, and washed by the aid of two peristaltic pumps. The metallic cell served as a contact with the liquid capacitor plate connected to one of the capacitance meter terminals, while the other terminal was connected to the conductive metallic tape carrying the sensor sticks.
The automated measuring procedure includes the following steps: (1) Moving down the measuring cell and rinsing it; (2) Moving the sensor-carrying tape one step ahead fixing the next sensor stick above the cell center and moving up the cell; (3) Buffer solution addition (2.5 mL) to the cell; (4) Magnetic stirrer activation and first capacitance reading 40 s after (average of 8 readings during 4 s); (5) Lipase sample addition (2.5 mL) to the cell already containing the buffer solution; (6) Waiting for 90 s for the plateau establishment on the capacitance-time curve and second capacitance reading (average of 8 readings during 4 s); (7) Calculation of the difference between the two averaged measurements results;(8) Calculation of the lipase activity employing the preliminary build calibration plot; (9) Emptying and rinsing the measuring cell. The manual sensors application procedure included the same steps, except the automatic sensor sticks change.
Results and discussion
Typical sensor response: capacitance-time curves
Typical sensor responses registered in coordinates capacitance vs. time are presented in after subtraction of the background (initial capacitance). Two lipase samples possessing different activities were employed. The lipase presence provokes degradation of the sensitive/dielectric layer by hydrolysis resulting in its decrease in thickness and corresponding increase in capacitance according to Equation (1). The lipase’s active site saturation occurring in the course of the hydrolysis reaction causes a gradual decrease in its rate resulting in a plateau appearance.
Figure 3. Typical sensor responses registered by two disposable sensors in phosphate buffer with pH 8 at room temperature under 200 rpm stirring. Sensitive layer: 60 μm thick composite olive oil/BaTiO3 (1:1 weight ratio). Curve A: 1.5 U.S.P. U mL−1; curve B: 3 U.S.P. U mL−1.
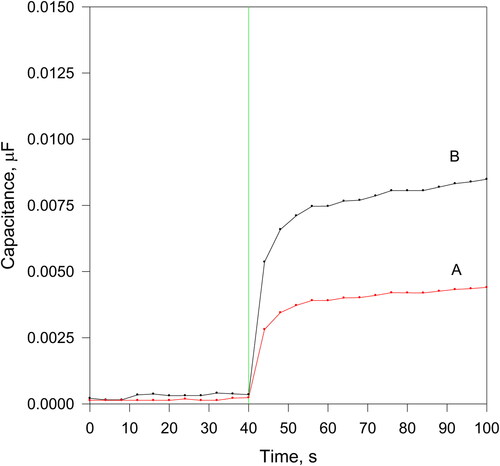
As presented in , two curve parameters depend on the lipase activity: the slope of the rising part of the curve (immediately after the lipase sample addition) and the wave height. Both parameters can be employed to evaluate the lipase activity based on a pre-built calibration plot. The curve slope allows instant lipase activity evaluation, but the precision depends on the data acquisition rate, which must be very high to allow precise slope calculation. However, more precise results can be achieved employing the wave height as an output parameter using the difference between the averages of 8 or more readings taken before and 90 s after the sample addition. It is difficult to apply averaging in slope determination, because of the rapid signal changes.
Determination of the sensor's initial capacitance reproducibility
All the sensor characteristics depend on the sensor initial capacitance as discussed in the Theoretical section of this work. According to Equation (1), it depends on the sensitive layer composition (ε) and its dimensions (S and d, all of which unfortunately are subject to errors and fluctuations during the sensitive layer preparation and deposition. That is why the initial capacitance reproducibility was the first parameter evaluated experimentally, because of its importance. After comparison of data presented graphically in , sensitive/dielectric layer (olive oil/BaTiO3 composite in weight ratio 1:1) possessing 60 μm thickness was chosen to be employed in all the experiments, providing a good compromise between sensitivity and precision ().
The experiments performed by the application of series of 10 disposable sensors (the sensitive/dielectric layer of which was deposited by the screen-printing technique) were carried out in blank samples containing pH 8 phosphate buffer only under stirring with 200 rpm at room temperature. The experimental setup is presented in and the obtained results, in .
Figure 4. Experimental setup for the initial capacitance reproducibility determination: 1, PCB sensor stick; 2, measuring cell inlet/outlet connected to peristaltic pump; 3, magnetic stirrer drive; 4, magnetic stirrer bar; 5, stainless steel measuring cell of 5 mL; 6, capacitance meter.
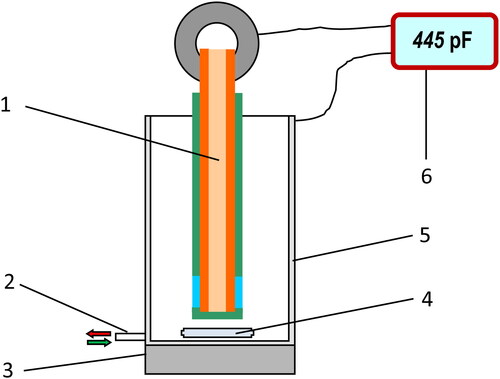
Table 1. Responses to a blank sample (pH 8, phosphate buffer) obtained by a series of 10 disposable sensors.
The standard deviation S calculated by the equation: S= [Σ (xi−x̄)2/(n − 1)]1/2 with: i = 1–10, employing the data presented in was 0.258. Then RSD was calculated as follows: RSD = 100×S/x̄=100 × 0.258/19.003 = 1.36%. The obtained RSD value proved the high reproducibility of the initial capacitance of the disposable sensors allowing their application directly in lipase activity monitoring without preliminary characterization and grouping. This result also proved the viability of the approach the sensor is based on: capacitor formation on the electrode surface by precise deposition of olive oil/BaTiO3 composite as a sensitive/dielectric layer and the capacitance registration as sensor response.
Linear quantification range and sensor sensitivity evaluation
The upper end of the linear quantification range (LQR) depends on the width of the linearized sensitive/dielectric thickness range (): a very high lipase activity may degrade more than the thickness belonging to this linearized range producing thus a lower precision result. In this work 20 μm width was chosen ensuring straight line regression of 0.985 at 60-μm thick sensitive/dielectric layer (). At this condition the upper end of the linear quantification range was found experimentally to be 3.9 U.S.P.U. mL−1 at 1.84% RSD determined by a series of 10 sensors. The sensitive layer irregular degradation [Citation24] together with the nonlinearity of the capacitance versus the sensitive/dielectric layer thickness curve cause precision decrease in case of higher activities determination.
A series of five artificial lipase samples each with decreasing activity were employed to determine the lower end of the linear quantification range possessing RSD less than 3%. In this case the sensitive/dielectric irregular degradation determined the results reproducibility, while the linearized thickness range influence might be neglected. This value experimentally was found to be 0.73 × 10⁻² U.S.P. U mL−1, determined with RSD of 2.94% calculated from three series of five samples each. The comparison with the linear quantification ranges of the conductometric and the impedimetric sensors mentioned above [Citation22,Citation23] showed that the one of the sensor subject of the present work is much wider, probably due to the increased thickness and the compact structure of the sensitive/dielectric layer.
The calibration plot can be described by the following equation: ΔC=SA+K, where ΔC is the sensor response (wave height) in nF; A is the lipase activity in U.S.P. U mL−1, K is a constant and S is the sensitivity in nF/U.S.P. U mL−1. This equation describes the linear part only of the S-shaped calibration plot which is characteristic of the enzymatic reactions.
Based on the data for the wave heights corresponding to the extreme two values of the LQR presented in together with their RSD, the calibration plot can be described by the equation: ΔC = 2.258 A + 0.293 with sensor sensitivity S = 2.258 nF/U.S.P. U mL−1.
Table 2. Sensor responses (wave heights) within the linear quantification range and their reproducibility.
Sensor response reproducibility determination
The sensor response reproducibility was evaluated for the two end points of the linear quantification range applying the procedure and the experimental setup described above. Three series of five sensors each were employed, one for the lower LQR end and the second for the upper LQR end. The corresponding RSD values calculated from the obtained results are presented in . As seen there, all the obtained RSD values exceed the blank sample ones, because the sensitive layer enzymatic degradation by the lipase does not occur gradually but irregularly [Citation24]. Some parts of the sensitive/dielectric layer become thinner, providing higher capacitance than others causing irregularity of the capacitance change during the hydrolysis process resulting in increased RSD, respectively.
Limit of detection determination
The limit of detection was determined applying the three sigma rule: obtaining a sensor response 3 times higher than the noise level. All the experiments were performed in phosphate buffer with pH 8 and 200 rpm stirring at room temperature. Disposable sensors possessing 60 μm thick composite sensitivity layer (olive oil/BaTiO3 in 1:1 weight ratio) were applied, one sensor for each lipase activity value. The curve corresponding to lipase activity of 0.57 × 10⁻² U.S.P. U mL−1, which was the limit of detection, is presented in .
Figure 5. Sensor response at limit of detection value of the lipase activity; experimental details in the text.
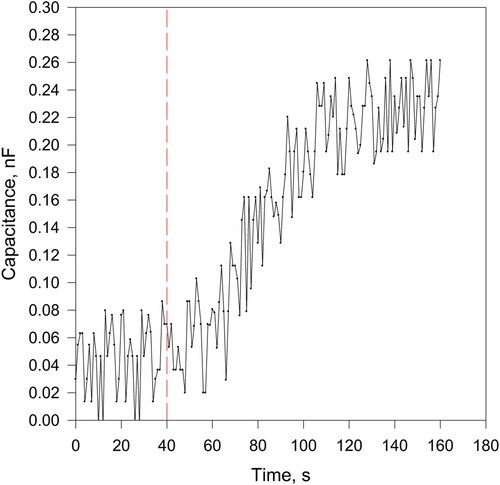
The random noise appearing in the curve has two origins: electrical and chemical. The electromagnetic fields generated from the electrical installation and the surrounding devices induce e.m.f. in the metallic electrodes, while the small irregularities in the sensitive/dielectric layer structure generate the chemical one. As seen in , the total noise level amplitude is about 0.18 nF, which ensures satisfactory quantification results in the entire LQR.
Response time evaluation
The sensor response time was evaluated by measuring the time from the addition of the lipase-containing sample up to the established plateau on the capacitance vs. time curve and the results are presented in .
Table 3. Sensor response time within the entire LQR.
The results corresponding to the entire linear quantification range obtained in phosphate buffer with pH 8, room temperature, 200 rpm stirring rate and 60 μm thick composite sensitive layer show that the response time increases with the lipase activity decrease. The rising part of the response curve begins immediately after the lipase sample addition in case of high lipase activity determination (), while a delay of about 15 s occurs at low activity (LOD), as presented in .
As commented above, the initial curve slope can be employed for sensor response determination within few seconds however if rapid data acquisition is applied. In the opposite case significant measurement errors may occur. That is why the plateau height measurement was preferred for both, the response time and the sensor response determination. The response times presented in are multiples of 10 for convenience, because the plateau is a long line.
Precision of determination and results validation
The standardized titrimetric method developed by Pinsirodom [Citation30] was applied as reference one to determine the sensor precision and validate the results. For this purpose, we prepared spiked samples using lipase-free industrial milk whey by addition of known small volumes of the bulk lipase solution (see Experimental section). Thus, samples with lipase activity belonging to the low, middle and upper part of the LQR were obtained. Each of them underwent three measurements using three different disposable sensors at the conditions applied for all the experiments mentioned above. The obtained results shown in were found to be satisfactory proving the sensor readiness to be applied in real industrial analysis.
Table 4. Results validation by a standard micrometric method.
Long-term storage effect
As mentioned above, 50 sticks (sensors) are fixed on a flexible, electrically conductive tape rolled up on a spool stored in a container (cartridge) ready to be used for automatic lipase activity determination in the industrial biotechnological processes. The achievement of reliable results requires stable sensor characteristics during the storage time up to the moment of its application.
To determine the long-term storage effect, four series of five sensors each were prepared and kept in a container at room temperature. Samples possessing the same lipase activity of 3 U.S.P. U mL−1 were measured and the averages of the obtained four series of results are shown in . Fresh lipase solution was prepared before each measurement (from the same flask containing solid state lipase kept in a freezer) to avoid lipase activity decrease along time. Sensors with 60 μm thick sensitive/dielectric layer were employed at the experimental conditions applied in all the experiments in this work mentioned above. As seen from , the maximal result relative deviation from the initial lipase activity value was 2.96% rel. after 1 year of sensors storage, proving the good long-term storage stability of the sensor.
Table 5. Long-term storage effect on the sensor response.
The simple sensor construction combined with the application of BaTiO3-based composite as sensitive layer deposited by screen printing results in excellent sensor reproducibility in a wider linear concentration range (from 0.73 × 10 −2 to 3.9 U.S.P.U. mL−1) versus 99 × 10−2 to 1.68 U.S.P. U mL−1 range and long-term stability in comparison with the one of the impedimetric sensor [Citation22] allowing its automatic industrial application.
Conclusions
A capacitive lipase activity sensor was developed and characterized in terms of linear quantification range, sensitivity, reproducibility, limit of quantification and precision, and the results were validated by comparison with a standardized titrimetric method applying spiked samples. The obtained sensor characteristics proved the viability of the approach the sensor is based on: capacitor formation on an electrode by precise and reproducible deposition of a sensitive/dielectric layer possessing high dielectric constant and high mechanical stability along time combined with capacitance registration as sensor response. The high reproducibility of the sensor surface area (RSD = 1.36%), the wide linear quantification range from 0.73 × 10⁻² to 3.9 U.S.P. U mL−1, response time from 70 to 140 s depending on the measured lipase activity, and validation recovery percentage not exceeding 3% made it suitable for automatic industrial application.
Acknowledgements
Dr. Roumen Zlatev gratefully acknowledges CONACyT-Mexico for supporting this investigation.
Disclosure statement
No potential conflict of interest was reported by the authors.
Data availability statement
Data that support the findings of this study are available from the corresponding author upon reasonable request.
Additional information
Funding
References
- Macrae AR, Hammond. Present RC. and Future applications of lipases. Biotechnol Gen Eng Rev. 1985;3(1):193–218.
- Jensen RJ. Detection and determination of lipase (acylglycerol hydrolase) activity from various sources. Lipids. 1983;18(9):650–657.
- Thomson CA, Delaquis PJ, Mazza G. Detection and measurement of microbial lipase activity: a review. Crit Rev Food Sci Nutr. 1999;39(2):165–187.
- Beisson F, Tiss A, Riviere C, et al. Methods for lipase detection and assay: a critical review. Eur J Lipid Sci Technol. 2000;102(2):133–153.
- Gupta R, Rathi P, Gupta N, et al. Lipase assays for conventional and molecular screening: an overview. Biotechnol Appl Biochem. 2003;37(Pt 1):63–71.
- Starodub NF. Biosensors for the evaluation of lipase activity. J Mol Catal B: Enzym. 2006;40(3–4):155–160.
- Hasan F, Shah A, Hameed A. Methods for detection and characterization of lipases: a comprehensive review. Biotechnol Adv. 2009;27(6):782–798.
- Stoytcheva M, Montero G, Zlatev R, et al. Analytical methods for lipases activity determination: a review. Curr Anal Chem. 2012;8(3):400–407.
- Sandoval G, Herrera-López EJ. Lipase, phospholipase, and esterase biosensors (Review). Methods Mol Biol. 2018; 1835:391–425.
- Pohanka M. Biosensors and bioassays based on lipases, principles and applications, a review. Molecules. 2019;24(3):616.
- Stoytcheva M, Zlatev R, Montero G, et al. Nanoparticles amplified QCM sensor for enzyme activity evaluation. IMRC2014-S2B-P001, 2015. Volume 1763 (Symposium 2B-Materials for Biosensor Applications).
- Stoytcheva M, Zlatev R, Cosnier S, et al. High sensitive trypsin activity evaluation applying a nanostructured QCM-sensor. Biosens Bioelectron. 2013;41:862–866.
- Jee JP, Nam SH, Park Y, et al. Simplified analysis of lipoprotein lipase activity: evaluation of lipasemic activity of low molecular weight heparin in rats. Arch Pharm Res. 2012; 3:1107–1114.
- Stoytcheva M, Zlatev R, Behar S, et al. A spectrophotometric lipase assay based on substrate-nanoparticle assembly degradation. Anal Methods. 2013;5(6):1370–1373.
- Pliego J, Mateos JC, Rodriguez J, et al. Monitoring lipase/esterase activity by stopped flow in a sequential injection analysis system using p-nitrophenyl butyrate. Sensors (Basel)). 2015;15(2):2798–2811.
- Thomas A. Fats and fatty oils. Ullmann’s encyclopedia of industrial chemistry. Weinheim, Germany: Wiley-VCH; 2000.
- Valincius G, Ignatjev I, Niaura G, et al. Electrochemical method for the detection of lipase activity. Anal Chem. 2005;77(8):2632–2636.
- M. Yousef W, Alenezi K, Naggar AH, et al. Potentiometric and conductometric studies on complexes of folic acid with some metal ions. Int J Electrochem Sci. 2017;12:1146–1156.
- Ballot C, Favre-Bonvin G, Wallach JM. Lipase assay in duodenal juice using a conductimetric method. Clin Chim Acta. 1984;143(2):109–114.
- Ballot C, Saizonou-Manika B, Mealet C, et al. Conductimetric measurements of enzyme activities. Anal Chim Acta. 1984;163:305–308.
- Ballot C, Favre-Bonvin G, Wallach JM. Conductimetric assay of a bacterial lipase using triacetin as a substrate. Anal Lett. 1982;15(13):1119–1129.
- Zlatev R, Stoytcheva M, Valdez B, et al. Simple impedimetric sensor for rapid lipase activity quantification. Talanta. 2019;203:161–167.
- Reyes AL, Zlatev1 R, Stoytcheva M, et al. Conductometric method for rapid lipase activity quantification. Int J Electrochem Sci. 2019;14:10508–10521.
- Arredondo M, Stoytcheva M, Morales-Reyes I, et al. AFM and MFM techniques for enzyme activity imaging and quantification. Biotechnol Biotechnol Equip. 2018;32(4):1065–1074.
- Praveena K, Rajaputra UMS, Sanyadanam S, et al. Effect of microwave sintering on grain size, dielectric properties of barium titanate. Turk J Phys. 2013;37:312–321.
- Ertuğ B. The overview of the electrical properties of barium titanate. Am J Eng Res. 2013;2:1–7.
- Uchino K. Chapter 11 – Multilayer technologies for piezoceramic materials. In: Advanced piezoelectric materials. 2nd ed. United Kingdom: Woodhead Publishing in Materials 2017. Elsevier; pp. 423–451, ISBN: 978-0-12-811180-2.
- Lakrari K, El Moudane M, Hassanain I, et al. Study of electrical properties of vegetable oils for the purpose of an application in electrical engineering. Afr J Food Sci. 2013;7(11):404–407.
- Paranjpe G, Deshpande P. Dielectric properties of some vegetable oils. Proc Indian Acad Sci (Math Sci).). 1935;1(12):880–886.
- Wrolstad RE, Acree TE, Decker EA, et al., editors. Handbook of food analytical chemistry, water, proteins, enzymes, lipids and carbohydrates. New Jersey: Wiley; 2005; Ch. C3, pp. 370–383.