
Abstract
Leptin and adiponectin secreted by the adipose tissue act in conjunction with thyroid hormones. The adiponectin/leptin ratio is a strong biomarker for cardio-metabolic health. The interrelations between the thyroid gland and adipokines are not yet clear. This study investigated whether anti-diabetic drugs, Metformin and Empagliflozin, lead to changes in leptin, adiponectin and their ratio in an animal model of hypothyroidism; and whether the animal model of hyperthyroidism results in changes in adiponectin and leptin levels. Forty-five male Wistar rats were randomly assigned into three groups for 8 weeks: group I (experimental hyperthyroidism), group II (experimental hypothyroidism) and group III (control). Hyperthyroidism was caused by Levothyroxine (300 μg/kg body weight), and hypothyroidism, by 10 mg/kg/day (1 mL/250 g) propylthiouracil in drinking water. Then, group I and II were subdivided into: Metformin treatment (350 mg/kg/per day), Empagliflozin treatment (10 mg/kg/d p.o) and a control group on a chow diet for another four weeks. The rats were sacrificed. Fasting plasma Thyroid Stimulating Hormone, fT3, fT4, leptin and adiponectin were measured by enzyme-linked immunosorbent assay. The adiponectin/leptin ratio was calculated. The results showed higher plasma TSH, fT4 in the hypothyroid group than in the hyperthyroid group. Hypothyroid rats had increased leptin and decreased adiponectin concentration, suggesting disturbed metabolic functions independent of body weight. Both, Metformin and Empagliflozin, reduced adiponectin and leptin levels in our model of hypothyroidism; however, the adiponectin/leptin ratio decreased. This animal model of hypo- and hyperthyroidism is an effective experimental setting to study adipokine hormone variations and pharmacological interventions.
Introduction
The thyroid gland plays an important role in energy homeostasis [Citation1]. Thyroid hormones are also crucial for the regulation of total energy consumption and body composition [Citation2] besides their roles in normal growth, development and reproduction. Studies have suggested a positive correlation between serum thyroid stimulating hormone (TSH) levels and body mass index (BMI) as thyroid dysfunction is associated with weight changes [Citation3,Citation4]. Serum TSH and free triiodothyronine levels are higher in obese patients [Citation3]. Furthermore, thyroid dysfunction has an influence on the basic metabolism and the hormone secretion [Citation1]. Hypothyroidism exerts various effects on adipose tissue endocrine function [Citation5]. Disturbance of thyroid function is associated with marked changes in both body weight and energy expenditure and it is likely that leptin and thyroid hormones play a mutual role [Citation6,Citation7]. In primary hypothyroidism, TRH expression increases in the hypothalamus and this leads to increase in TSH levels [Citation5].
It is well established that adipokines play a crucial role in the pathophysiological link between disturbed function of the adipose tissue and energy homeostasis [Citation8]. Leptin is primarily produced by adipose tissue in proportion to the amount of body fat [Citation8]. Recent data have indicated that leptin levels correspond with thyroid hormone levels showing long-term effects on metabolism in both acute and indirect manner [Citation8,Citation9]. Leptin administration has been shown to prevent the fasting induced changes in serum T3 and T4 concentrations [Citation9,Citation10]. Ortiga-Carvalho et al. showed that leptin has a stimulatory effect on release of TSH in vivo [Citation8,Citation10]. In addition, leptin exerts a direct stimulatory effect on thyroxine (T4) released from the thyroid gland [Citation10]. Leptin regulates central and peripheral iodothyronine deiodinase activity and T4-to-T3 conversion [Citation10]. The thyroid hormones and leptin are in constant interaction, which may regulate the body composition and metabolism by various mechanisms.
Adiponectin is also secreted by the adipose tissue, and decreases in obese subjects [Citation6,Citation11]. It is well recognized that adiponectin protects against insulin resistance, and excessive hepatic lipid accumulation with anti-inflammatory effects [Citation10–12]. The adiponectin/leptin (A/L) ratio has been proposed as a marker of adipose tissue dysfunction [Citation12,Citation13]. This new biomarker is associated with insulin resistance better than leptin or adiponectin alone, being significantly reduced in patients with metabolic syndrome [Citation13,Citation14]. High circulating leptin levels, characteristic of obesity, together with impaired response to the anorectic effects of leptin is suggestive of leptin resistance[Citation11]. Subjects with low adiponectin blood concentrations lose its cardioprotective and anti-inflammatory effects [Citation15]. Thus, the A/L ratio could be used as a marker suggestive of the pathophysiological actions of leptin and adiponectin [Citation13,Citation14]. Frühbeck et al. [Citation13] proposed several cut-off points that may be useful in the detection of a dysfunctional adipose tissue with potential metabolic alterations.
The experimentally induced hypothyroidism creates various metabolic disorders in animals. This phenomenon could potentially be used to understand the important interplay between the thyroid function and the adipose tissue. It is well established that hypothyroidism induces central resistance to the acute anorexigenic effect of leptin, since euthyroid rats displayed reduced food intake after leptin administration [Citation16]. This study investigated our primary hypothesis that anti-diabetic drugs, Metformin and Empagliflozin, lead to changes in leptin, adiponectin and their ratio in an animal model of hypothyroidism. Our secondary hypothesis is that the animal model of hyperthyroidism results also in changes in adiponectin and leptin levels.
Materials and methods
Ethics statement
The experimental design was approved by the Research Ethics Committee of the Medical University, Sofia, and the study was performed in accordance with the ethical standards laid down in the Declaration of Helsinki.
Animals and experimental design
A total of 45 Wistar male rats with initial body weight of 250 g were used in the experiment. The rats were provided with standard rodent chow food and water ad libitum for 3 days to acclimate. They were housed in polypropylene cages at temperature-controlled environment (21–23 °C) with a 12-hour light/12-hour dark cycle. The rats were randomly assigned into three groups for an 8-week period: group I (induced hyperthyroidism), group II (induced hypothyroidism) and group III (control). Hyperthyroidism was caused by Levothyroxine (300 μg/kg body weight). Hypothyroidism was caused by application of 10 mg/kg/day (1 mL/250 g) propylthiouracil (PTU) diluted in drinking water. After the experimentally induced models of hyper- and hypothyroidisms were developed, group I and II were subdivided into: group treated with Metformin (350 mg/kg/per day, Berlin-Chemie AG, Germany), group treated with Empagliflozin (10 mg/kg/d p.o., Boehringer Ingelheim International GmbH) and a control group on a chow diet, treated for 1 month. The body weight of each rat was measured at the beginning of the experiment and every 7 days for the whole period.
Sampling
At the end of the whole experiment the rats were anesthetized under pentobarbital sodium (40 mg/kg). They were sacrificed by decapitation between 9 a.m. and 10 a.m. in the postabsorbtive state to avoid any changes associated with the circadian rhythm. Blood samples were collected from the trunk in EDTA tubes for measurement of leptin and adiponectin levels. All blood samples were centrifuged (2500 rpm, 20 min, LC-04B).
Measurement of leptin and adiponectin levels
Leptin and adiponectin levels were measured in duplicate in each case by specific sandwich enzyme-linked immunosorbent assay (ELISA rat kits) (BioVendor, Brno, Czech Republic). According to previous data, A/L ratio equal to 1.0 (with adiponectin concentrations expressed in µg/mL and leptin level in ng/mL) can be considered normal; a ratio between 0.5 and 1.0 can indicate moderate–medium increased risk, and a ratio below 0.5 suggests a severe increase in cardio-metabolic risk [Citation13].
Data analysis
Statistical analysis was performed using SPSS 23 (SPSS, Chicago, IL, USA) and GraghPad Prism 6 (GraphPad Software, Inc., La Jolla, CA, USA). Data were presented as means ± standard deviation. Differences between groups were analyzed by one-way analysis of variance (ANOVA). Differences were considered statistically significant at p < 0.05.
Results and discussion
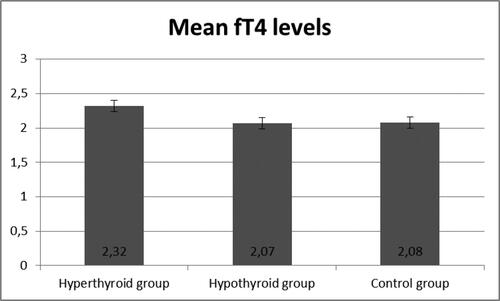
demonstrated the development of an experimentally induced model of hypothyroidism in male Wistar rats after an 8-week period. The experimental group treated with PTU showed a significant increase in TSH levels (p < 0.05), an increase in fT4, and reduction in fT3 hormone levels, confirming the validity of this animal model.
Figure 1. Levels of TSH in the three groups (n = 45).
Note: Hyperthyroidism was induced by levothyroxine 10 mg/kg/day (1 mL/250 g); hypothyroidism was induced by propylthiouracil 10 mg/kg/day; measurements were done following 8 weeks of treatment.
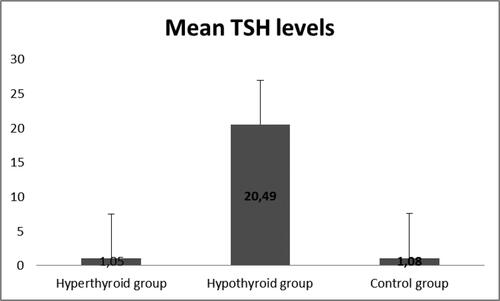
Figure 2. Levels of fT3 in the three groups.
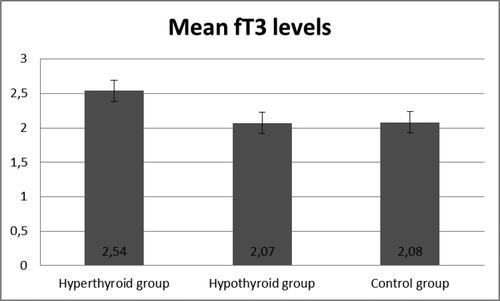
Figure 3. Levels of fT4 in the three groups.
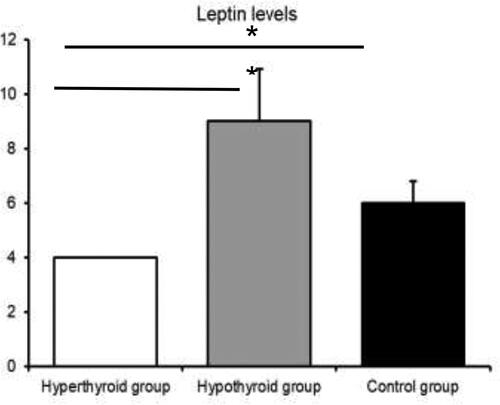
The blood levels of leptin are presented in . There was a statistically significant difference in the leptin concentrations among the three groups (p < 0.05) (). The results demonstrated that the model of hypothyroidism was characterized by significantly higher levels of leptin compared to the hyperthyroid model and the control group.
Figure 4. Leptin levels in the three groups.
Note: Asterisks indicate significant differences (p < 0.05).
At Week 8, the rats from the experimental and control groups were treated with either Metformin or Empagliflozin. The results showed a significant decrease in leptin levels in the hypothyroid rats treated with Metformin and Empagliflozin, respectively (p = 0.01), (). The adiponectin levels (µg/mL) are presented on . The Metformin- and Empagliflozin-treated groups demonstrated a significant decrease in adiponectin levels (p < 0.01) compared to the non-treated group.
Figure 5. Leptin levels (ng/mL) in hyperthyroid, hypothyroid and control groups.
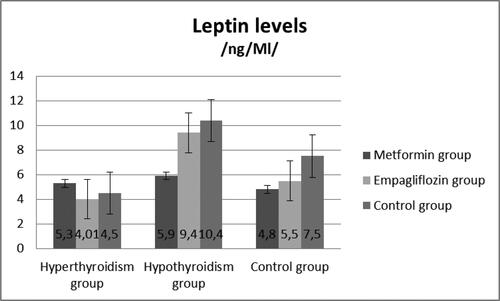
Figure 6. Adiponectin levels (µg/mL) in hyperthyroid, hypothyroid and control groups.
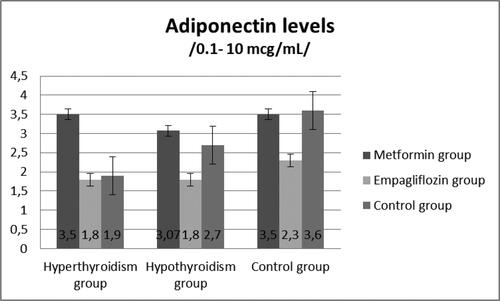
Based on the obtained data, we calculated the A/L ratio for the hypothyroid group. The hypothyroid male Wistar rats treated with Empagliflozin had a mean adiponectin/leptin ratio of 0.25, whereas the control group animals had an adiponectin/leptin ratio of 0.17, suggesting an increase in the cardio-metabolic risk in the experimental animals. Both, Metformin and Empagliflozin, reduced the adiponectin and leptin levels in the hypothyroid rats; however, there was no increase in the A/L ratio.
Metformin is a first-line antihyperglycemic agent that works by decreasing glucose production by the liver and increasing the insulin sensitivity of body tissues [Citation17]. The sodium glucose co-transporter 2 receptor (SGLT-2) inhibitors are a new class antidiabetic drugs that reduce the reabsorption of renal-filtered glucose back into the bloodstream, thereby leading to loss of glucose in the urine [Citation18]. Both anti-diabetic drugs reduced the adiponectin and leptin plasma levels in our hypothyroid rat model. Previous studies showed that these drugs could increase A/L ratio, which is in contrast with our findings [Citation18–20]. However, no significant change in A/L ratio was detected in our study. The A/L ratio is a reliable biomarker of adipose tissue dysfunction [Citation21] that could be characteristic of disturbed thyroid function. Consequently, the dysfunctional adipose tissue, indicated by a low A/L ratio, may represent a scenario of raised proinflammatory factors as potential mediators in the etiopathogenesis of obesity [Citation20,Citation21]. Since the A/L ratio reflects the dysfunction of adipose tissue[Citation21], it could be clinically useful to identify subjects susceptible to obesity and cardio-metabolic diseases [Citation13]. New therapeutic strategies for treatment of obesity and reducing cardiovascular risk aim at increasing the A/L ratio [Citation13,Citation20]. A low A/L ratio may express a hallmark of obesity and the metabolic syndrome with increased proinflammatory factors as potential mediators in its etiopathogenesis [Citation5,Citation13,Citation14,Citation22]. A decrease in the A/L ratio may also reflect alterations in this process further contributing to the obesity-associated metabolic disturbances [Citation23]. Although the two studied antidiabetic drugs are with beneficial effects on the cardio-vascular system, our results could not show an increase in the A/L ratio [Citation20,Citation24]. A possible limitation could be the relatively small number of experimental animals.
Another interesting result from the present study is that experimentally induced hypothyroidism led to increased leptin levels and leptin resistance in male rats. Many studies have demonstrated increased serum leptin levels in hypothyroid rats [Citation12,Citation13,Citation25,Citation26]. Escobar-Morreale et al. [Citation27] used thyroidectomized (Tx) Wistar rats treated chronically (12 − 13 days) with subcutaneous infusion of placebo, T4 or T3. In this study leptin concentrations were unchanged in the hypothyroid animals compared with the control group. The administration of T3 or T4 led to a decrease in serum leptin when compared with the hypothyroid animals and the control group. This result demonstrated high levels of serum leptin in the hypothyroid state and low levels in the thyrotoxic state. Hypothyroid animals had an elevated serum leptin relative to their body weight, which was normalized and decreased when T3 or T4 were administrated. The data were in accordance with other studies [Citation26] in which hypothyroid rats demonstrated increased leptin mRNA levels and increased leptin secretion, which were acutely reversed by T3 infusion of supraphysiological doses.
Another important point is that hypothyroidism is also characterized by decreased adiponectin levels [Citation28,Citation29]. Adipose tissue is a major endocrine organ that secretes a variety of hormones and adipokines, such as leptin and adiponectin [Citation5,Citation6]. Thyroid dysfunction can affect the functions of adipose tissue, and together they can easily alter the metabolism and energy homeostasis[Citation30]. We found a decrease in adiponectin levels in hypothyroid male Wistar rats that could lead to further metabolic complication. Surprisingly, the application of Metformin, a first-line anti-diabetic drug, and Empagliflozin, as a sodium-glucose co-transporter 2 (SGLT2) inhibitor, in this group led to further significant decrease in adiponectin concentration compared to the non-treated group. Our results are in contrast with a recent study showing that Empagliflozin treatment increased the adiponectin levels [Citation31,Citation32] in male ApoE−/− mice fed a western diet [Citation18]. Moreover, we found a significant reduction in leptin levels after Metformin and Empagliflozin administration in hypothyroid rats. In another animal study, Vickers et al. [Citation19] demonstrated that Empagliflozin resulted in reduced plasma leptin concentrations.
Conclusions
Metformin and Empagliflozin lea to reduction in both leptin and adiponectin plasma levels in our model of hypothyroidism. The introduced animal model of hypo- and hyperthyroidism is an effective experimental setting to study adipokine hormone variations.
Funding/support
The publication of this article was supported by Boehringer Ingelheim RCV GmbH & Co. KG- Branch Bulgaria. Boehringer Ingelheim had no influence on the study and content of the paper.
Disclosure statement
No potential conflict of interest was reported by the author(s).
Data availability statement
All data that support the finding reported in this study are available from the corresponding author upon reasonable request.
References
- Krotkiewski M. Thyroid hormones in the pathogenesis and treatment of obesity. Eur J Pharmacol. 2002; 440(2–3):85–98.
- Sahzene Y, Salgado S, del Prado N. Thyroid HormoneAction and Energy Expenditure. J Endocr Soc. 2019; 3(7):410.
- Ambrosi B, Masserini B, Iorio L, et al. Relationship of thyroid function with body mass index and insulin-resistance in euthyroid obese subjects. J Endocrinol Invest. 2010; 33(9):640–643.
- Xu R, Huang F, Zhang S, et al., Thyroid function, body mass index, and metabolic risk markers in euthyroid adults: a cohort study. BMC Endocr Disord. 2019; 19(1):58.
- Choe SS, Huh JY, Hwang IJ, et al. Adipose tissue remodeling: its role in energy metabolism and metabolic disorders. Front Endocrinol (Lausanne)). 2016;7:30.
- Harris RB. Direct and indirect effects of leptin on adipocyte metabolism. Biochim Biophys Acta. 2014;1842(3):414–423.
- Zimmermann-Belsing T, Brabant G, Holst JJ, et al. Circulating leptin and thyroid dysfunction. Eur J Endocrinol. 2003;149(4):257–271.
- Lancha A, Fruhbeck G, Gomez-Ambrosi J. Peripheral signalling involved in energy homeostasis control. Nutr Res Rev. 2012;25(2):223–248.
- Delitala AP, Steri M, Fiorillo E, et al. Adipocytokine correlations with thyroid function and autoimmunity in euthyroid sardinians. Cytokine. 2018;111:189–193.
- Aydogan BI, Sahin M. Adipocytokines in thyroid dysfunction. ISRN Inflamm, 2013. p. 646271.
- Farcaş AD, Rusu A, Stoia MA, et al. Plasma leptin, but not resistin, TNF-alpha and adiponectin, is associated with echocardiographic parameters of cardiac remodeling in patients with coronary artery disease. Cytokine. 2018;103:46–49.
- Delitala AP, Scuteri A, Fiorillo E. Role of Adipokines in the Association between Thyroid Hormone and Components of the Metabolic Syndrome. J Clin Med. 2019; 8(6).
- Frühbeck G, Catalán V, Rodríguez A, et al. Adiponectin-leptin Ratio is a Functional Biomarker of Adipose Tissue Inflammation. Nutrients. 2019;11(2):454.
- van Tienhoven-Wind LJ, Dullaart RP. Increased leptin/adiponectin ratio relates to low-normal thyroid function in metabolic syndrome. Lipids Health Dis. 2017;16(1):6.
- Gasbarrino K, Gorgui J, Nauche B, et al. Circulating adiponectin and carotid intima-media thickness: a systematic review and meta-analysis. Metabolism. 2016;65(7):966–968.
- Calvino C, Império GE, Wilieman M, et al. Hypothyroidism induces hypophagia associated with alterations in protein expression of neuropeptide y and proopiomelanocortin in the arcuate nucleus, independently of hypothalamic nuclei-specific changes in leptin signaling. Thyroid. 2016;26(1):134–143.
- Bagepally BS, Chaikledkaew U, Gurav YK. Glucagon-like peptide 1 agonists for treatment of patients with type 2 diabetes who fail metformin monotherapy: systematic review and meta-analysis of economic evaluation studies. BMJ Open Diabetes Res Care. 2020; 8(1).
- Han JH, Oh TJ, Lee G, et al. The beneficial effects of empagliflozin, an SGLT2 inhibitor, on atherosclerosis in ApoE -/- mice fed a western diet. Diabetologia. 2017; 60(2):364–376.
- Vickers SP, Cheetham SC, Headland KR, et al. Combination of the sodium-glucose cotransporter-2 inhibitor empagliflozin with orlistat or sibutramine further improves the body-weight reduction and glucose homeostasis of obese rats fed a cafeteria diet. Diabetes Metab Syndr Obes. 2014;7:265–275.
- Frühbeck G, Catalán V, Rodríguez A, et al. Adiponectin-leptin ratio: A promising index to estimate adipose tissue dysfunction. Relation with obesity-associated cardiometabolic risk. Adipocyte. 2018;7(1):57–62.
- Villarreal-Molina MT, Antuna-Puente B. Adiponectin: anti-inflammatory and cardioprotective effects. Biochimie. 2012;94(10):2143–2149.
- Zaletel J, Barlovic DP, Prezelj J. Adiponectin-leptin ratio: a useful estimate of insulin resistance in patients with Type 2 diabetes. J Endocrinol Invest. 2010;33(8):514–518.
- Inoue M, Maehata E, Yano M, et al. Correlation between the adiponectin-leptin ratio and parameters of insulin resistance in patients with type 2 diabetes. Metabolism. 2005;54(3):281–286.
- Inzucchi SE, Zinman B, Wanner C, et al. SGLT-2 inhibitors and cardiovascular risk: proposed pathways and review of ongoing outcome trials. Diab Vasc Dis Res. 2015;12(2):90–100.
- Gong N, Gao C, Chen X, et al. Adipokine expression and endothelial function in subclinical hypothyroidism rats. Endocr Connect. 2018;7(2):295–304.
- Syed MA, Thompson MP, Pachucki J, et al. The effect of thyroid hormone on size of fat depots accounts for most of the changes in leptin mRNA and serum levels in the rat. Thyroid. 1999;9(5):503–512.
- Escobar-Morreale HF, Escobar del Rey F, Morreale de Escobar G. Thyroid hormones influence serum leptin concentrations in the rat. Endocrinology. 1997;138(10):4485–4488.
- Iglesias P, Alvarez Fidalgo P, Codoceo R, et al. Serum concentrations of adipocytokines in patients with hyperthyroidism and hypothyroidism before and after control of thyroid function. Clin Endocrinol (Oxf). 2003;59(5):621–629.
- Ohashi K, Ouchi N, Matsuzawa Y. Anti-inflammatory and anti-atherogenic properties of adiponectin. Biochimie. 2012;94(10):2137–2142.
- Sorisky A, Bell A, Gagnon A. TSH receptor in adipose cells. Horm Metab Res. 2000;32(11–12):468–474.
- Xu L, Nagata N, Chen G, et al. Empagliflozin reverses obesity and insulin resistance through fat browning and alternative macrophage activation in mice fed a high-fat diet. BMJ Open Diabetes Res Care. 2019;7(1):e000783–142.
- Xu L, Nagata N, Nagashimada M, et al. SGLT2 inhibition by empagliflozin promotes fat utilization and browning and attenuates inflammation and insulin resistance by polarizing M2 macrophages in diet-induced obese mice. EBioMedicine. 2017;20:137–149.