
Abstract
Spinosad (spinosyn A and spinosyn D), the secondary metabolite produced by Saccharopolyspora spinosa, is a potent insecticide with low effects on the environment and mammals. Strategies such as metabolic engineering, mutagenesis and fermentation process optimization have been employed for its production enhancement. Quantitative real-time polymerase chain reaction(qRT-PCR) is one of the preferred methods for the evaluation of gene transcript levels, whose accuracy and sensitivity depend on the normalization using optimal reference genes. However, no single reference gene is universally appropriate for all strains under various conditions. In this study, the transcriptional stability of 35 candidate reference genes, including 23 traditionally used reference genes and 12 novel reference genes identified in S. spinosa homologous species, was analysed in S. spinosa ATCC 49460 and spinosad high-yield strain S. spinosa S3-3 under three fermentation phases. The transcriptional stability of these genes was assessed by three statistical algorithms, geNorm, NormFinder and BestKeeper. The overall rankings suggested that rpoB and efp were the most stable candidate reference genes, and they may be the most promising reference genes for further study on the measurement of expression levels of target genes involved in the biosynthetic process of spinosad.
Introduction
Saccharopolyspora spinosa, a kind of soil actinomycete, has attracted great attention because of its secondary metabolites, spinosad. Spinosad (spinosyn A and spinosyn D) is a member of polyketide-derived macrolide insecticide with high effectiveness and broad-spectrum insecticidal activity [Citation1]. Taking the advantages of low mammalian and avian toxicity and low environmental impact, spinosad was awarded ‘The Presidential Green Chemistry Challenge (U.S.A.)’ three times and was permitted to be used on organic food by the European Union, leading to a high market demand [Citation2–4].
In order to increase the fermentation yield of spinosad, researchers had made great efforts through chemical mutagenesis or fermentation optimization of S. spinosa [Citation3, Citation5]. Recently, the whole genome sequence of S. spinosa has been published, which enables further studies on the construction of high-yield spinosad strains by metabolic engineering [Citation6]. The whole genome sequence of S. spinosa laid the foundation to search for new target genes in S. spinosa to increase spinosad yield through molecular biology approach. Thereafter, transcriptional level research played a key role in revealing the regulation network and catalytic actions during cell processes.
Several methods have been used to investigate gene transcription levels, such as Northern blotting, semi-quantitative reverse transcription polymerase chain reaction (RT-PCR), in situ hybridization and quantitative real-time PCR (qRT-PCR). qRT-PCR is the most widely used technique to investigate gene expression due to its high sensitivity, specificity, accuracy, reproducibility, convenience and high throughout [Citation7–9]. However, multiple factors can affect the accuracy of the qRT-PCR data, including RNA quality and quantity, cDNA synthesis methods and its concentration, the efficiency of amplification and so on [Citation10]. For normalization and precise quantification of the expression of the target genes, the selection and validation of stable references genes are crucial steps before proceeding to gene expression analysis.
A number of housekeeping genes such as 16S ribosomal RNA (16S rRNA), ribosome protein L13 (rbL13), RNA polymerase factor, DNA polymerase factor and elongation factor have been used as reference genes in different expression profiling studies in bacteria [Citation11–14]. However, it is reported that the expression of housekeeping genes may vary among various species and different experimental conditions. To identify the key steps in spinosad biosynthesis of S. spinosa, the most commonly used reference gene was DNA polymerase sigma factor subunit A (sigA) [Citation15–17]. Also, 16S rRNA was selected as the reference gene for revealing the metabolism difference between Saccharopolyspora pogona and S. spinosa, as well as seeking the link between primary metabolism and spinosad biosynthesis [Citation18, Citation19]. And ribosome protein L13 (rbL13) was also selected to determine the transcript levels of rex, ctyA and ctyb, which were related to the redox control in S. spinosa [Citation20]. In the study of heterologous expression of spinosyn biosynthetic gene cluster, DNA gyrase subunit A (gyrA) was chosen as the reference gene [Citation21]. Additionally, the polyketide synthase (spnA), which was involved in spinosad biosynthesis, was also considered to be a reference gene. It was reported that 16S rRNA and rbL13 were considered to be the most suitable reference genes in different S. spinosa strains and under different culture conditions [Citation22]. Overall, it is obvious that the normalization of reference genes in S. spinosa has not been standardized.
In this study, the most stable reference genes for gene transcriptional analysis in S. spinosa were screened with two different strains and three fermentation phases. The study will contribute to more complex studies, for instance, searching for the limiting enzyme during spinosad biosynthesis and new target genes for S. spinosa yield improvement, as well as exploring other macrolide secondary metabolites.
Materials and methods
Strains and cultivation
The wild-type strain, S. spinosa ATCC 49460 was purchased from China General Microbiological Culture Collection Center (CGMCC). The high-yield mutant, S. spinosa S3-3 derived from strain ATCC 49460, was obtained by nitrosoguanidine mutagenesis, UV irradiation combined with chloramphenicol screening successively, and shows stable inheritance.
For strain activation, 0.5 mL of spore suspensions (approx. 107–108 spores/mL) was inoculated to seed medium and incubated for 54 h at 29 °C, 240 rpm on a rotary shaker. Each litre of seed medium contained the following: 4 g yeast extract, 4 g tryptone, 4 g casein hydrolysate (acid), 10 g glucose, 1.36 g K2HPO4, 0.5 g MgSO4, with a pH of 7.2 ± 0.1 before autoclaving. Next, 10% (v/v) of the seed culture was inoculated into 30 mL of seed medium to prepare fermented seed liquid. Then, 0.3 mL of seed culture (10%, v/v) was inoculated into 30 mL of fermentation medium in 250-mL Erlenmeyer flasks and cultured for 7 d at 29 °C, 240 rpm. The composition of the fermentation medium (per litre) was 10 g peptonized milk, 20 g cottonseed protein, 20 g dextrin, 1 g NaCl, 1.0 g MgSO4, 0.5 g KH2PO4, 3 g CaCO3, 10 g yeast extract, 60 g glucose, 20 g soybean oil. The pH value was adjusted to 7.2 with 1 mol/L of NaOH before autoclaving. All experiments had three biological replicates.
Analysis of spinosad production
The yield of spinosad was assessed using high-performance liquid chromatography (HPLC) as described by Huang et al. [Citation15]. For determination of spinosad productivity, fermentation broth was extracted with 3× volume of methanol overnight at 4 °C, protected from light. Then, the leaching liquor was centrifuged at 14,000 rpm for 15 min before being analysed by HPLC. Samples (10 μL) were injected into an Agilent C18 reverse-phase column (5 μm, 150 × 4.6 mm) operated at 40 °C using an isocratic mobile phase composed of 45% (v/v) methanol, 45% (v/v) acetonitrile, and 10% 6.5 mmol/L ammonium acetate with a flow rate of 1.0 mL/min using a UV detector at 244 nm.
RNA isolation and cDNA synthesis
Total RNA was extracted using TRNzol reagent (Tiangen Biotech Co., LTD. cat. no. DP424) from the frozen powder of S. spinosa mycelia of different fermentation time [Citation23]. The possibility of contamination of genomic DNA was eliminated with RNase-free DNaseI (Takara Bio, Dalian, China; cat. no. 2270 A), and then, the digested RNA was used as a template for the synthesis of cDNA with Reverse Transcriptase (Promega Co., cat. no. M170A) with random hexamer primer (Takara Bio, Dalian, China; cat. no. 3801) according to the manufacturer’s protocol (https://www.takarabiomed.com.cn/DownLoad/3801.pdf). During the treatment of RNA, RNase Inhibitor (Takara Bio, Dalian, China; cat. no. 2313 A) was added to prevent the degradation of RNA. The integrity and size distribution of the RNA were verified by 2% agarose gel electrophoresis, and the concentrations of RNA and cDNA were determined spectrophotometrically.
Candidate gene selection and primer designing
It was reported that the reliable reference genes of the model organism Streptomyces coelicolor were identified by transcript abundance analysis [Citation24]. Based on the research, we compared the amino acid sequences of selected reference genes of S. coelicolor through BLAST in the NCBI database, and then, 12 candidate genes were found. Besides, according to previous studies, another 23 commonly used housekeeping genes such as 16S rRNA, rbL13, sigA, GAPDH, tufA, hrdB and so on were included in the study [Citation12–14, Citation22, Citation25]. All primers for candidate genes were designed by software online (https://sg.idtdna.com). The definition and primer sequences of genes are listed in .
Table 1. Description of candidate reference genes, primer sequences and amplicon size in the study.
For qRT-PCR, the primer specificity was determined by the PCR products and melting curve analysis. The amplification efficiency (E) for each primer and the R2 value were evaluated based on the standard curve generated from a 10-fold serial dilution of pooled cDNA (10°, 10−1, 10−2 and 10−3). The amplification efficiency was calculated using the given formula [E=(10(–1/slope)–1 × 100] [Citation26, Citation27].
SYBR green qRT-PCR
For analysis of the transcriptional levels of target genes, 0.07 μg of cDNA was used for qRT-PCR on the CFX96 touch Real-Time PCR System (Bio-Rad). Each 15 μL reaction system consisted of 1.0 μL cDNA (70 ng/μL), 0.75 μL each primer (10 μmol/L), 7.5 μL 2 × SYBR® Select Master Mix (Applied Biosystems; cat. no. 44729) and 5.0 μL RNase-free ddH2O. The PCR procedures were as follows: 2 min at 50 °C for activating uracil-DNA glycosylase, 2 min at 95 °C for pre-denaturation, followed by 40 cycles of 15 s at 95 °C for denaturation and 30 s at 60 °C for annealing and extension. To reduce the experimental error, each sample had four parallels. The CFX Manager Software V3.1 was used for visualizing and analysing the raw data.
Data analysis
To analyse the expression stability of candidate reference genes, the cycle threshold (Ct) values of the candidate genes were analysed with three statistical tools: geNorm, NormFinder and BestKeeper [Citation28–30].
Results
Fermentation and sampling
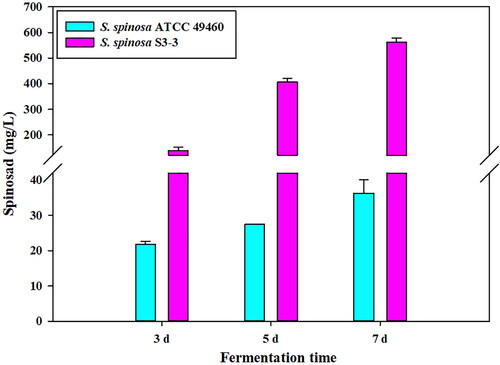
The whole fermentation period of S. spinosa was 7 days. According to the fermentation process, the S. spinosa strain showed different physiological statuses, and the samples of two different strains were collected at three fermentation stages: initial stage of spinosad production (fermentation for 3 days), logarithmic period of spinosad production (fermentation for 5 days) and stationary phase of spinosad production (fermentation for 7 days). As shown in , at these three time points, the spinosad production of wild-type strain and high-yield mutant was comparable, while the yield of spinosad production of S. spinosa S3-3 was 6–16 times higher than that of S. spinosa ATCC 49460.
Figure 1. Spinosad production by two S. spinosa strains during different fermentation phases.
Primer amplification specificity and efficiency evaluation
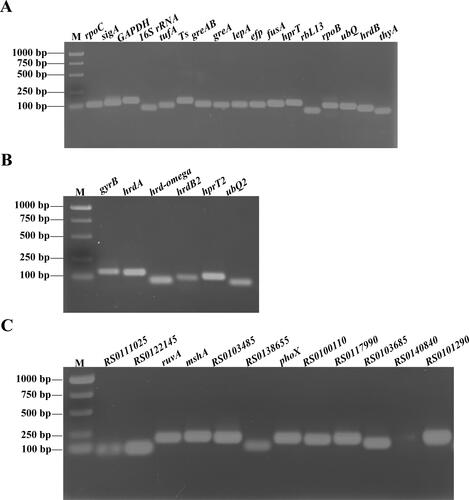
To assess the primer specificity of the 35 candidate genes in our study, the amplified products were checked by 2% agarose gel electrophoresis. shows that the amplicon sizes were consistent with the expected sizes. The amplification of a single PCR fragment with no dimer formation and a single sharp peak in the melting curves (data not shown) ensured the specificity of the primers for the selected reference genes. In addition, the primer efficiency of all selected genes was higher than 90% with R2 values of the standard curve ranging from 0.961 to 1.000 (the detailed description is shown in ). It was reported that the acceptable amplification efficiency varied from 90% to 110% [Citation26, Citation31]. Based on the principle, some of the genes, including RS0111025 (134.56%), RS0122145 (135.79%), mshA (26034.28%), RS0138655 (131.54%), RS0117990 (332.97%), RS0140840 (154.91%), were excluded.
Figure 2. Amplification product of candidate reference genes. PCR products in 2% agarose gel stained with ethidium bromide (EB). (A) PCR analysis of the 17 genes (rpoC, sigA, GAPDH, 16S rRNA, tufA, Ts, greAB, greA, lepA, efp, fusA, hprT, rbL13, rpoB, ubQ, hrdB and thyA); (B) PCR analysis of the 6 genes (gyrB, hrdA, hrd-omega, hrdB2, hprT2 and ubQ2); (C) PCR analysis of the 12 genes (RS0111025, RS0122145, ruvA, mshA, RS0103485, RS0138655, phoX, RS0100110, RS0117990, RS0103685, RS0140840 and RS0101290). M: D15000 + 2000 DNA marker (Tiangen Biotech Co., LTD. cat. no. MD116).
Candidate reference gene transcription-level profiling
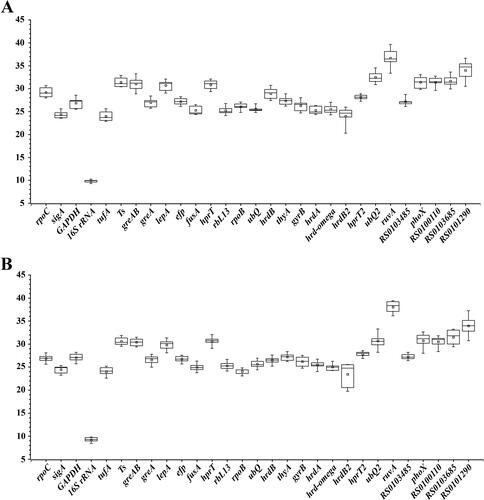
The expression rates of all the selected reference genes were measured based on Ct values from the qRT-PCR for different samples. The mean Ct values gave insight into the approximate gene expression levels. As shown in , the mean Ct values for the remaining 29 candidate reference genes ranged from 9.82 for 16S rRNA to 36.65 for ruvA for S. spinosa ATCC 49460. Similarly, for S. spinosa S3-3, the mean Ct values ranged from 9.21 for 16S rRNA to 38.05 for ruvA (), which revealed a relatively wide range of expression differences between genes. Among these selected reference genes, 16S rRNA showed a maximum expression variation, whereas RS0140840, ruvA and RS0117990 were the least abundantly expressed genes with higher Ct values (>35). According to the MIQE guideline that the Ct value of the reliable reference gene should be less than 31 [Citation32], the candidate genes ubQ2, ruvA, RS0101290, RS0103685, phoX and Ts were not suitable to be selected as the internal reference genes.
Figure 3. Threshold cycle (Ct) values of 29 candidate reference genes. The box plots of S. spinosa ATCC 49460 (A) and S. spinosa S3-3 (B) for Ct values from the qRT-PCR analysis. Note: For each candidate gene, the line inside the box is the median and the little square inside the box is the mean. The top and bottom lines of the box are 75th and 15th quartiles, respectively. The top and bottom whiskers represent the 5th and 95th percentiles.
geNorm analysis
The software geNorm was used to calculate the gene expression stability value (M value) to rank the candidate genes. Based on the geNorm algorithm, the gene with the least M value was considered as the most stable reference gene, whereas with the highest M value was regarded as the least stable gene [Citation30]. For S. spinosa ATCC 49460, the M value of the selected reference genes excluding hrdB2 was lower than 1.5. The M value of the genes ranged from 0.815 to 2.374. The gene hprT2 (M = 0.815) was the most stable reference gene followed by hrdA (M = 0.873), RS0103485 (M = 0.877), rpoB (M = 0.883) and fusA (M = 0.9), while hrdB2 was the least stable candidate reference gene with the highest M value (2.374) (; ).
Figure 4. Expression stability analysis of each candidate reference gene in S. spinosa ATCC 49460 (A) and S. spinosa S3-3 (B) using geNorm.
Note: The lower stability value (M value) indicates higher stability of the candidate reference genes. The direction of the arrow indicates the most and least stable reference genes, respectively.
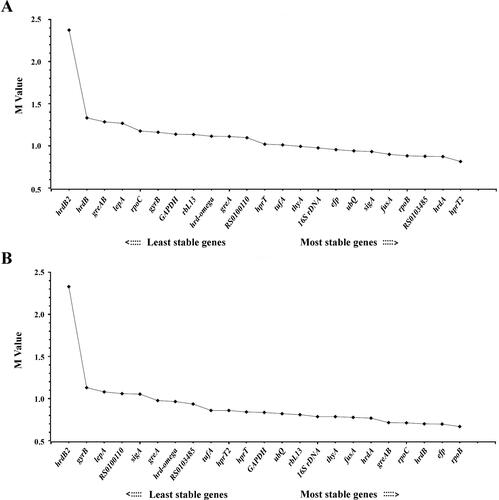
Table 2. geNorm analysis for 23 candidate reference genes in S. spinosa wild-type and mutant strains.
As for S. spinosa S3-3, except for hrdB2, the other 22 candidate reference genes showed M value less than 1.5. The M value of genes varied from 0.668 for rpoB to 2.33 for hrdB2. The gene rpoB (M = 0.668) was the most stable reference gene followed by efp (M = 0.698). Similarly with S. spinosa ATCC 49460, hrdB2 was the least stable candidate reference gene with the highest M value (2.33) (; ).
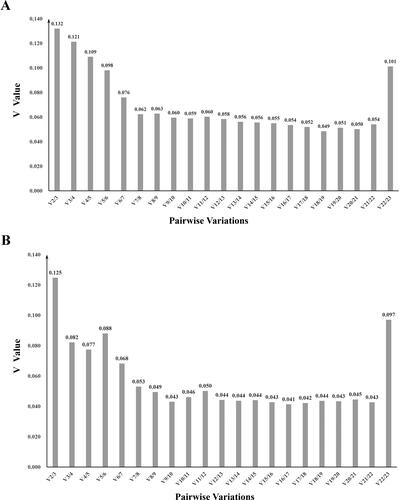
Moreover, geNorm also determines an optimum number of reference genes based on the pairwise variation (Vn/Vn+1) between sequential normalization factor. A value of Vn/Vn+1 less than 0.15 indicates that the value of n being the optimal number of candidate reference genes is enough to be used as an internal reference gene [Citation30]. In this study, the values of V2/V3 in two strains were lower than 0.15, suggesting that two reference genes were sufficient for normalization of genes ().
Figure 5. geNorm analysis to determine optimal number of reference genes required for gene normalization. Pairwise variation (V) analysis for S. spinosa ATCC 49460 (A) and S. spinosa S3-3 (B).
Note: V1 to V23 represent the variation in candidate reference genes ranked based on their stability. V1 is the variation for the most stable, whereas V23 is the variation for the least stable gene.
NormFinder analysis
The stability of the selected reference genes was further estimated by the NormFinder based on inter-group and intra-group variations, and the genes with lower values indicated higher stability [Citation28]. Based on the stability value (S value) of all genes, hrdB2 was the least stable reference gene with S value higher than 1.5 either in S. spinosa wild-type strain or in mutant. hprT2, hrdA, efp, fusA and rpoB showed higher stability with lower values. For S. spinosa ATCC 49460, hprT2 was identified as the most stable reference gene with an S value of 0.101 followed by hrdA (S = 0.257) (; ). While for S. spinosa S3-3, geNorm analysis and NormFinder algorithm revealed almost similar results for selecting candidate reference gene. rpoB was ranked as the most stable reference gene with an S value of 0.094. efp was the third stable candidate reference gene with an S value of 0.15 (; ).
Figure 6. Expression stability analysis of each candidate reference gene in S. spinosa ATCC 49460 (A) and S. spinosa S3-3 (B) using NormFinder. The lower stability value (S value) indicates higher stability of the candidate reference genes. The direction of the arrow indicates the most and least stable reference genes, respectively.
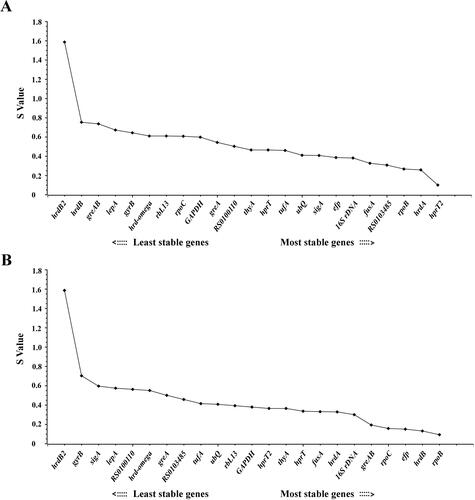
Table 3. NormFinder analysis for 23 candidate reference genes in S. spinosa wild-type and mutant strains.
BestKeeper analysis
Another program, the BestKeeper could identify potential reference genes based on two significant criteria: standard deviation (SD) of the average Ct values and coefficient of correlation (r) value [Citation29]. Higher r value means more stable candidate reference genes, and lower SD value represents higher stability. Here, the r value was considered as the prime element for evaluation. In the wild-type strain, greAB (r = 0.91) was ranked as the most stable reference gene, followed by tufA and rpoB with r values of 0.89 and 0.88, respectively. And hrdB2 was the least stable candidate reference gene with the minimum r value (), which was identical with the results from the geNorm and NormFinder analyses. For the mutant strain, rbL13 (r = 0.95) was the most stable gene, followed by rpoB (r = 0.94), thyA (r = 0.94) and greAB (r = 0.94). RS0103485 (r = 0.35), sigA (r = 0.48) and hrdB2 (r = 0.56) were less stably expressed genes with lower r values. Considering that an SD value less than 1.0 suggests consistence and stability of gene expression levels, the gene greAB was not eligible for a reference gene with SD value higher than 1.0.
Table 4. The 23 candidate reference genes stability and ranking analysed by BestKeeper.
Comprehensive analysis of expression stability
For a comprehensive assessment of the most stable reference genes, the above results from geNorm, NormFinder and BestKeeper were taken into consideration. As shown in , rpoB was the most stable reference gene followed by fusA and hprT2 in S. spinosa ATCC 49460. For S. spinosa S3-3, rpoB was the most stable reference gene followed by efp, greAB and rpoC. While fusA ranked the seventh in S. spinosa S3-3, comparing to efp ranked the sixth, we suggested efp as a preferable one. Overall, the gene rpoB ranked as the most reliable reference gene, and efp was the second most stable candidate reference gene in both S. spinosa wild-type strain and its mutant S3-3. hrdB2 and gyrB performed as the least stable candidate reference genes.
Table 5. Overall ranking of the candidate reference genes by the results from geNorm, NormFinder and BestKeeper.
Discussion
qRT-PCR is an essential technique for analysing transcriptomes and investigating the regulatory molecular mechanisms [Citation33]. But an inappropriate reference gene could result in invalid results. In general, a reference gene is not universal under different conditions. Therefore, it is extremely necessary to select suitable references to guarantee the accuracy of the transcriptional analysis of the target genes. In previous studies, stable reference genes have been identified in multiple species of cyanobacteria [Citation34], bacteria [Citation22, Citation35, Citation36], yeast [Citation37], mycetes [Citation38] and plants [Citation39, Citation40] under different conditions.
This study is a systematic assessment of candidate reference genes in S. spinosa wild-type strain and high-yield mutant during different fermentation periods. Twenty-three traditionally used reference genes (encoding ribosomal RNA, ribosomal protein, elongation factor, RNA polymerase subunit, ubiquitin, RNA polymerase sigma factor, glyceraldehyde-3-phosphate dehydrogenase, etc.) and 12 novel genes from its homologous species Streptomyces coelicolor were selected as the candidate genes. The specificity of synthesized primers was determined by agarose gel electrophoresis and melting curve analysis, and amplification efficiency of primers was calculated using a series of 10-fold dilutions of pooled cDNA.
Three different statistical algorithms named geNorm, NormFinder and BestKeeper were regularly used to analyse the datasets to identify reference genes [Citation28–30]. In this study, the geNorm and NormFinder programs displayed the same results of the most stable and least suitable reference genes, but differed from the order analysed by BestKeeper in two different strains. In the S. spinosa ATCC 49460, hprT2 and hrdB2 were identified as the reference gene with the highest and the lowest stabilities by geNorm and NormFinder softwares, respectively, while greAB and hrdB2 were the most and the least stable genes obtained by BestKeeper. As for S. spinosa S3-3, rpoB and hrdB2 were identified as the most and the least stable genes by geNorm and NormFinder, whereas in BestKeeper, rbL13 was ranked as the highest stable gene and RS0103485 as the lowest stable one. Similar results that the ranking orders obtained from geNorm and NormFinder varied from those obtained by BestKeeper have been described in previous reports [Citation33, Citation41]. Based on the comprehensive evaluation of the results from three methods of analysis, the genes rpoB and efp were the most reliable reference genes in S. spinosa strains at different fermentation stages. And hrdB2 and gyrB exhibited relatively lower stability in S. spinosa strains.
rpoB, encoding DNA-directed RNA polymerase subunit beta, was identified as stable reference in Bifidobacterium animalis under different culture conditions [Citation42]. Also, rpoB had demonstrated its transcriptional stability in Actinobacillus suis, Staphylococcus aureus, Xanthomonas, Listeria monocytogenes and other bacteria [Citation43–46]. In addition, elongation factor evaluated among multiple species showed a quite stable expression level under different conditions [Citation11, Citation22, Citation27]. Although hrdB was widely used as a reference gene for detection of transcription levels of target genes in Streptomyces [Citation47], it was more stable in S. spinosa S3-3 than in S. spinosa ATCC 49460. Zhang et al. [Citation22] found that 16S rRNA and rbL13 were the most suitable reference genes in different S. spinosa strains and under different culture conditions. On the contrary, our study showed rpoB and efp were ranked as top candidate reference genes in different strains, under the condition of different fermentation periods, yet 16S rRNA and rbL13 were less stable.
Conclusions
In summary, we have successfully evaluated and validated stable reference genes in different S. spinosa strains at different periods of fermentation. The analysis revealed the reliable reference genes in S. spinosa wild-type strain and high-producing spinosad mutant. The results showed that rpoB and efp were the best candidate reference genes for the normalization of gene expression in the process of spinosad synthesis. These two genes may be the most promising reference genes for future studies on gene function, spinosad biosynthesis process, as well as molecular mechanisms in S. spinosa.
Data availability
The data that support the findings reported in this study are available from the corresponding author upon reasonable request.
Disclosure statement
The authors declare that they have no conflict of interest. Xiaomeng Liu, Yunpeng Zhang, Tie Yin, Qi Li, Qiulong Zou and Xiaolin Zhang are affiliated with COFCO, and conceived the experiments, designed the experiments, performed the experiments, analysed the data, prepared figures and/or tables, authored or reviewed drafts of the paper, approved the final draft; Kexue Huang is affiliated with Qilu Pharmaceutical, and authored or reviewed drafts of the paper.
Additional information
Funding
References
- Kirst HA. The spinosyn family of insecticides: realizing the potential of natural products research. J Antibiot (Tokyo). 2010;63(3):101–111.
- Sanon A, Ba NM, Binso-Dabire CL, et al. Effectiveness of spinosad (naturalytes) in controlling the cowpea storage pest, Callosobruchus maculatus (Coleoptera: Bruchidae). J Econ Entomol. 2010;103(1):203–210.
- Tao H, Zhang Y, Deng Z, et al. Strategies for enhancing the yield of the potent insecticide spinosad in actinomycetes. Biotechnol J. 2019;14(1):1700769.
- Williams T, Valle J, Viñuela E. Is the naturally derived insecticide spinosad® compatible with insect natural enemies? Biocontrol Sci Techn. 2003;13(5):459–475.
- Huang KX, Xia L, Zhang Y, et al. Recent advances in the biochemistry of spinosyns. Appl Microbiol Biotechnol. 2009;82(1):13–23.
- Pan YL, Yang XY, Li J, Zhang RF, et al. Genome sequence of the spinosyns-producing bacterium Saccharopolyspora spinosa NRRL 18395. J Bacteriol. 2011;193(12):3150–3151.
- Derveaux S, Vandesompele J, Hellemans J. How to do successful gene expression analysis using real-time PCR. Methods. 2010;50(4):227–230.
- Huggett JF, Dheda K, Bustin SA, et al. Real-time RT-PCR normalisation; strategies and considerations. Genes Immun. 2005;6(4):279–284.
- Nolan T, Hands RE, Bustin SA. Quantification of mRNA using real-time RT-PCR. Nat Protoc. 2006;1(3):1559–1582.
- Florindo C, Ferreira R, Borges V, et al. Selection of reference genes for real-time expression studies in Streptococcus agalactiae. J Microbiol Methods. 2012;90(3):220–227.
- Løvdal T, Saha A. Reference gene selection in Carnobacterium maltaromaticum, Lactobacillus curvatus, and Listeria innocua subjected to temperature and salt stress. Mol Biotechnol. 2014;56(3):210–222.
- Mcmillan M, Pereg L. Evaluation of reference genes for gene expression analysis using quantitative RT-PCR in Azospirillum brasilense. Plos One. 2014;9(5):e98162.
- Sun Z, Deng J, Wu H, et al. Selection of stable reference genes for real-time quantitative PCR analysis in Edwardsiella tarda. J Microbiol Biotechnol. 2017;27(1):112–121.
- Wen S, Chen X, Xu F, et al. Validation of reference genes for real-time quantitative PCR (qPCR) analysis of Avibacterium paragallinarum. PLoS One. 2016;11(12):e0167736.
- Huang Y, Zhang X, Zhao C, et al. Improvement of spinosad production upon utilization of oils and manipulation of β-oxidation in a high-producing Saccharopolyspora spinosa strain. J Mol Microbiol Biotechnol. 2018;28(2):53–64.
- Luo Y, Ding X, Xia L, et al. Comparative proteomic analysis of Saccharopolyspora spinosa SP06081 and PR2 strains reveals the differentially expressed proteins correlated with the increase of spinosad yield. Proteome Sci. 2011;9:40.
- Tang Y, Xia L, Ding X, et al. Duplication of partial spinosyn biosynthetic gene cluster in Saccharopolyspora spinosa enhances spinosyn production. FEMS Microbiol Lett. 2011;325(1):22–29.
- Rang J, He H, Yuan S, et al. Deciphering the metabolic pathway difference between Saccharopolyspora pogona and Saccharopolyspora spinosa by comparative proteomics and metabonomics. Front Microbiol. 2020;11:396.
- Yang Q, Ding X, Liu X, et al. Differential proteomic profiling reveals regulatory proteins and novel links between primary metabolism and spinosad production in Saccharopolyspora spinosa. Microb Cell Fact. 2014;13(1):27.
- Zhang X, Xue C, Zhao F, et al. Suitable extracellular oxidoreduction potential inhibit rex regulation and effect central carbon and energy metabolism in Saccharopolyspora spinosa. Microb Cell Fact. 2014;13:98.
- Zhao C, Huang Y, Guo C, et al. Heterologous expression of spinosyn biosynthetic gene cluster in Streptomyces species is dependent on the expression of rhamnose biosynthesis genes. J Mol Microbiol Biotechnol. 2017;27(3):190–198.
- Zhang C, Xue C, Shen Y, et al. Selection of reference genes in Saccharopolyspora Spinosa for real-time PCR. Trans Tianjin Univ. 2015;21(5):461–467.
- Rio DC, Ares M, Hannon GJ, et al. Purification of RNA using TRIzol (TRI reagent). Cold Spring Harb Protoc. 2010;2010(6):pdb.prot5439.
- Li S, Wang W, Li X, et al. Genome-wide identification and characterization of reference genes with different transcript abundances for Streptomyces coelicolor. Sci Rep. 2015;5:15840.
- Tanaka Y, Komatsu M, Okamoto S, et al. Antibiotic overproduction by rpsL and rsmG mutants of various actinomycetes. Appl Environ Microbiol. 2009;75(14):4919–4922.
- Saddhe AA, Malvankar MR, Kumar K. Selection of reference genes for quantitative real-time PCR analysis in halophytic plant Rhizophora apiculata. Peer J. 2018;6:e5226.
- Sinha P, Singh VK, Suryanarayana L, et al. Evaluation and validation of housekeeping genes as reference for gene expression studies in pigeonpea (Cajanus cajan) under drought stress conditions. PLoS One. 2015;10(4):e0122847.
- Andersen CL, Jensen JL, Rntoft TF. Normalization of real-time quantitative reverse transcription-PCR data: a model-based variance estimation approach to identify genes suited for normalization, applied to bladder and colon cancer data sets. Cancer Res. 2004;64(15):5245–5250.
- Pfaffl MW, Tichopad A, Prgomet C, et al. Determination of stable housekeeping genes, differentially regulated target genes and sample integrity: BestKeeper-Excel-based tool using pair-wise correlations. Biotechnol Lett. 2004;26(6):509–515.
- Vandesompele J, De Preter K, Pattyn F, et al. Accurate normalization of real-time quantitative RT-PCR data by geometric averaging of multiple internal control genes. Genome Biol. 2002;3(7):RESEARCH0034.1.
- Bustin SA, Benes V, Garson JA, et al. The MIQE guidelines: minimum information for publication of quantitative real-time PCR experiments. Clin Chem. 2009;55(4):611–622.
- Bustin SA, Benes V, Nolan T, et al. Quantitative real-time RT-PCR-a perspective. J Mol Endocrinol. 2005;34(3):597–601.
- Niu X, Chen M, Huang X, et al. Reference gene selection for qRT-PCR normalization analysis in kenaf (Hibiscus cannabinus L.) under abiotic stress and hormonal stimuli. Front Plant Sci. 2017;8:771.
- Pinto F, Pacheco CC, Ferreira D, et al. Selection of suitable reference genes for RT-qPCR analyses in cyanobacteria. PLoS One. 2012;7(4):e34983.
- Hampton TH, Koeppen K, Bashor L, et al. Selection of reference genes for quantitative PCR: identifying reference genes for airway epithelial cells exposed to Pseudomonas aeruginosa. Am J Physiol Lung Cellular Mol Physiol. 2020;319:256–265.
- Li Y, Yu Z, Zhu Y, et al. Selection of nitrite-degrading and biogenic amine-degrading strains and its involved genes. Food Qual Saf. 2020;4:225–235.
- Cankorur-Cetinkaya A, Dereli E, Eraslan S, et al. A novel strategy for selection and validation of reference genes in dynamic multidimensional experimental design in yeast. PLoS One. 2012;7(6):e38351.
- Sun ZB, Li SD, Sun MH. Selection of reliable reference genes for gene expression studies in Clonostachys rosea 67-1 under sclerotial induction. J Microbiol Methods. 2015;114:62–65.
- Bao Z, Zhang K, Lin H, et al. Identification and selection of reference genes for quantitative transcript analysis in Corydalis yanhusuo. Genes. 2020;11(2):130.
- Long X, Lu J, Kav NNV, et al. Identification and evaluation of suitable reference genes for gene expression analysis in rubber tree leaf. Mol Biol Rep. 2020;47:7.
- Miao L, Qin X, Gao LH, et al. Selection of reference genes for quantitative real-time PCR analysis in cucumber (Cucumis sativus L.), pumpkin (Cucurbita moschata Duch.) and cucumber-pumpkin grafted plants. PeerJ. 2019;7:e6536.
- Turroni S, Bendazzoli C, Dipalo SCF, et al. Oxalate-degrading activity in Bifidobacterium animalis subsp. lactis: impact of acidic conditions on the transcriptional levels of the oxalyl coenzyme A (CoA) decarboxylase and formyl-CoA transferase genes. Appl Environ Microbiol. 2010;76(16):5609–5620.
- Bujold AR, Macinnes JI. Validation of reference genes for quantitative real-time PCR (qPCR) analysis of Actinobacillus suis. BMC Res Notes. 2015;8:86.
- Jacob TR, Laia ML, Ferro JA, et al. Selection and validation of reference genes for gene expression studies by reverse transcription quantitative PCR in Xanthomonas citri subsp. citri during infection of Citrus sinensis. Biotechnol Lett. 2011;33(6):1177–1184.
- Sihto H-M, Tasara T, Stephan R, et al. Validation of reference genes for normalization of qPCR mRNA expression levels in Staphylococcus aureus exposed to osmotic and lactic acid stress conditions encountered during food production and preservation. FEMS Microbiol Lett. 2014;356(1):134–140.
- Taurai T, Roger S. Evaluation of housekeeping genes in Listeria monocytogenes as potential internal control references for normalizing mRNA expression levels in stress adaptation models using real-time PCR. FEMS Microbiol Lett. 2007;269:265–272.
- Guerra SM, Rodríguez-García A, Santos-Aberturas J, et al. LAL regulators SCO0877 and SCO7173 as pleiotropic modulators of phosphate starvation response and actinorhodin biosynthesis in Streptomyces coelicolor. PLoS One. 2012;7(2):e31475.